Data Analysis
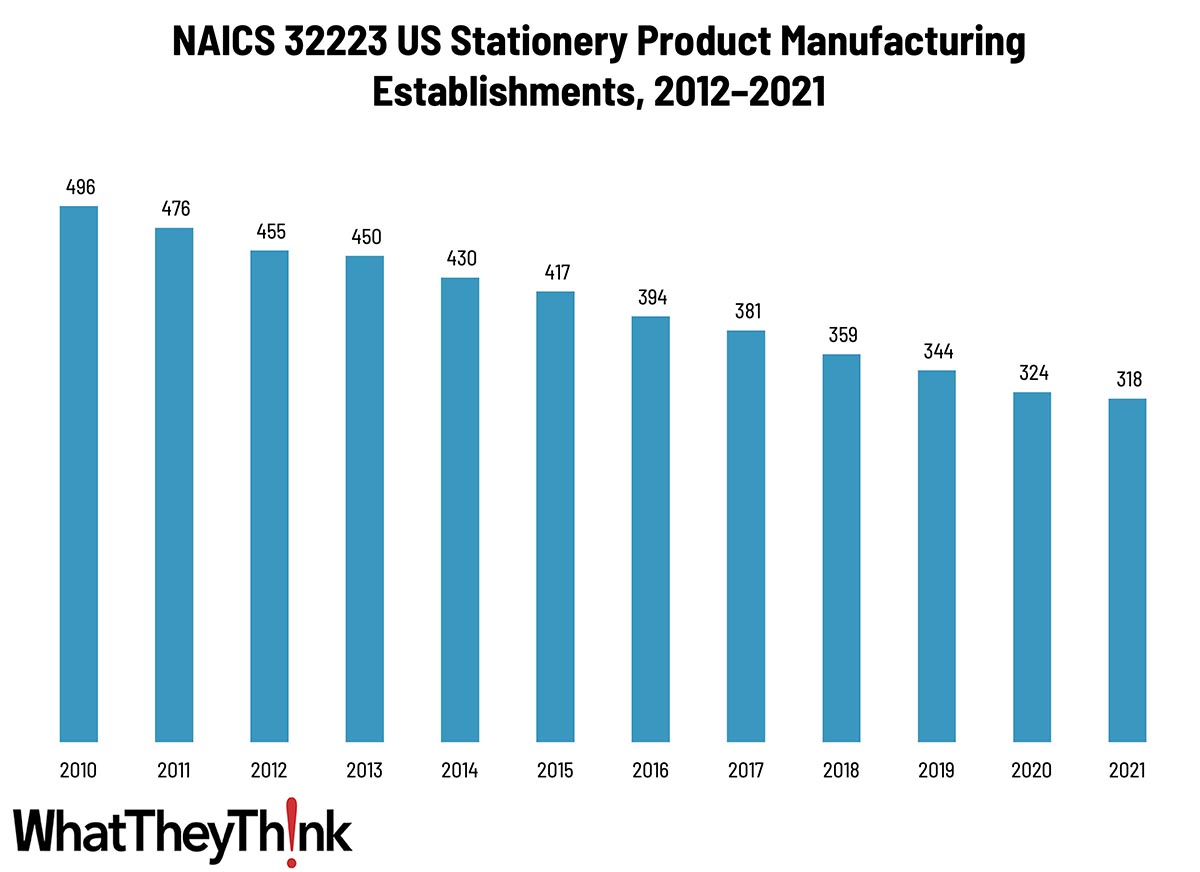
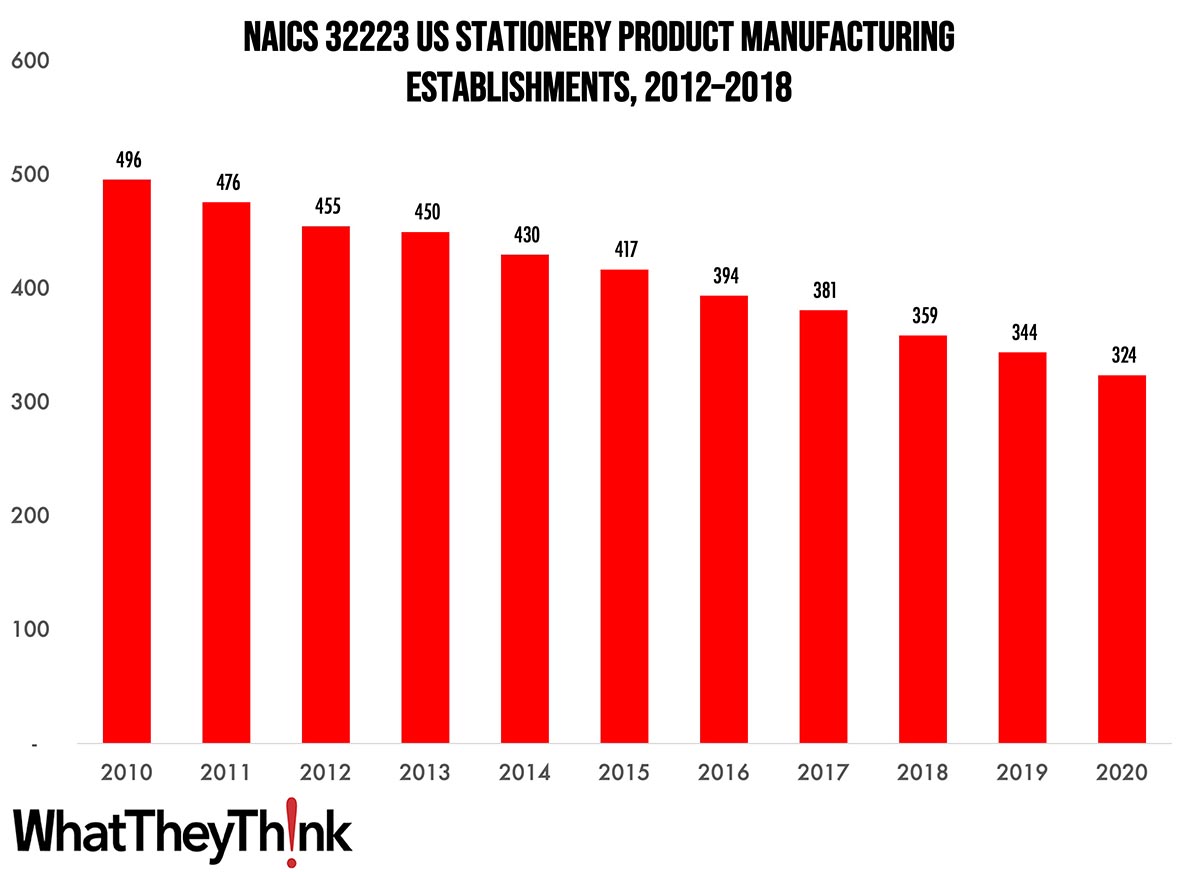
Stationery Product Manufacturing—2010–2021
Published: July 26, 2024
According to County Business Patterns, in 2021 there were 318 establishments in NAICS 32223 (Stationery Product Manufacturing). This category saw a net decrease in establishments of -36% since 2010. In macro news, June inflation was practically 0. Full Analysis
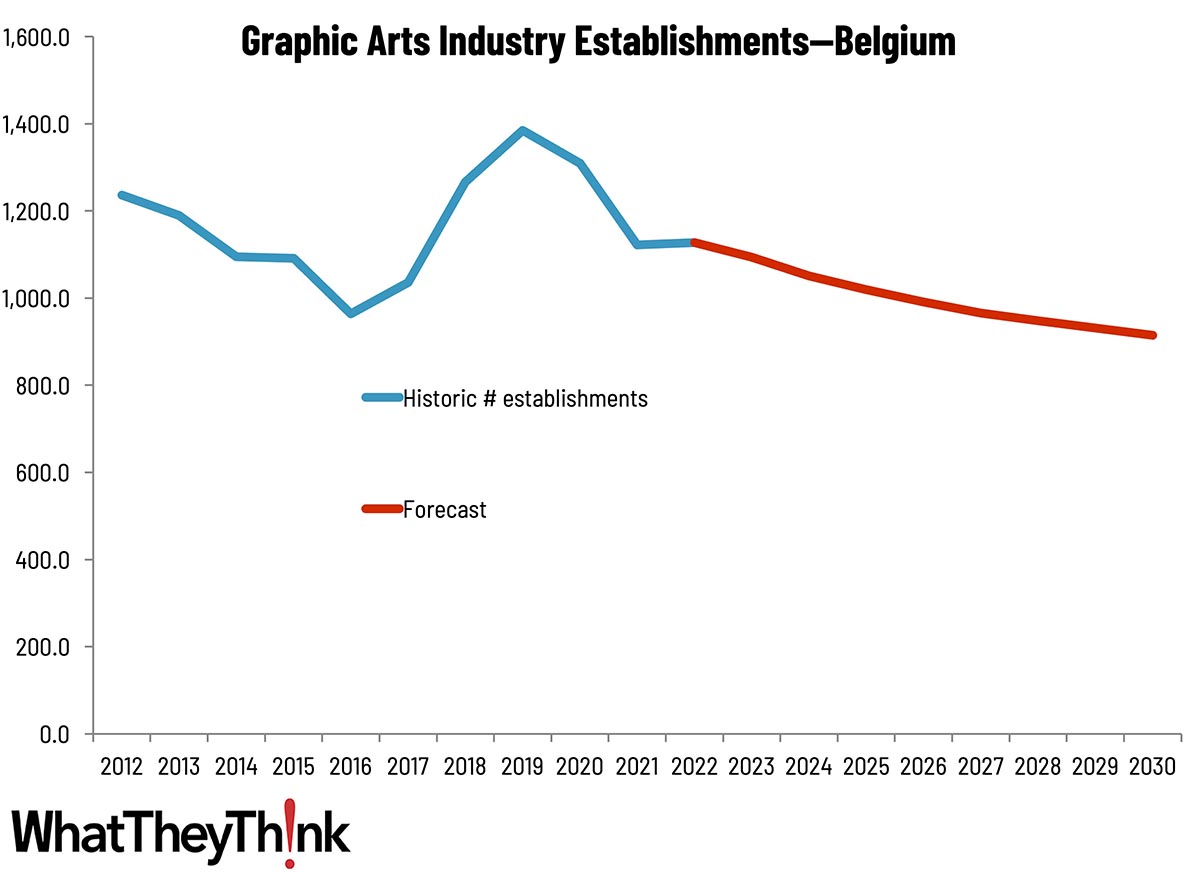
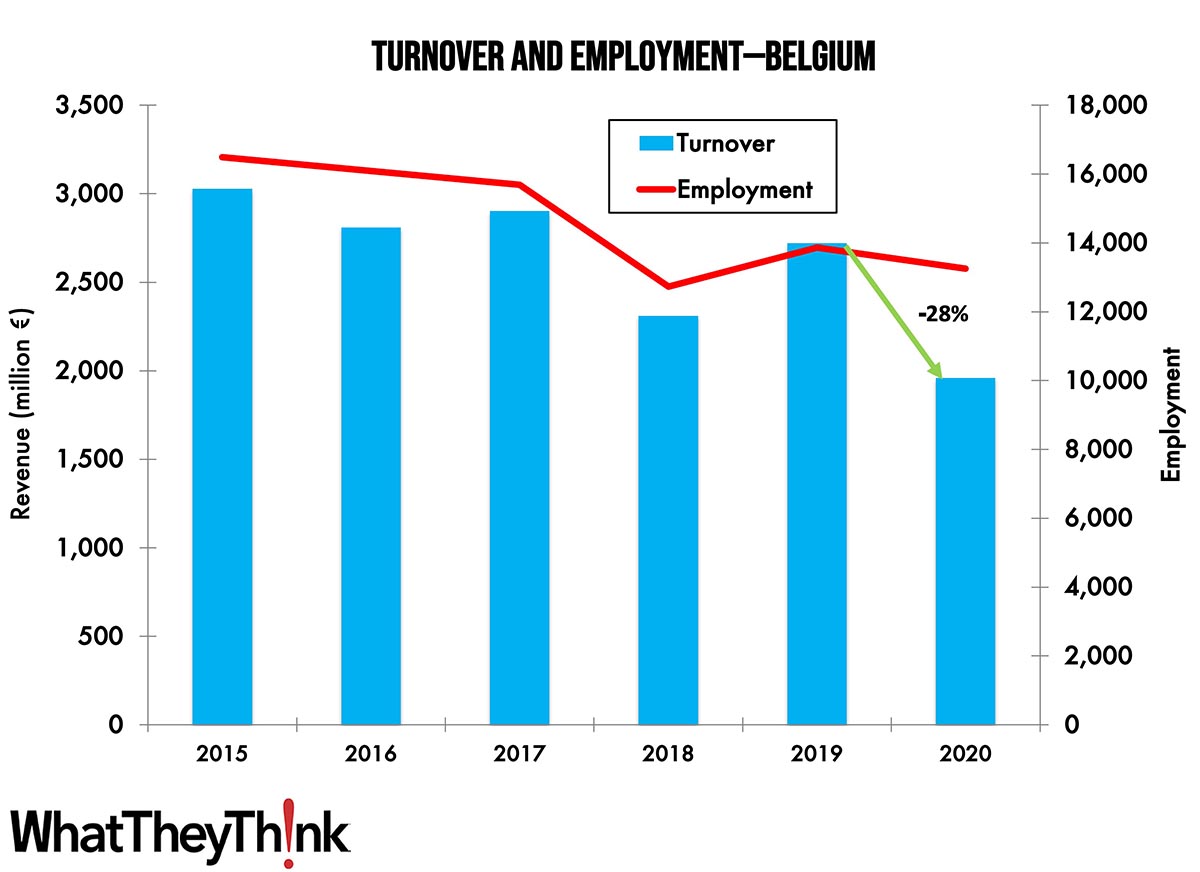
Sizing the Printing Industry in Europe—Belgium
Published: July 23, 2024
This bi-weekly series of short articles provides some country details on the size of the printing industry in Europe per country, especially tracking the number of printing establishments. This time we look at Belgium. Full Analysis
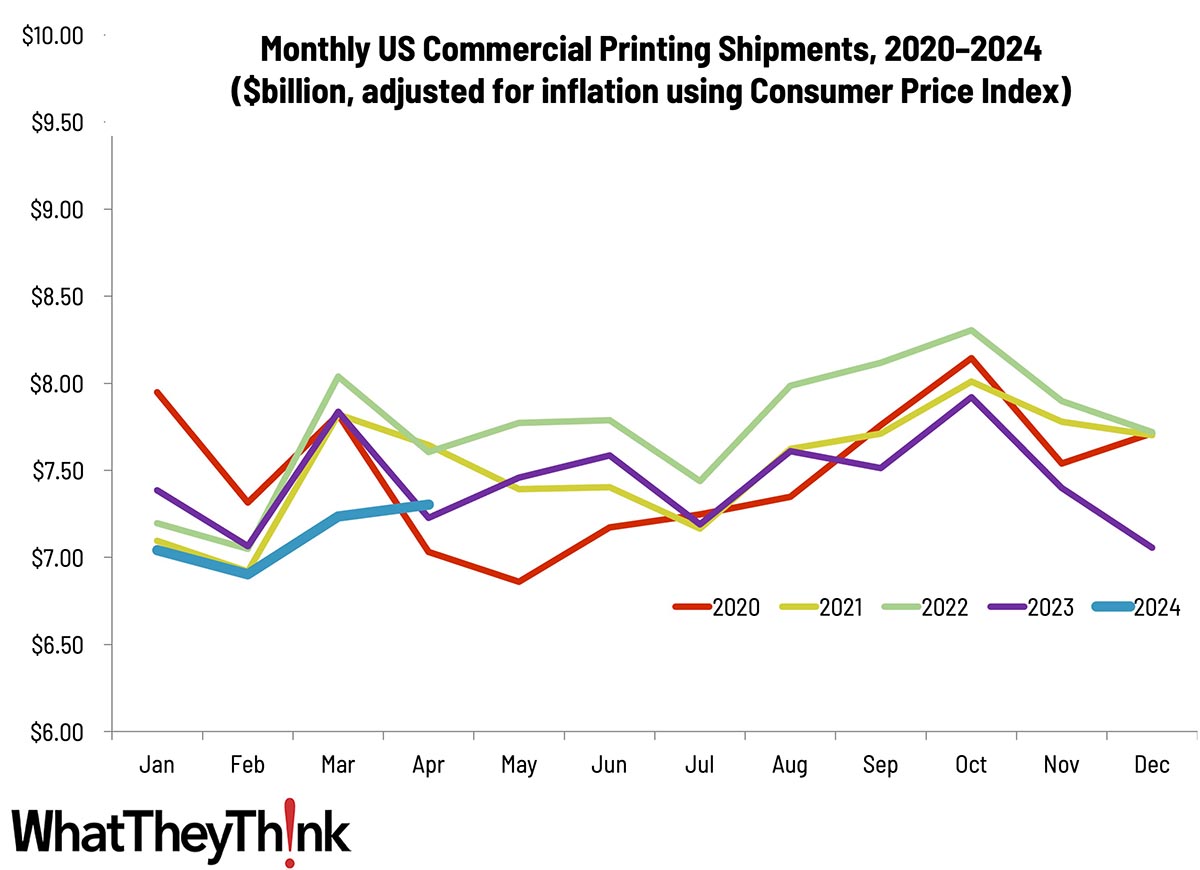
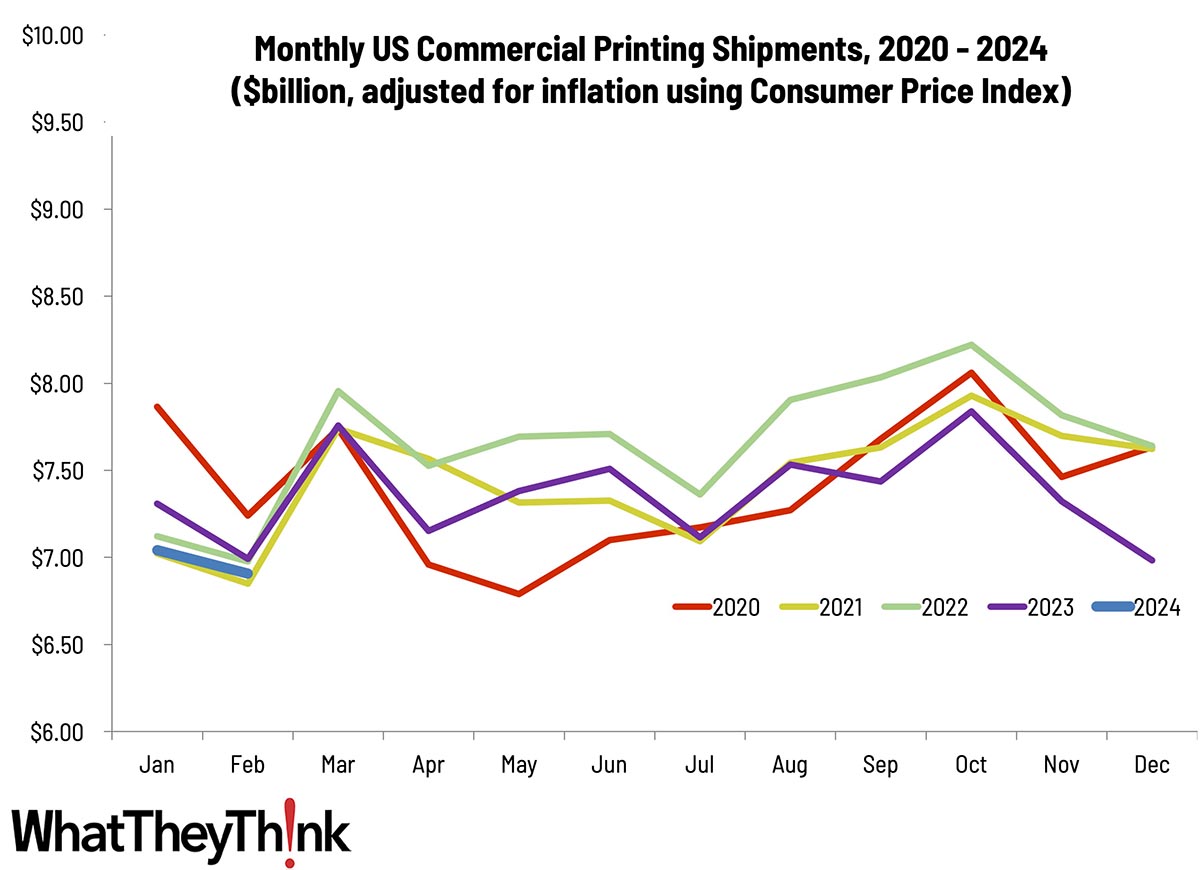
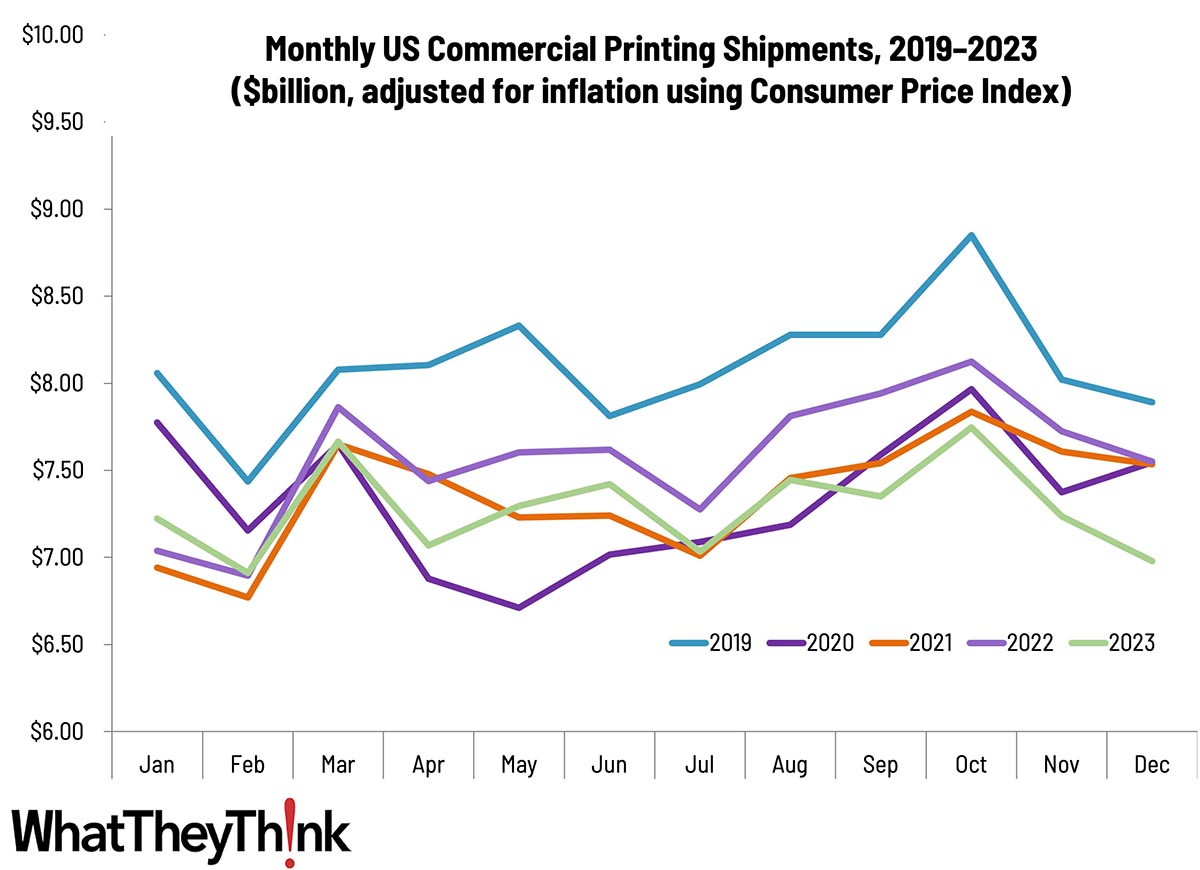
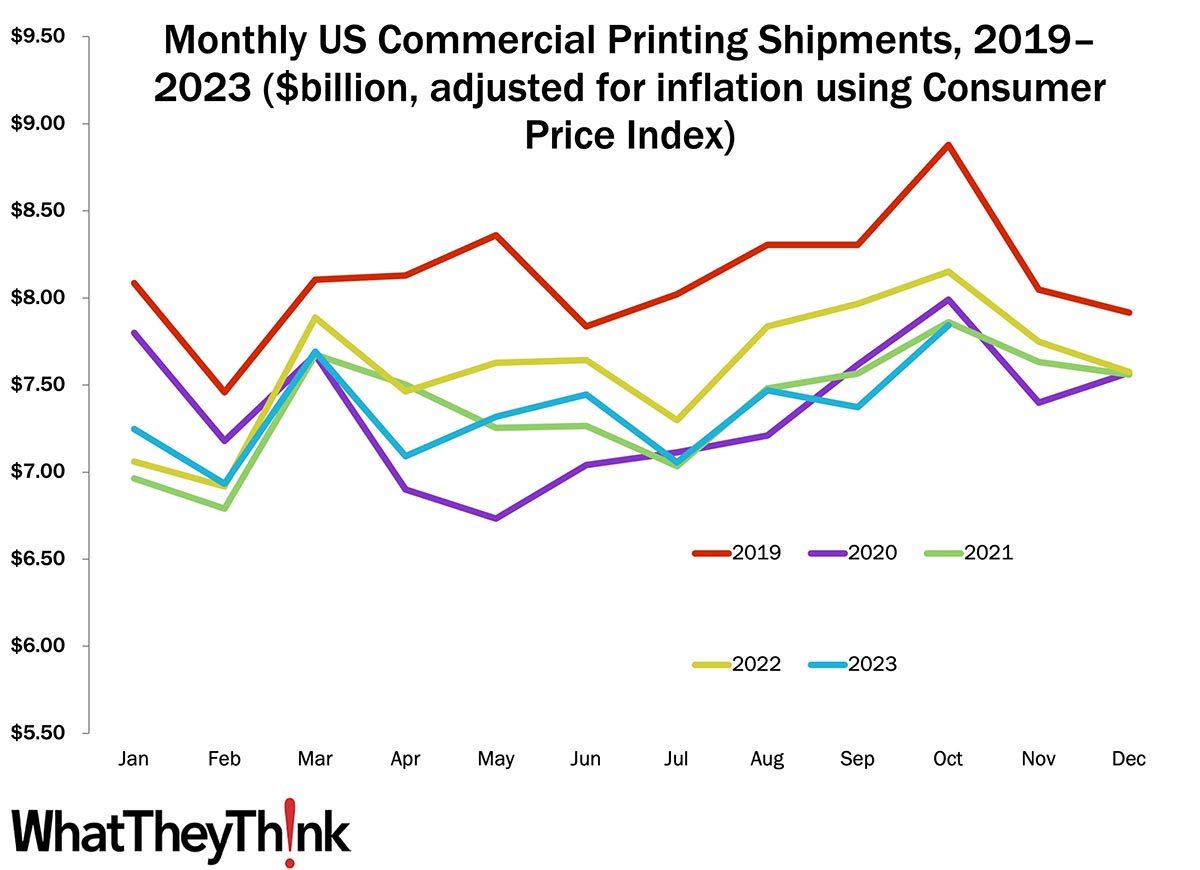
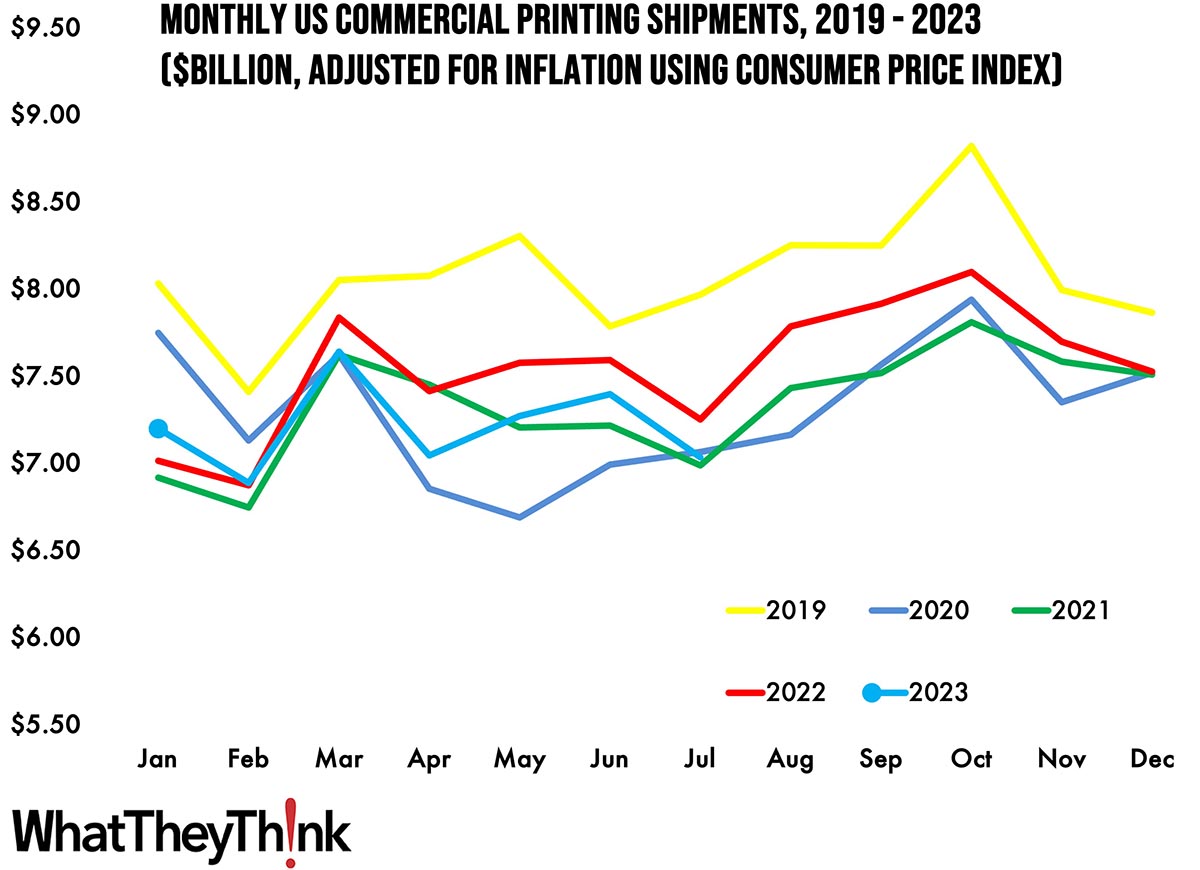
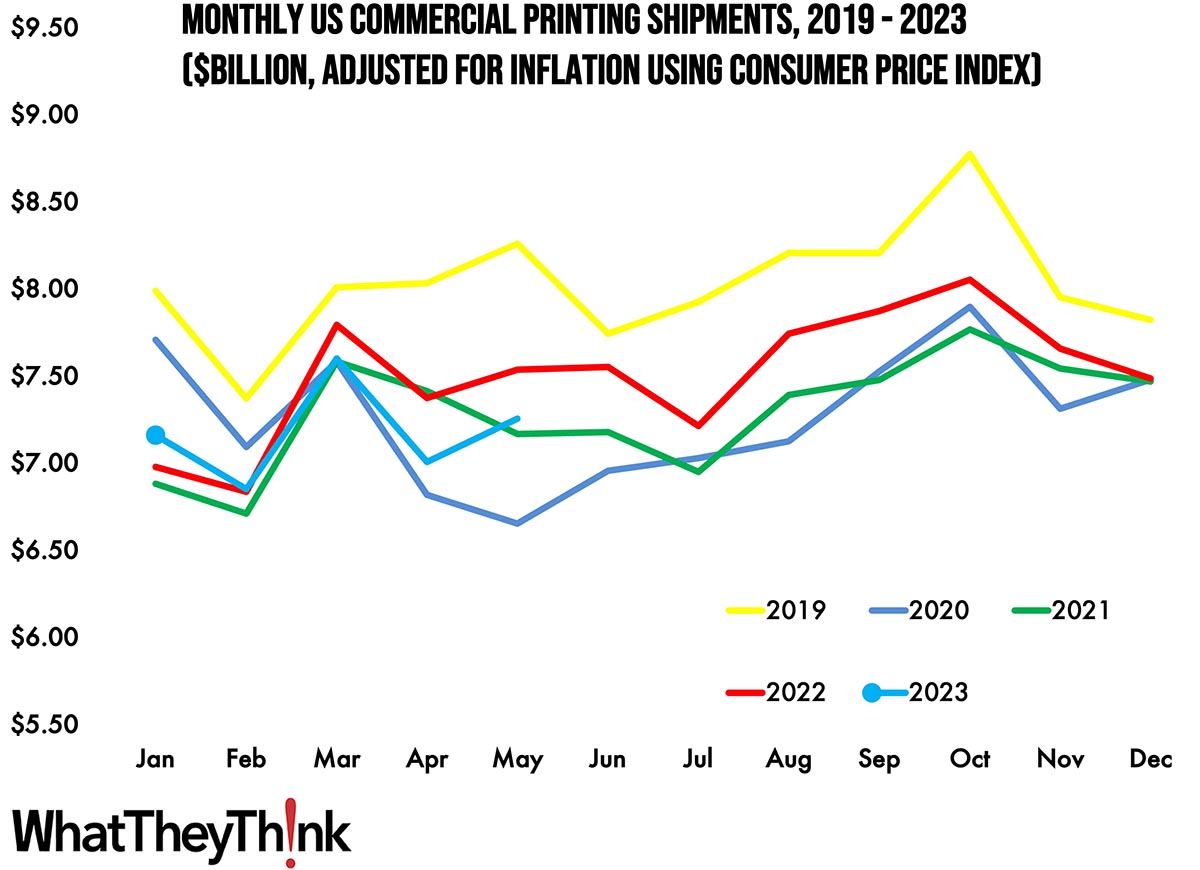
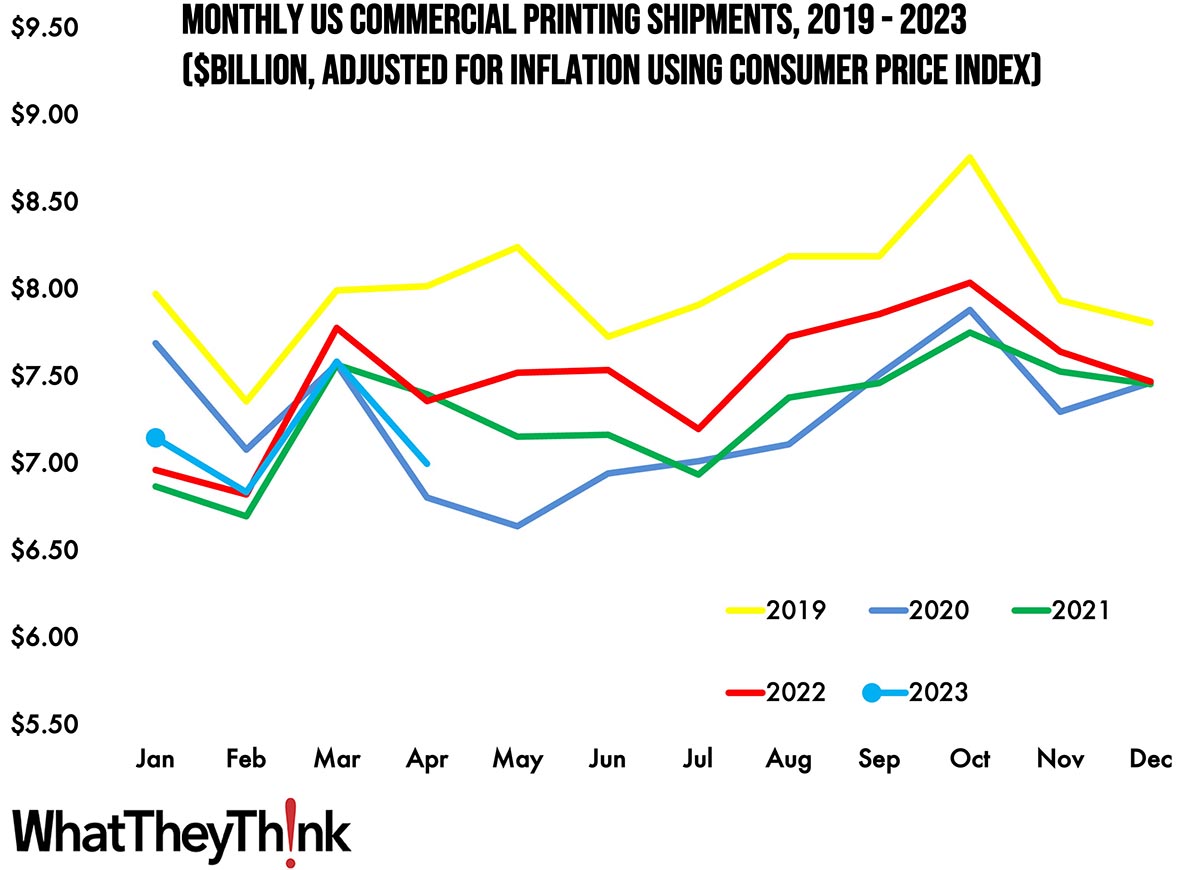
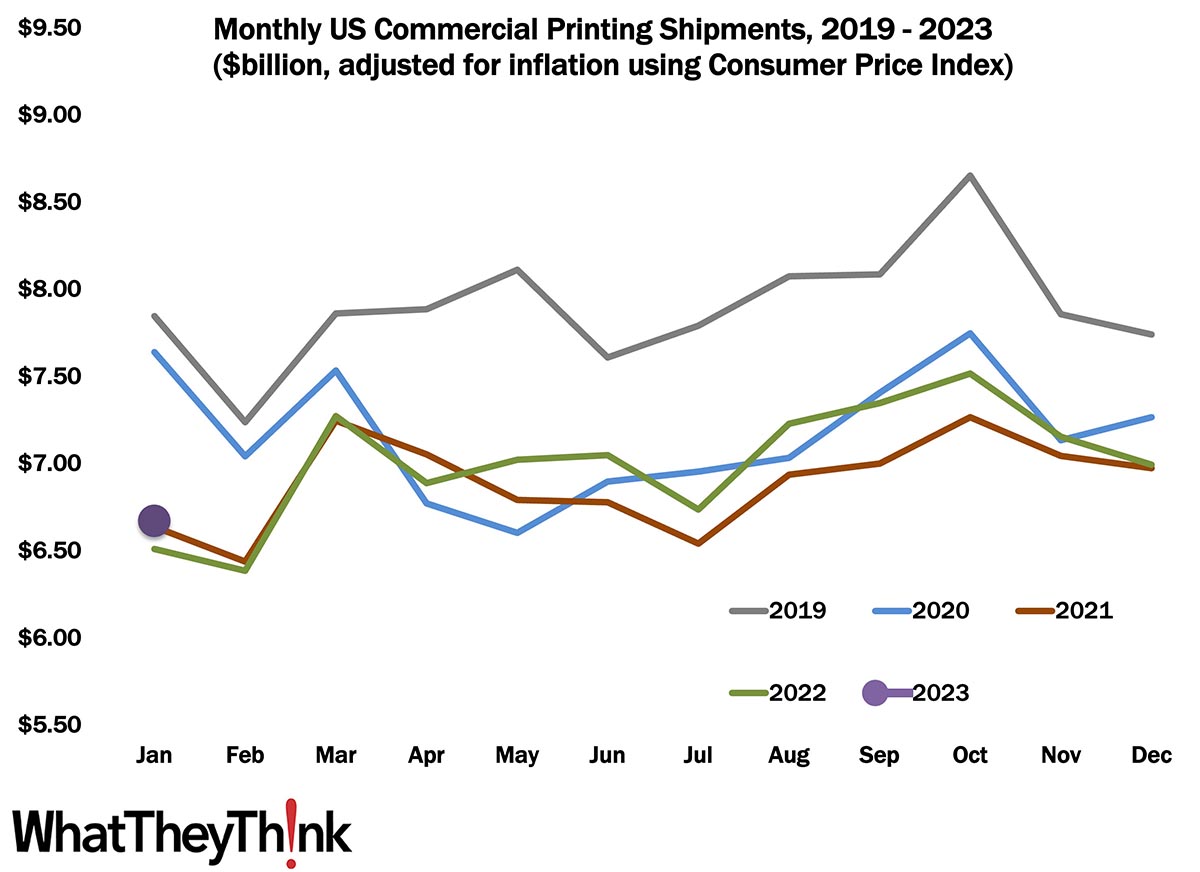
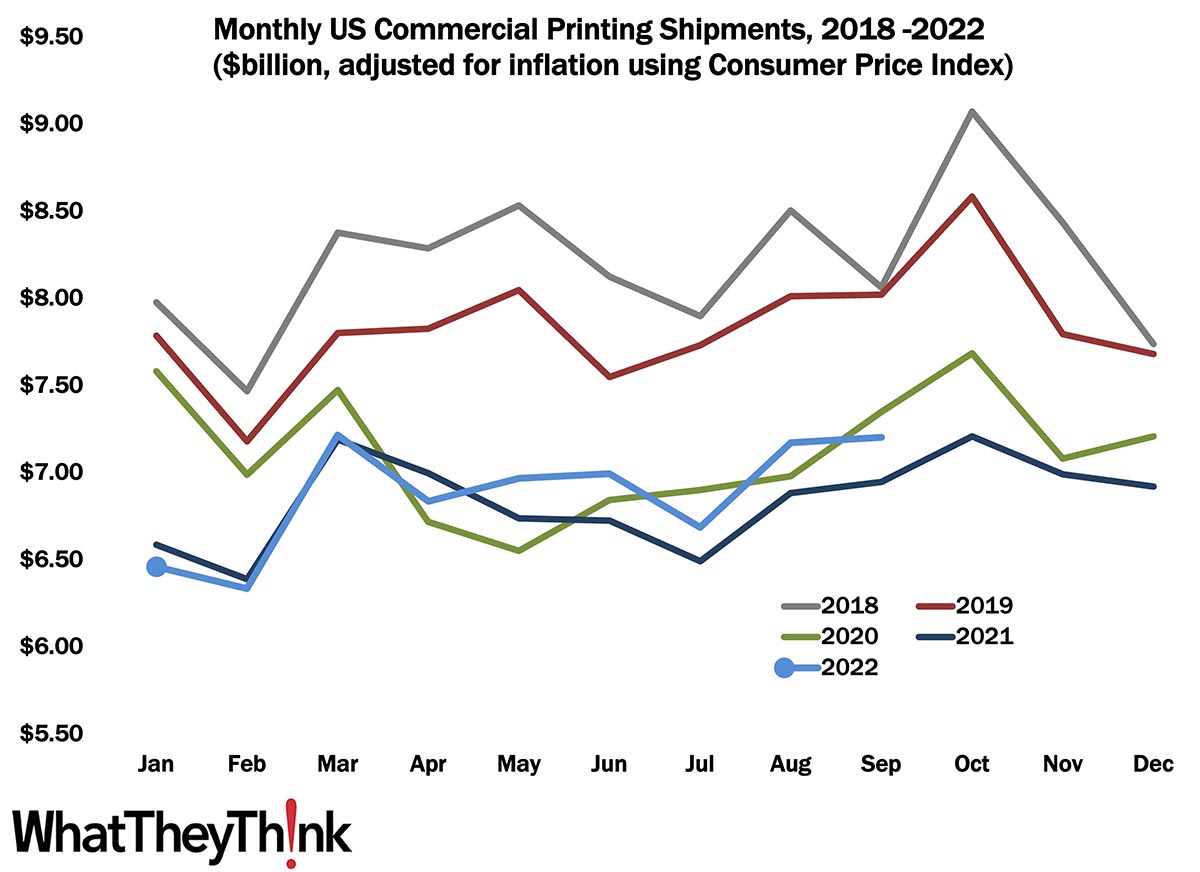
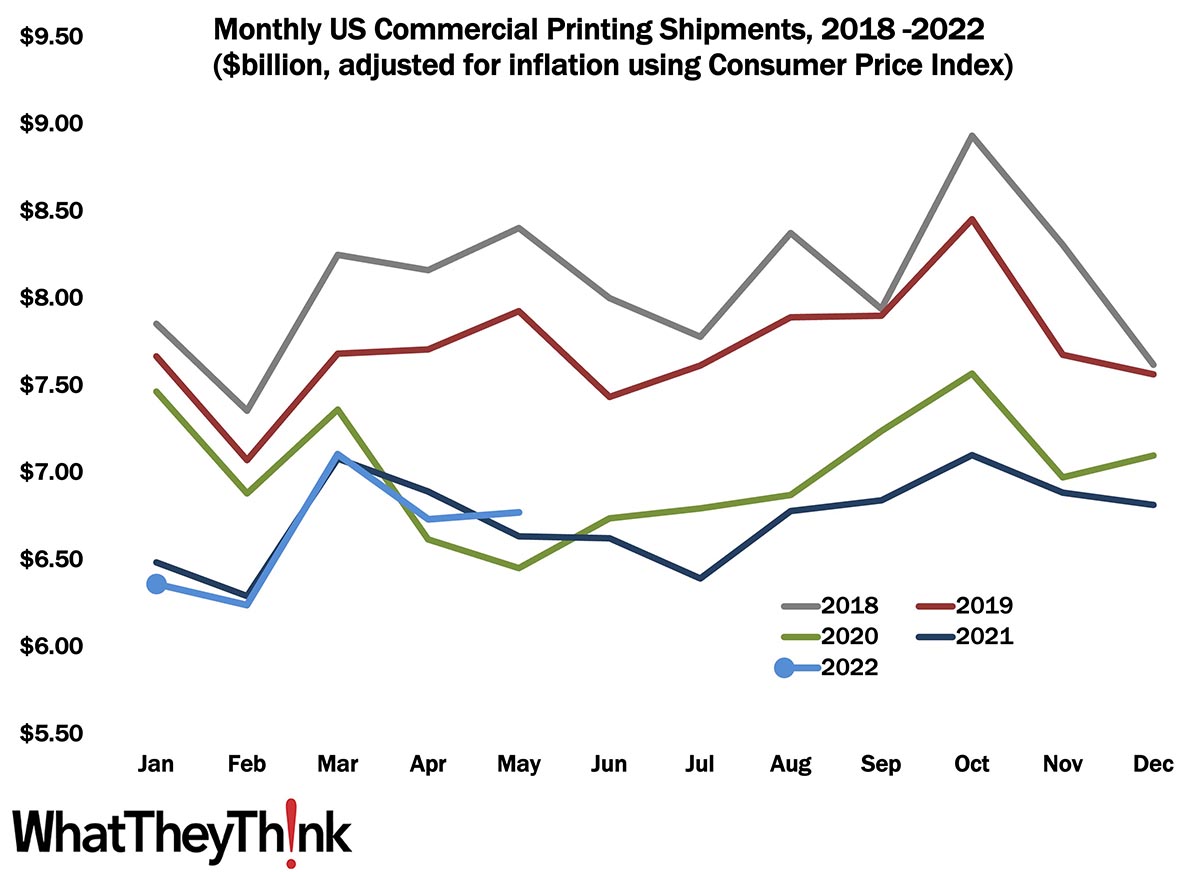
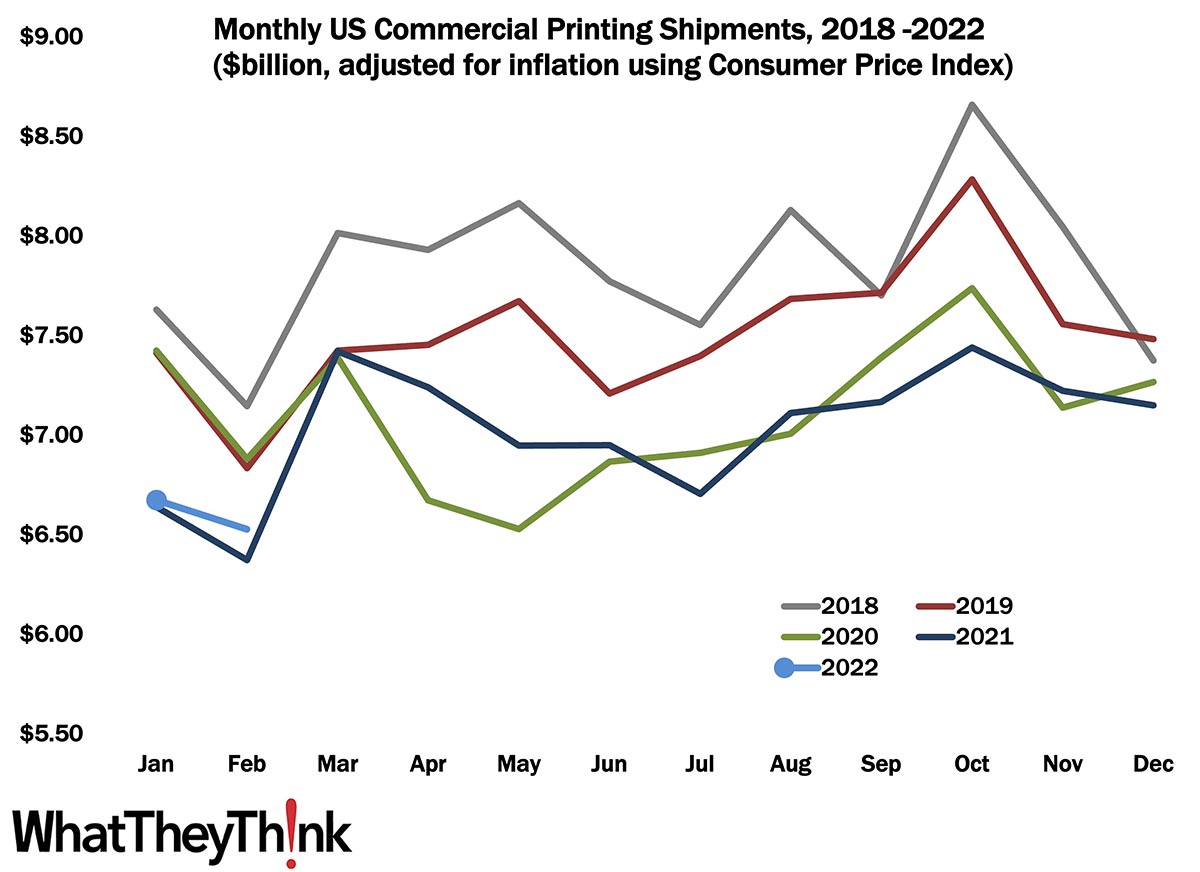
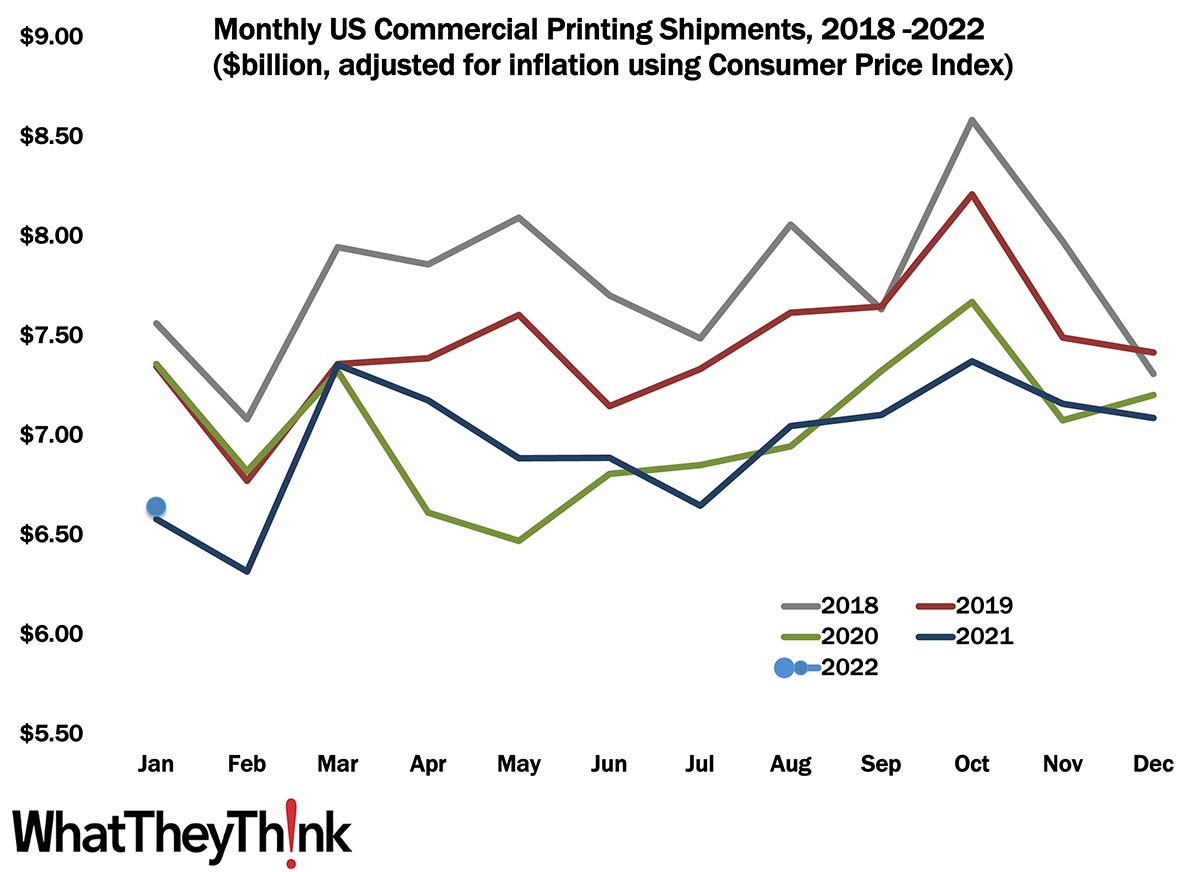
April Shipments: A Pleasant Surprise
Published: July 19, 2024
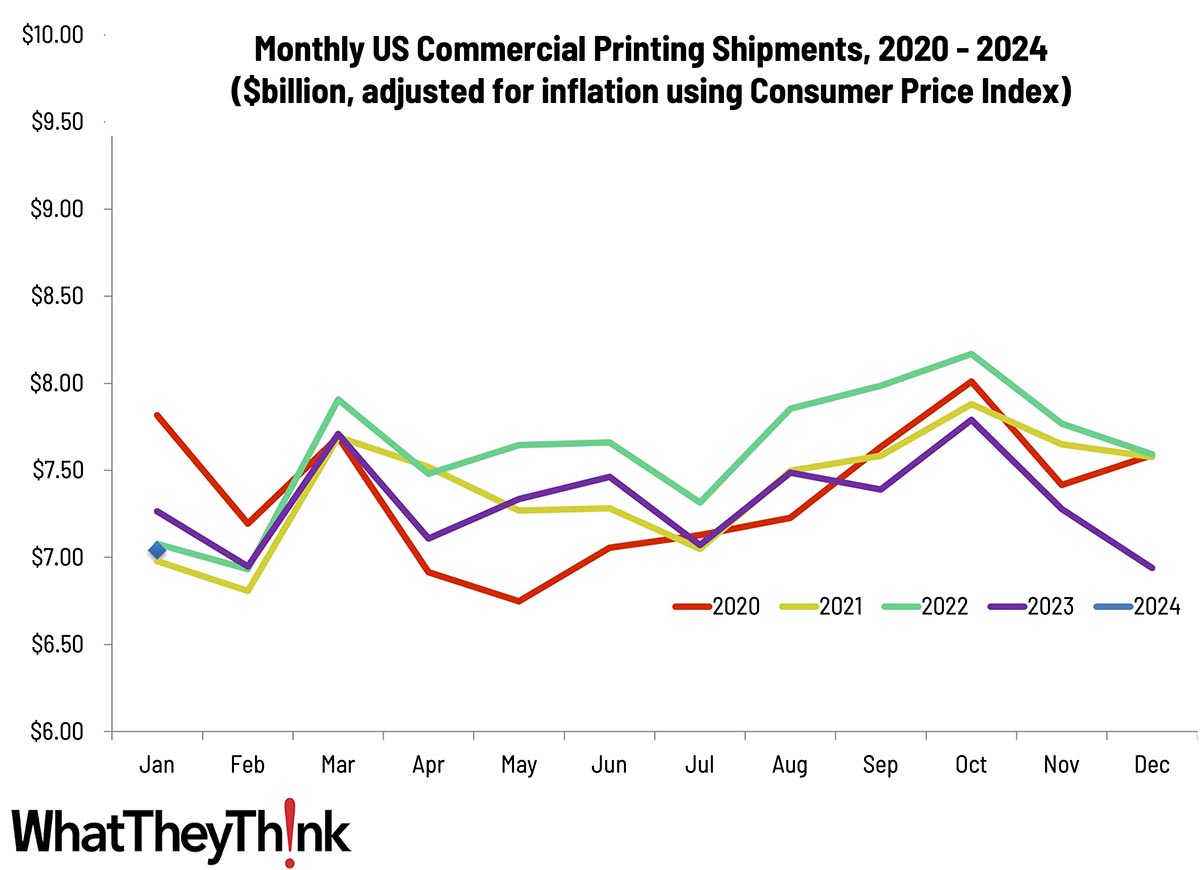
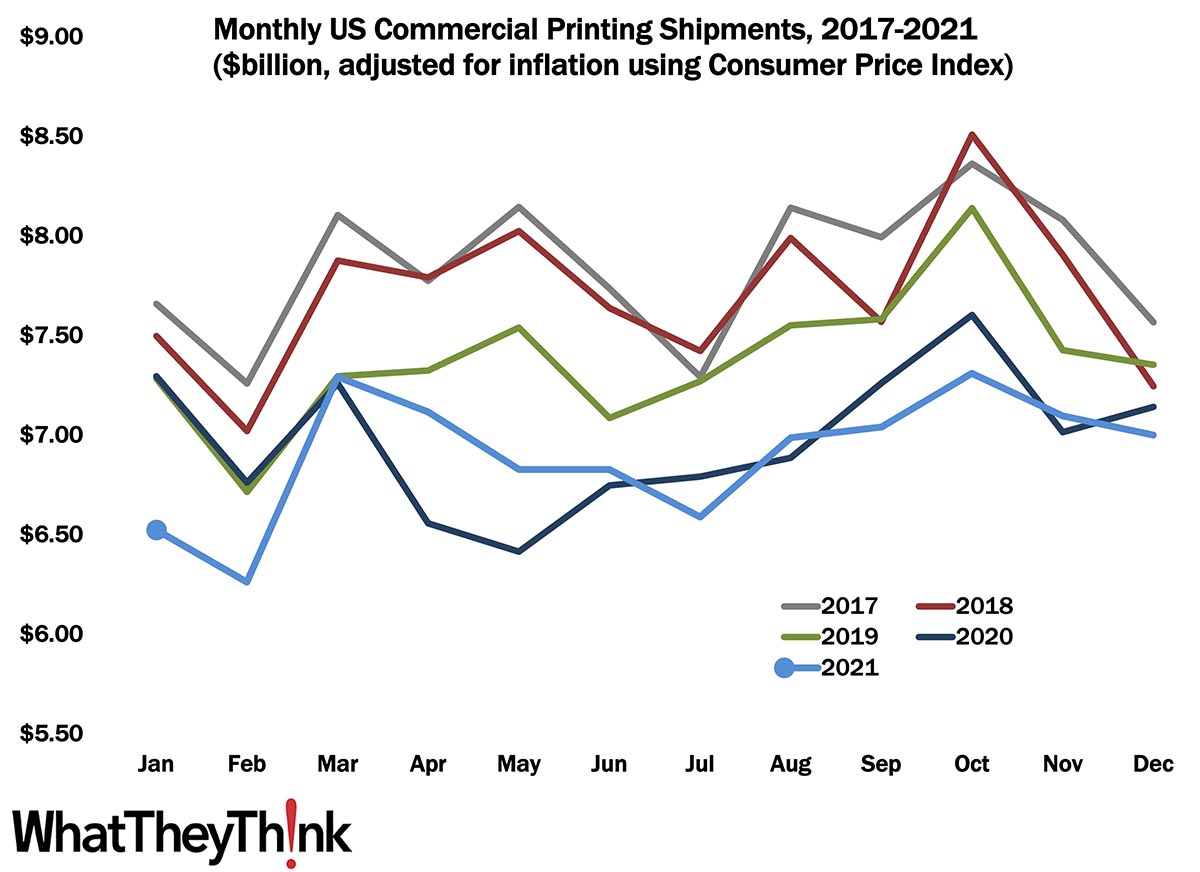
April 2024 shipments came in at $7.30 billion, up from March’s $7.24 billion—an unexpected but welcome rebound. Full Analysis
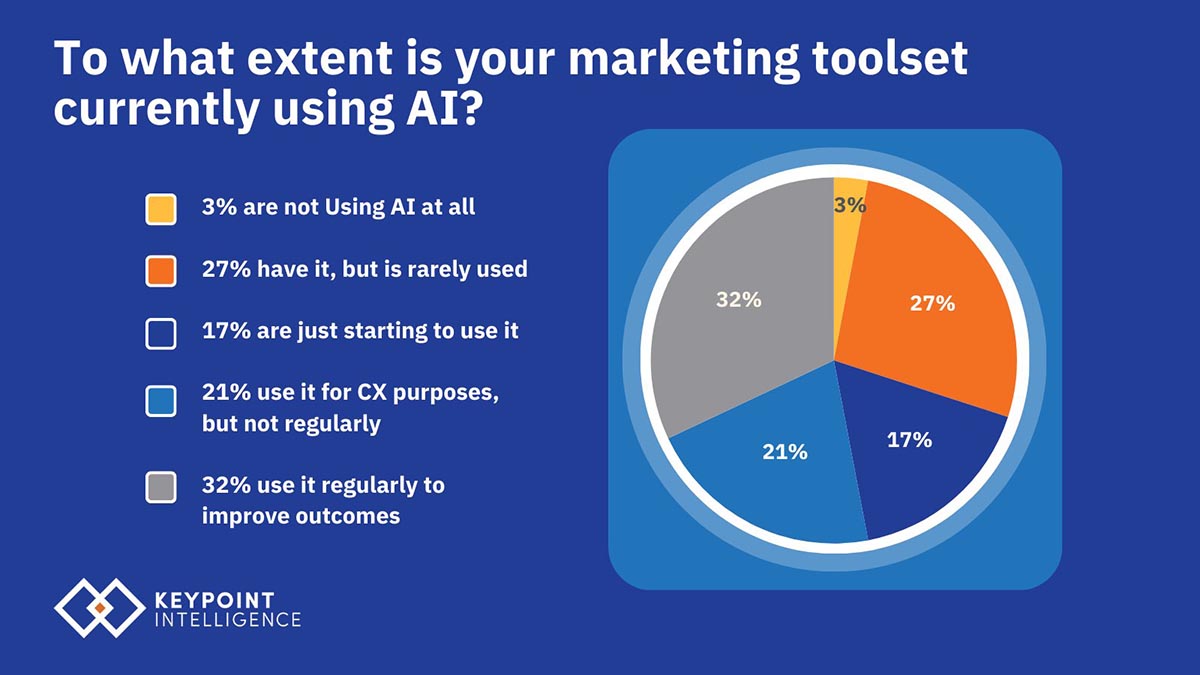
Artificial Intelligence and What It Means for Marketers
Published: July 12, 2024
Artificial intelligence (AI) significantly impacts marketing by improving customer experience and campaign effectiveness. This article explores AI's current influence and potential future impact on marketers. Discover how AI applications like static image recognition, tagging, and cyberattack prevention are transforming the marketing landscape. Arm yourself with the best data available and learn how to successfully leverage AI. Full Analysis
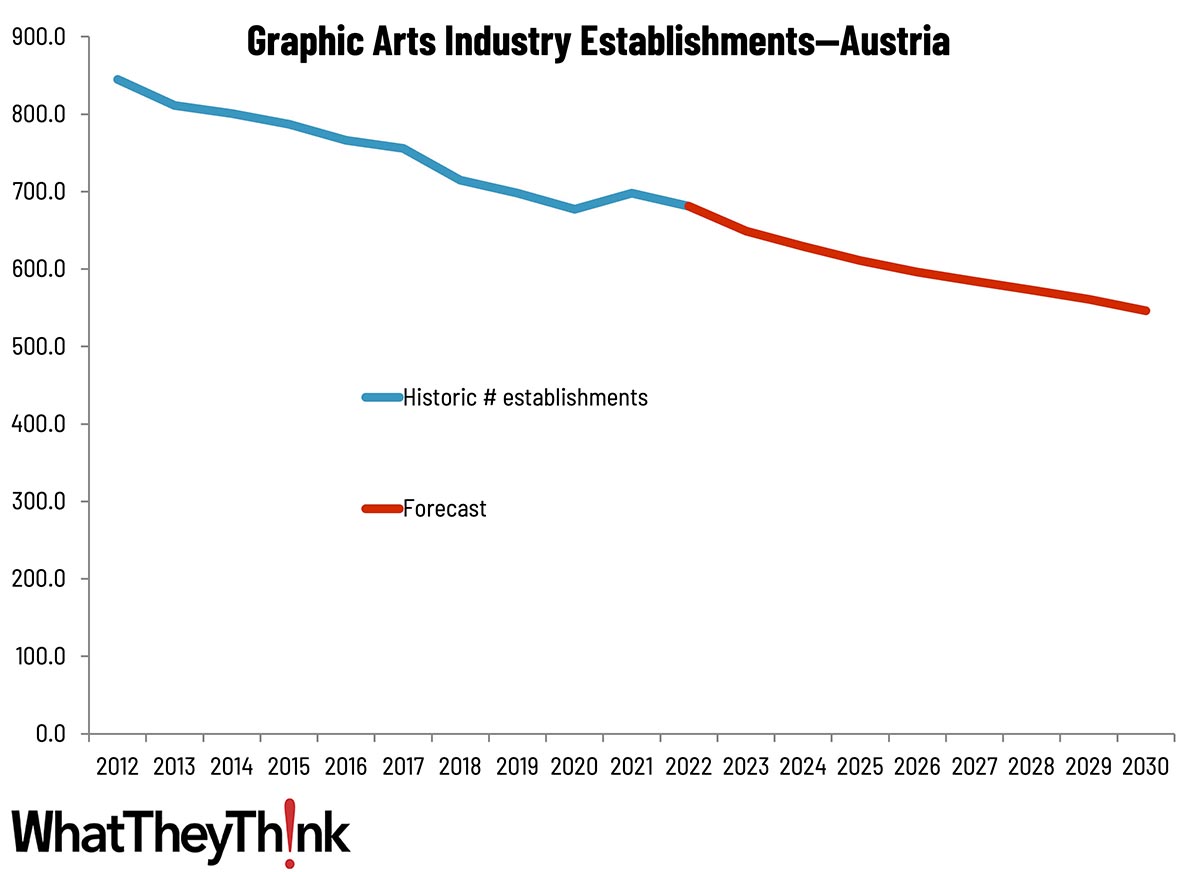
Sizing the Printing Industry in Europe—Austria
Published: July 8, 2024
This bi-weekly series of short articles provides some country details on the size of the printing industry in Europe per country, especially tracking the number of printing establishments. This time we look at Austria. Full Analysis
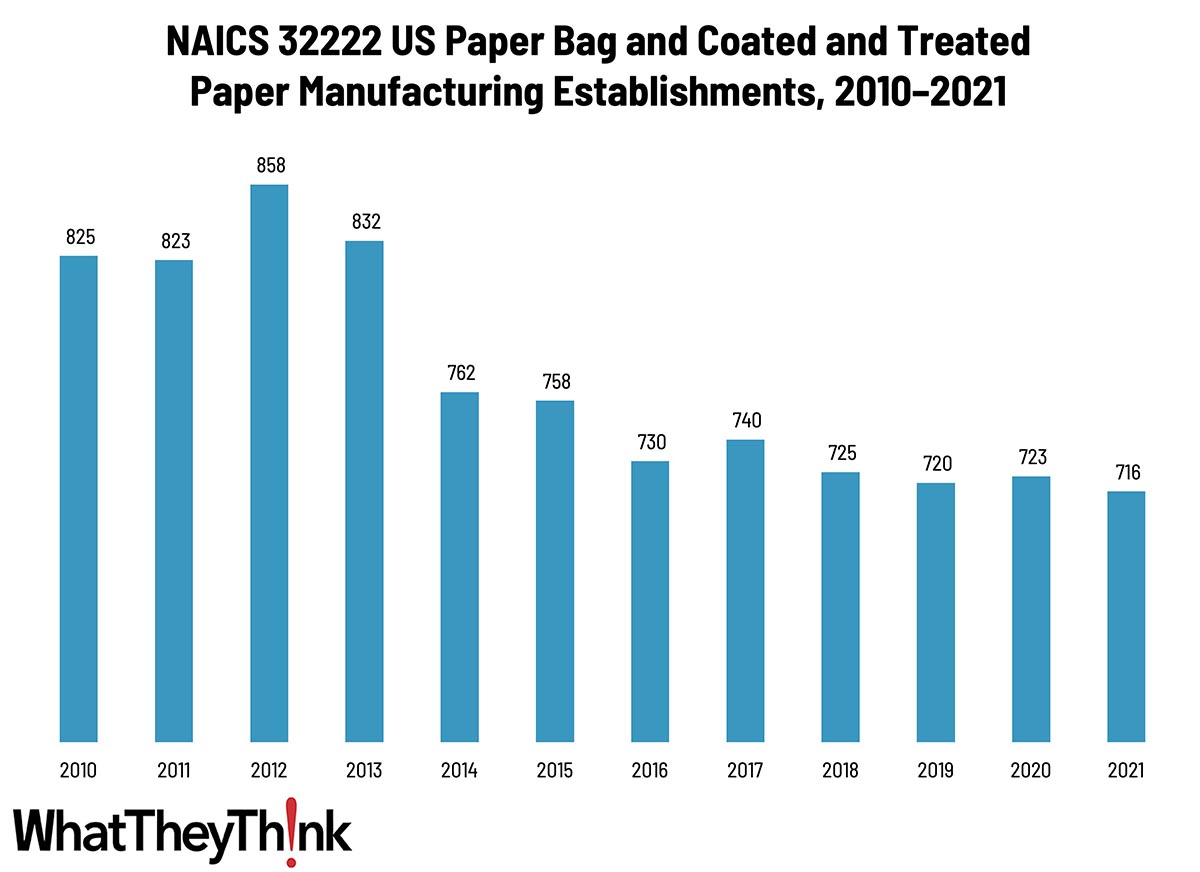
Paper Bag and Coated and Treated Paper Manufacturing—2010–2021
Published: June 28, 2024
According to County Business Patterns, in 2021 there were 276 establishments in NAICS 32222 (Paper Bag and Coated and Treated Paper Manufacturing). This category saw a net decrease in establishments of -13% since 2010. In macro news, Q1 GDP revised up to 1.4%. Full Analysis
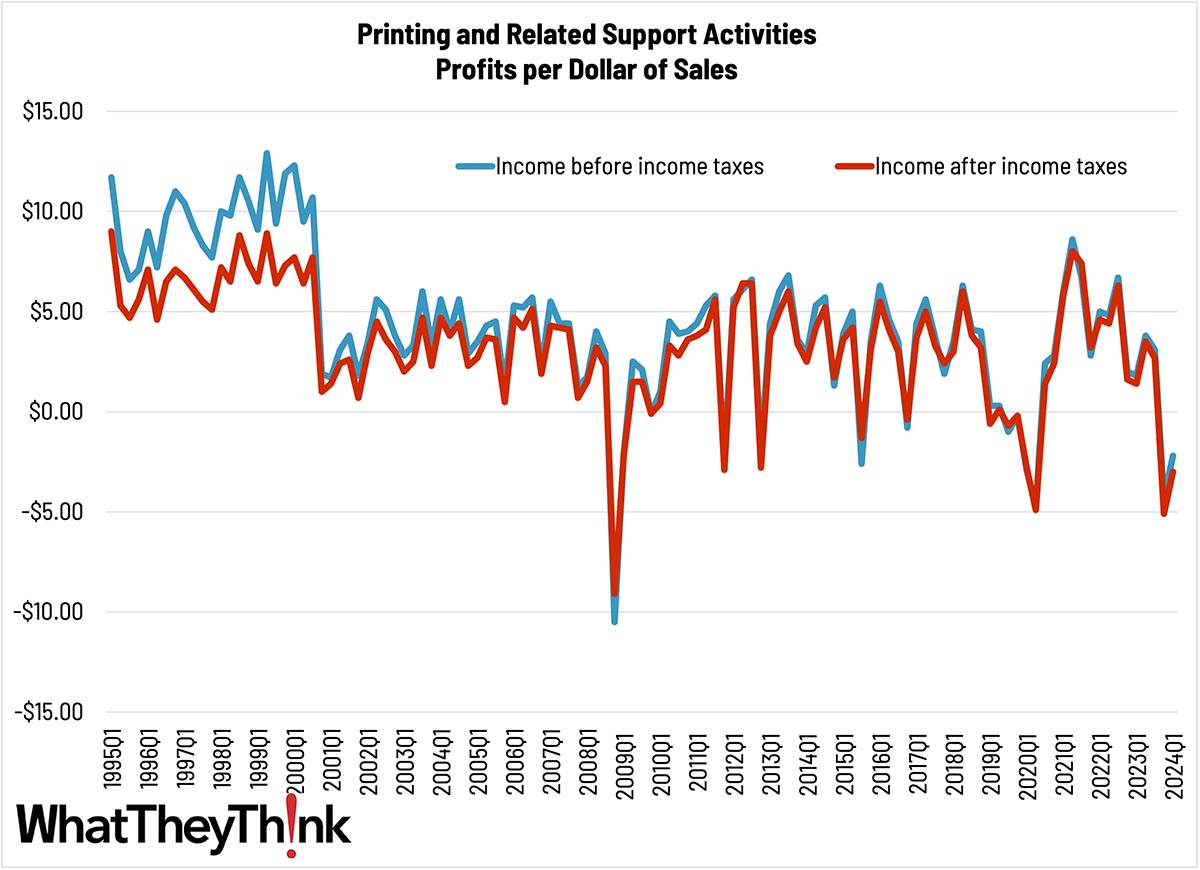
Q1 Industry Profits: The Two Cities Become One (and Not a Good One)
Published: June 21, 2024
Quarter-over-quarter profit margin data can be fairly noisy but had been on a general upward trend since the trough of the pandemic—although we had another crash in Q4 2023, which is proving difficult to climb out of. Full Analysis
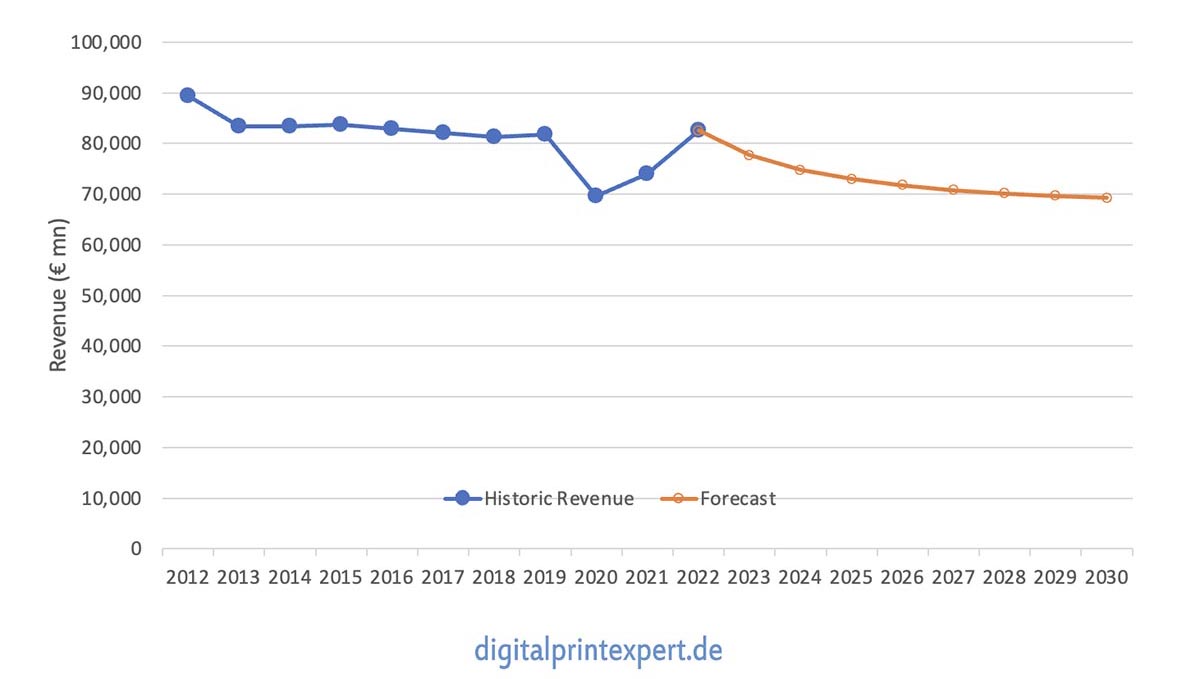
Sizing the European Print Industry
Published: June 18, 2024
Kicking off a regular series of country-by-country analyses, European section editor Ralf Schlözer looks at the demographics of the printing industry in Europe as a whole—identifying revenue, employment, and the number of establishments. Full Analysis
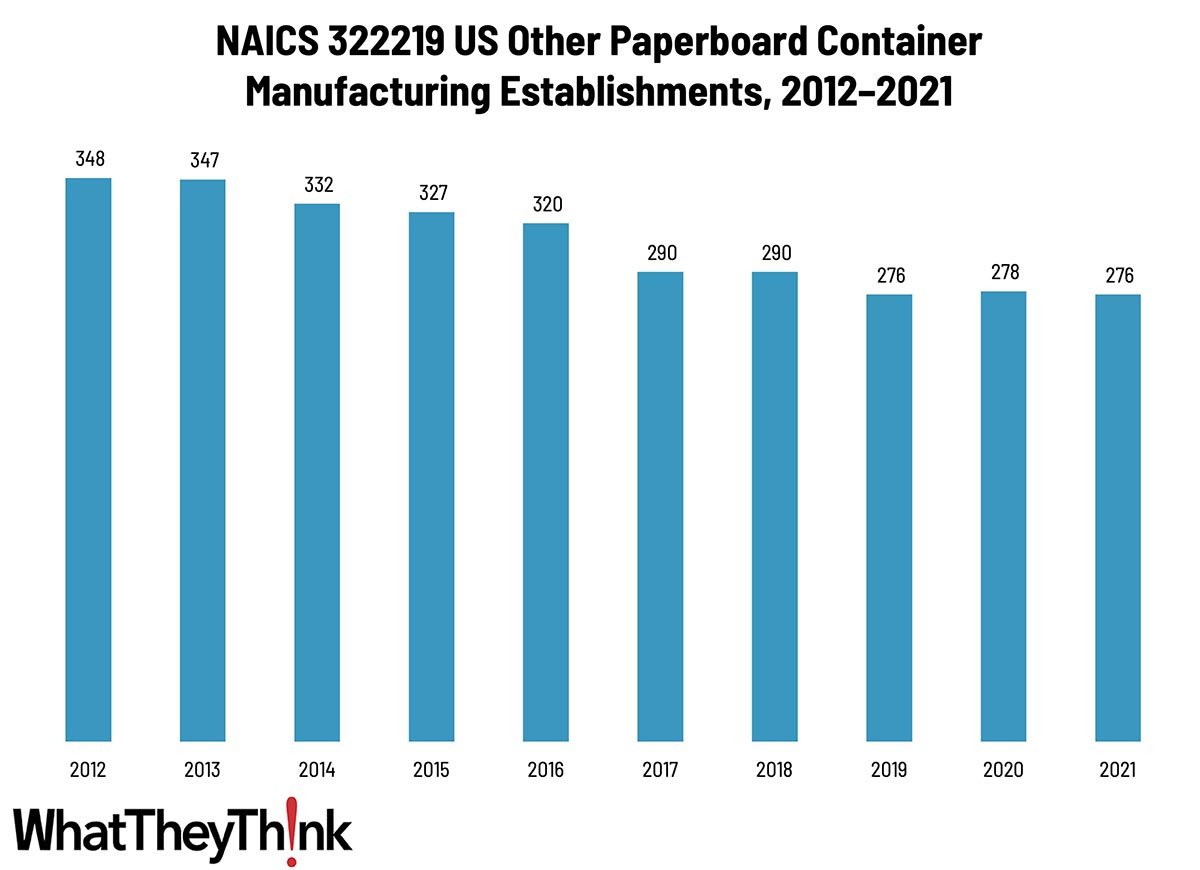
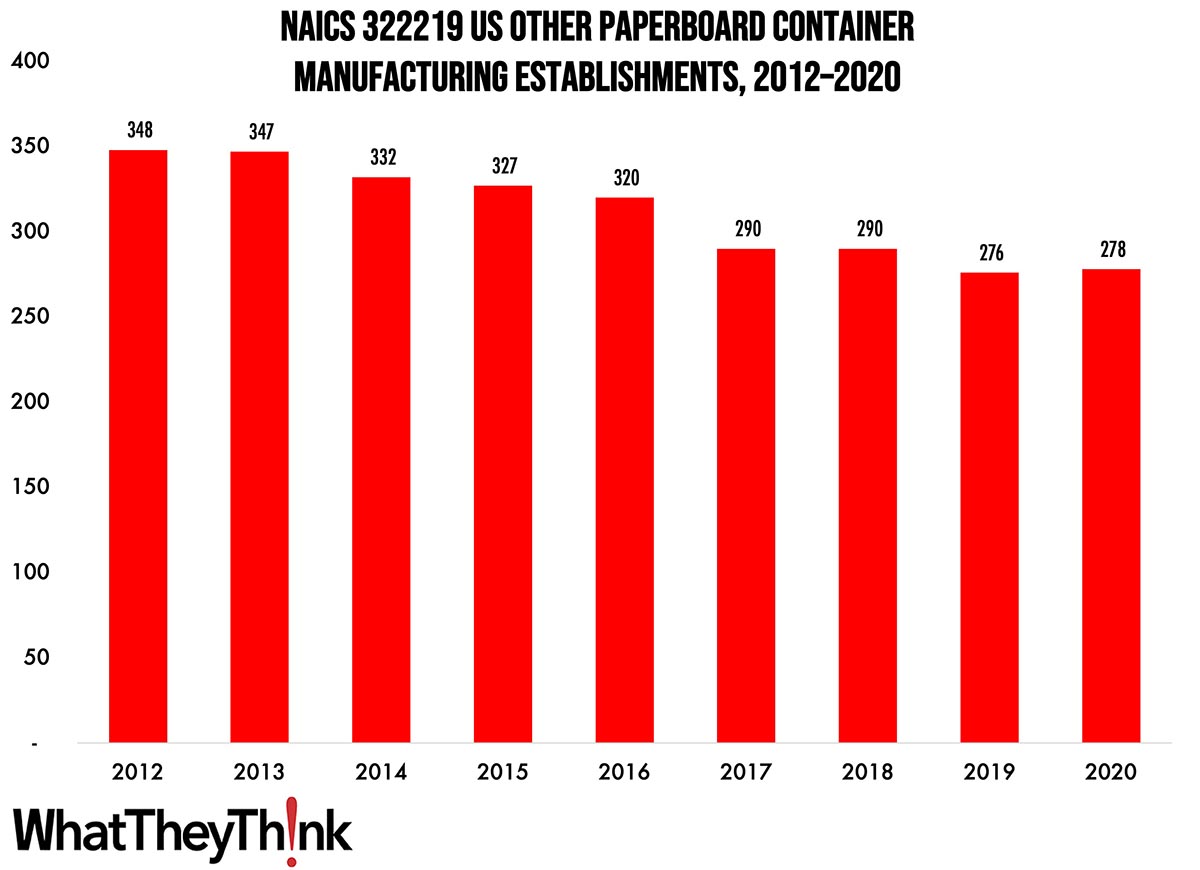
Other Paperboard Container Manufacturing Establishments—2010–2021
Published: June 14, 2024
According to County Business Patterns, in 2021 there were 276 establishments in NAICS 322219 (Other Paperboard Container Manufacturing). This category saw a net decrease in establishments of -21% since 2010. In macro news, inflation was virtually unchanged in May. Full Analysis
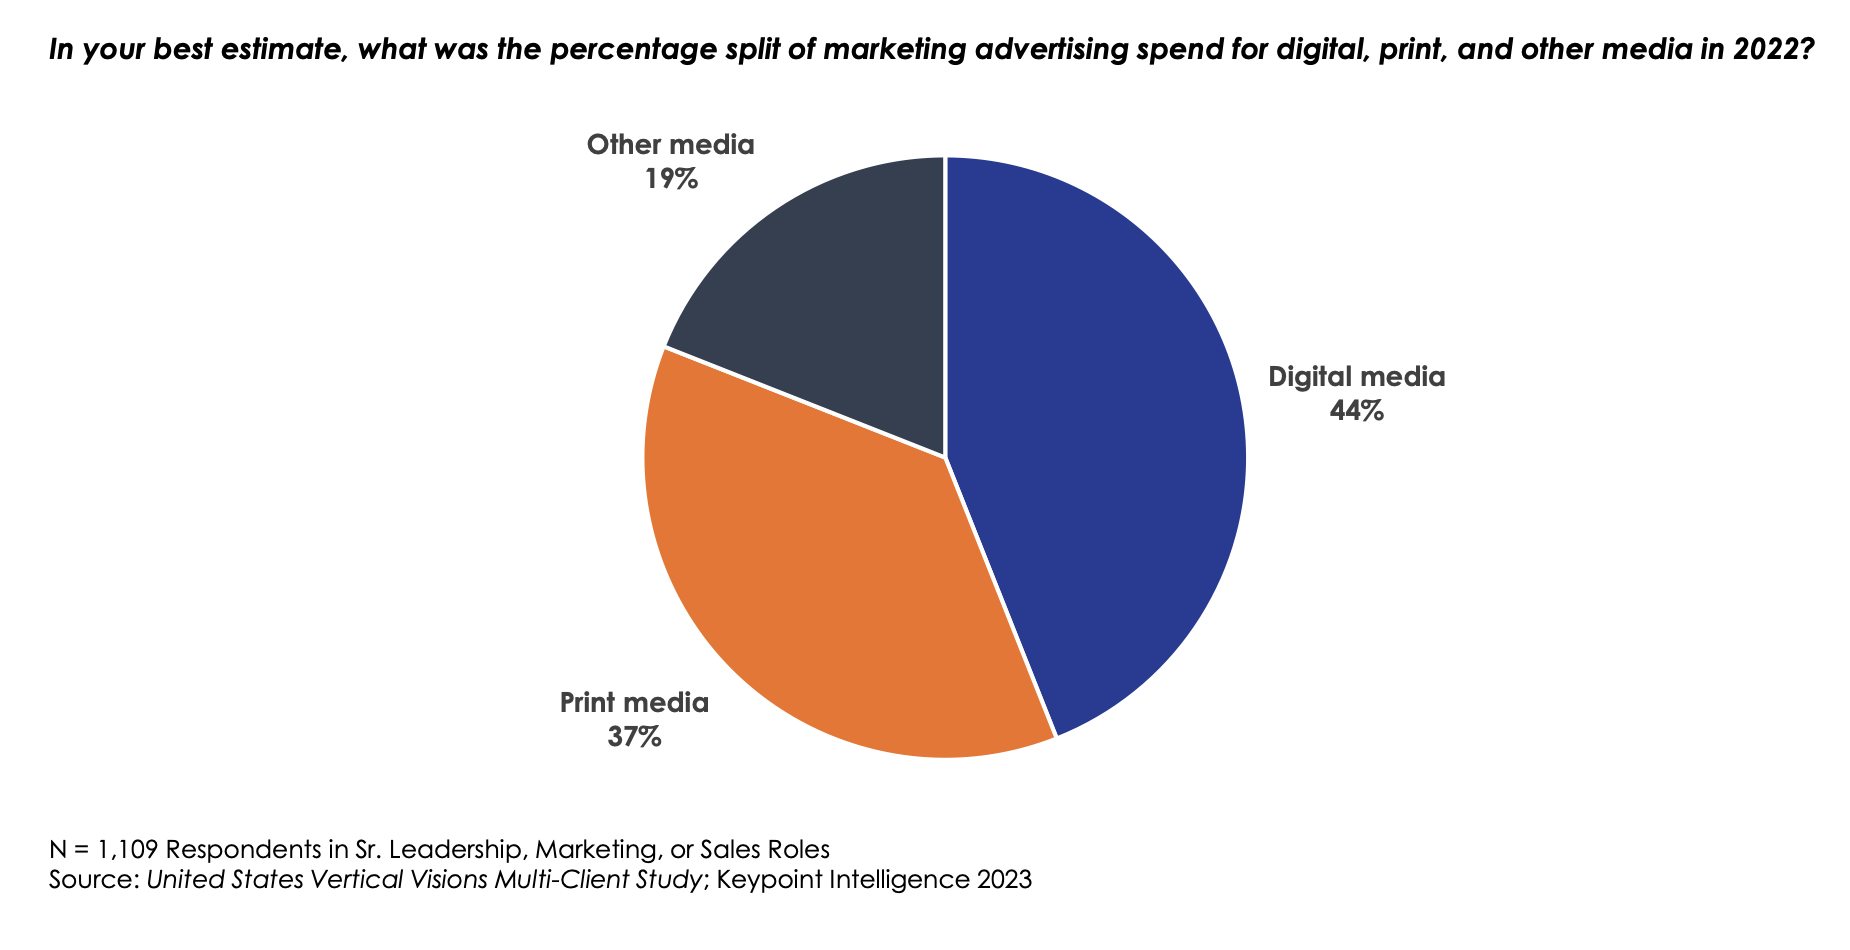
Vertical Market Research from Keypoint Intelligence Uncovers Key Industry Trends
Published: June 10, 2024
In late 2023, Keypoint Intelligence completed a comprehensive multi-client study to gain a better understanding of how print demand is changing in key vertical industries. The vertical industries that were covered in depth include education, finance/banking, healthcare, hospitality, insurance, manufacturing, retail, and publishing. Full Analysis
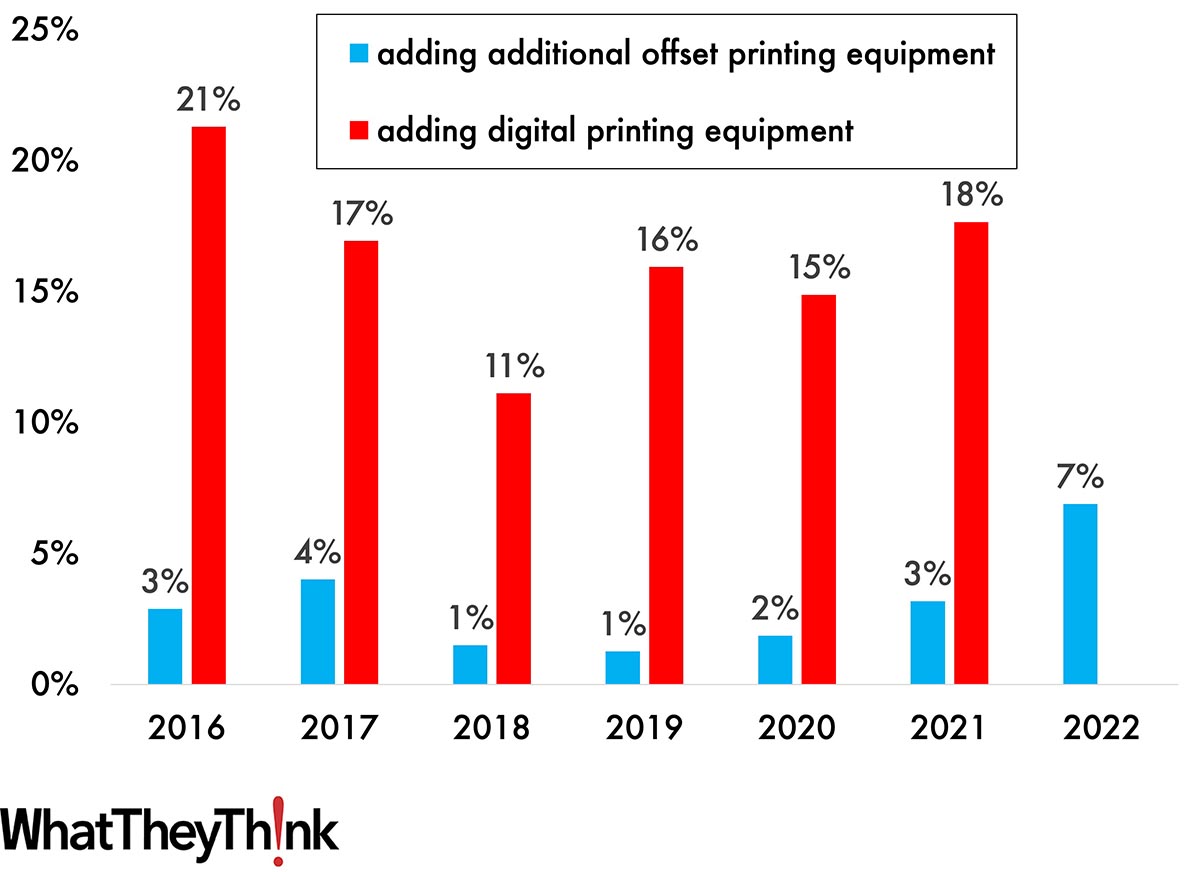
Tales from the Database: Finishing Up
Published: June 7, 2024
Drawing on six years’ worth of Print Business Outlook surveys, our “Tales from the Database” series looks at historical data to see if we can spot any particular hardware, software or business trends. This issue, we turn our attention to various aspects of finishing, including mailing and embellishments. Full Analysis
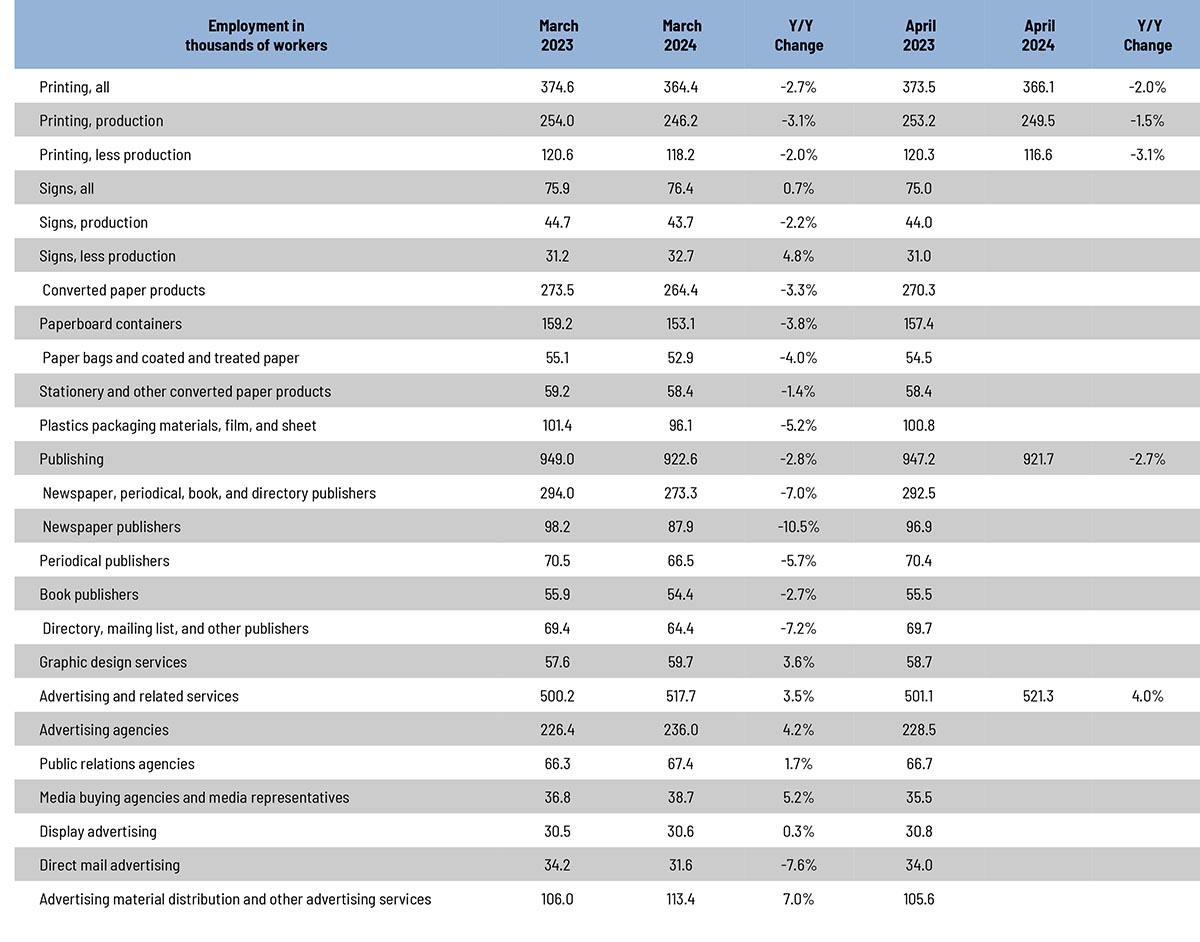
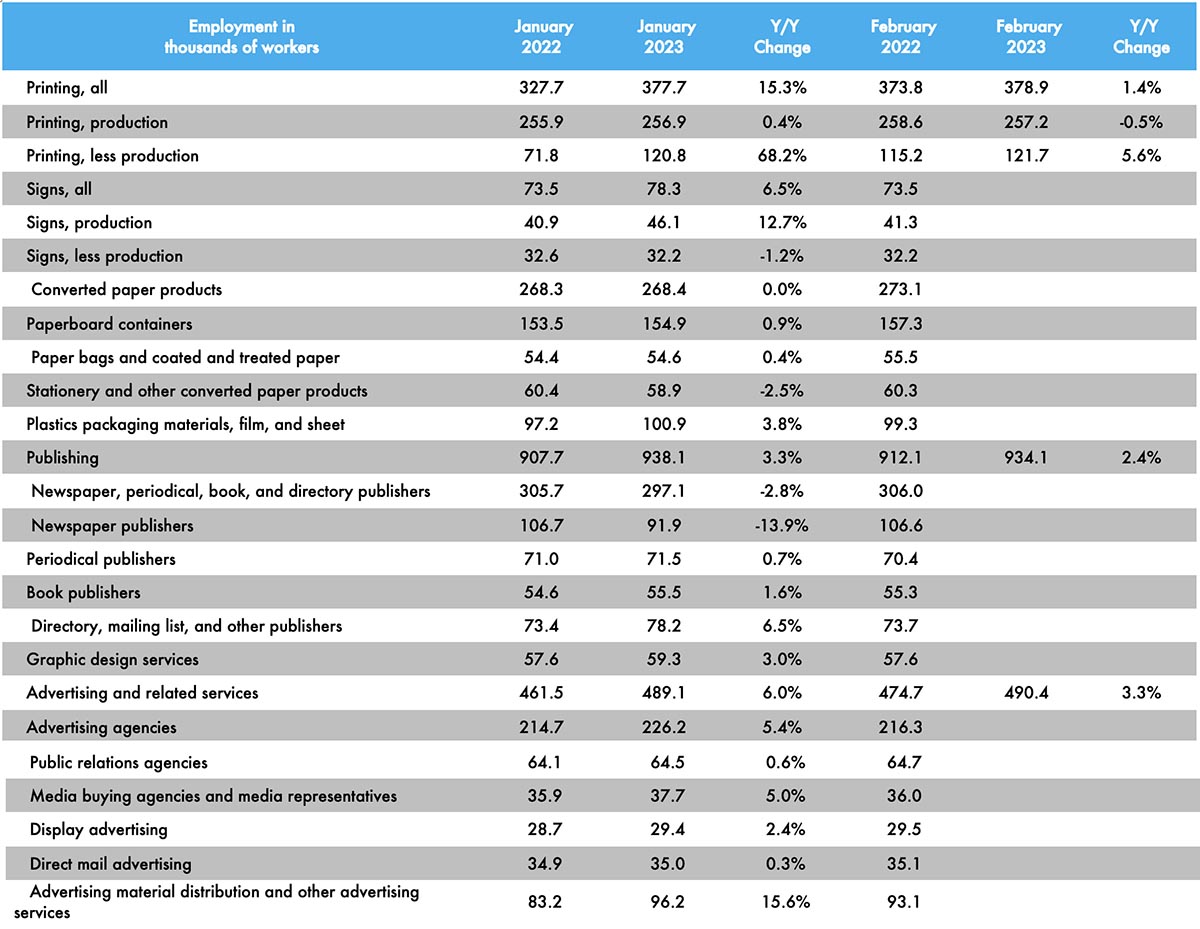
April Graphic Arts Employment A Mixed Bag
Published: May 31, 2024
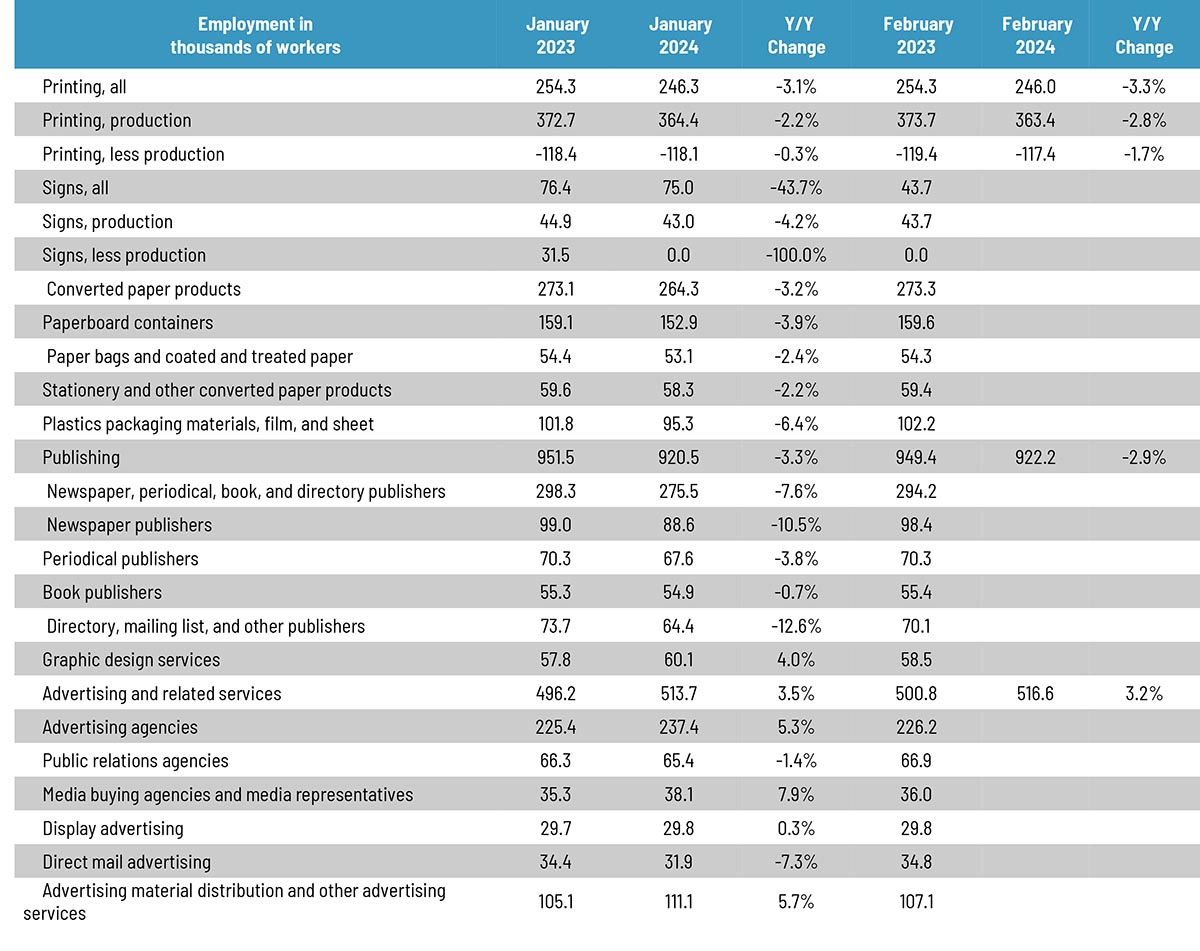
Overall printing employment in April 2024 was generally up—+0.5% from March—with production employment up +1.3% and non-production employment down +1.4%. Full Analysis
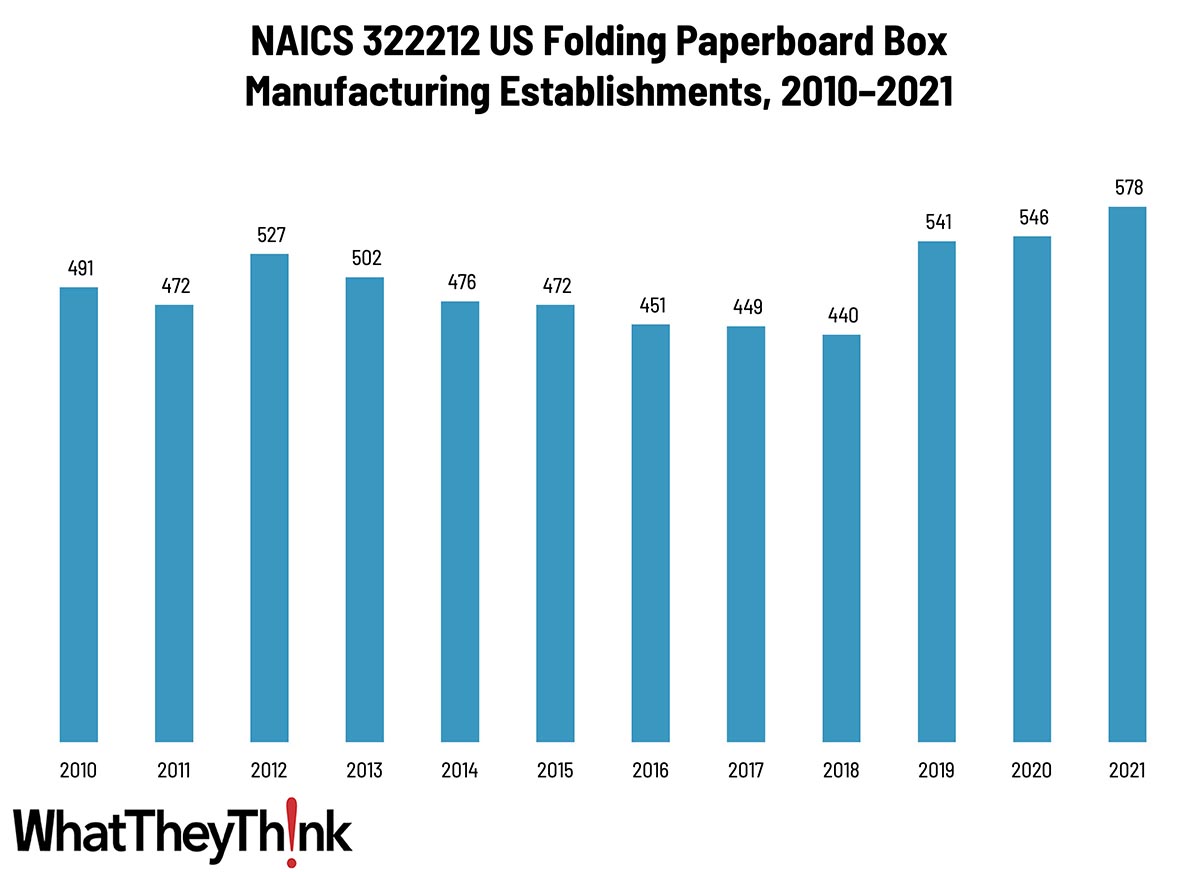
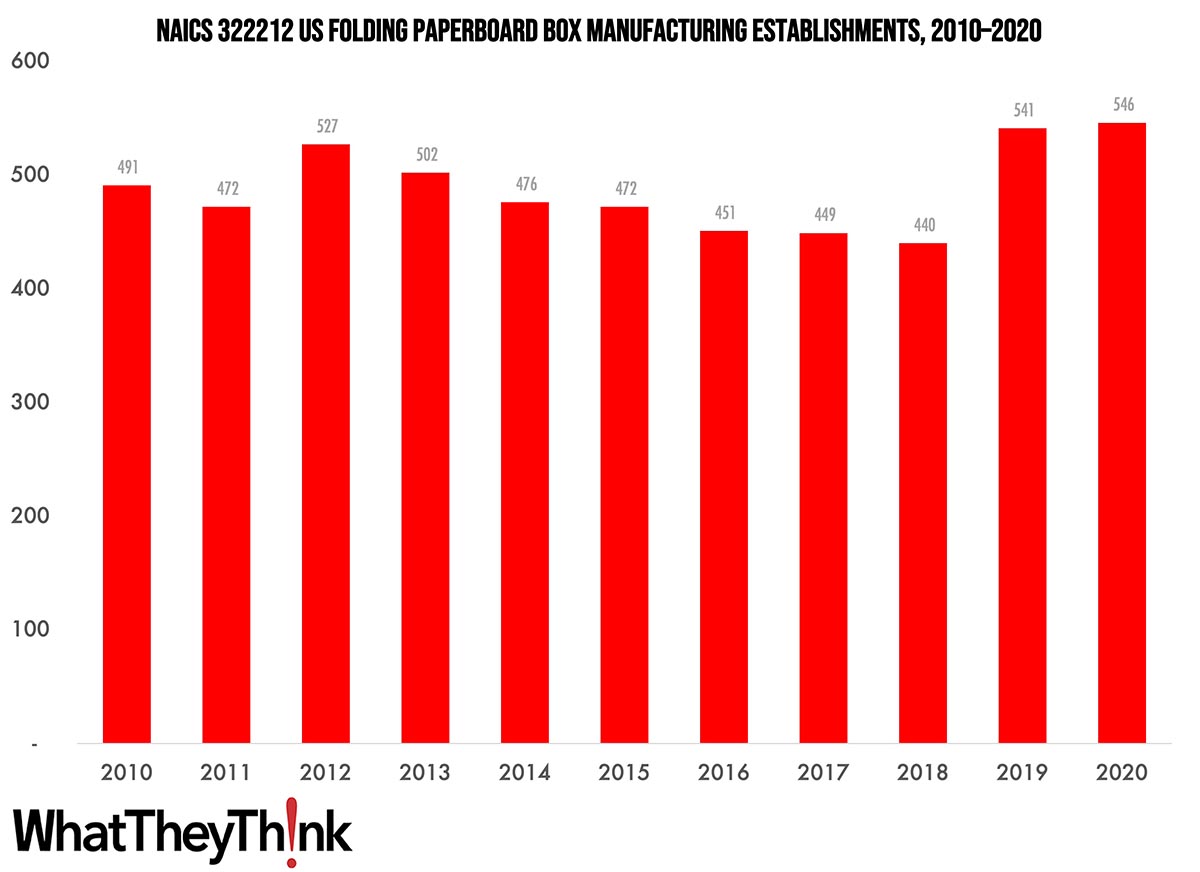
Folding Paperboard Box Manufacturing—2010–2021
Published: May 24, 2024
According to County Business Patterns, in 2021 there were 578 establishments in NAICS 322212 (Folding Paperboard Box Manufacturing). This category saw a net decrease of 18% since 2010. In macro news,inflation in April eased a bit. Full Analysis
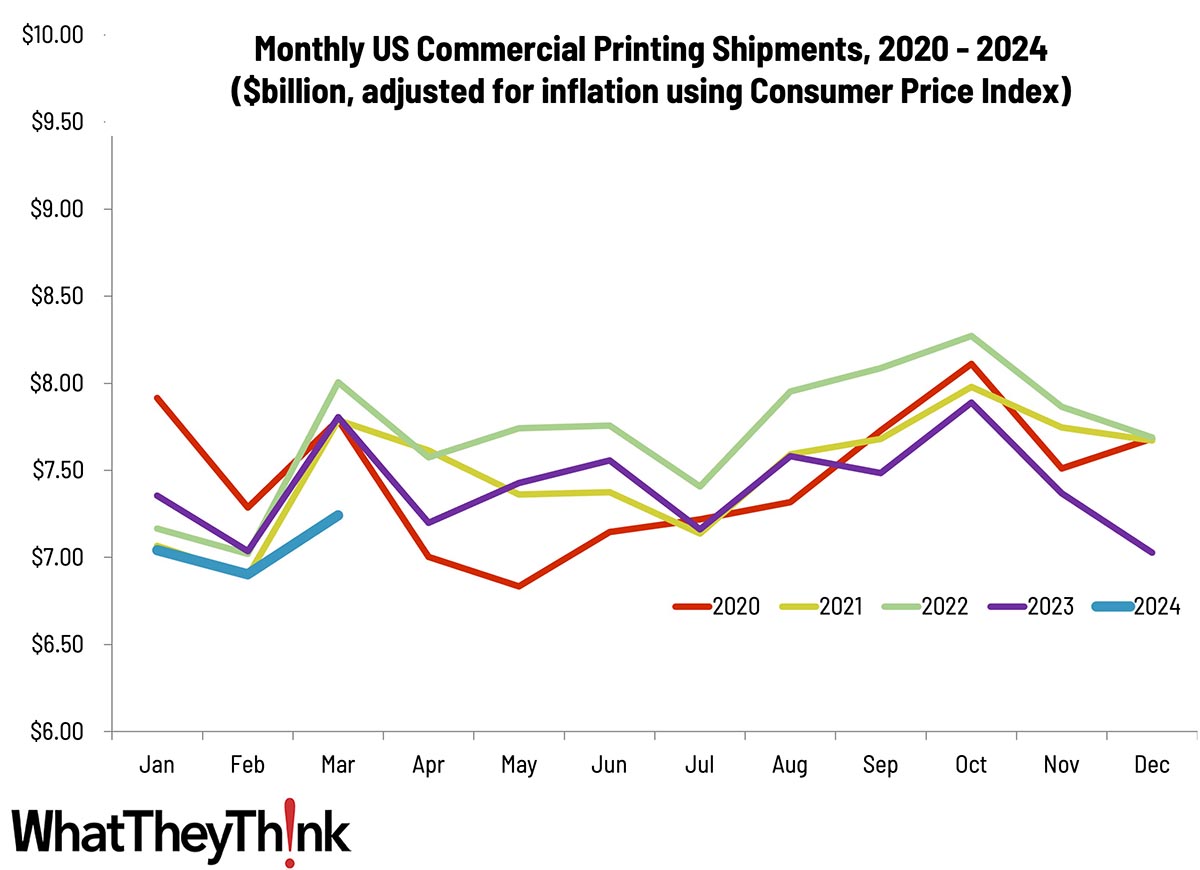
March Shipments: We Got Good News and Bad News
Published: May 17, 2024
March 2024 shipments came in at $7.24 billion, up from February’s $7.04 billion—and yet the worst March the industry has had. Full Analysis
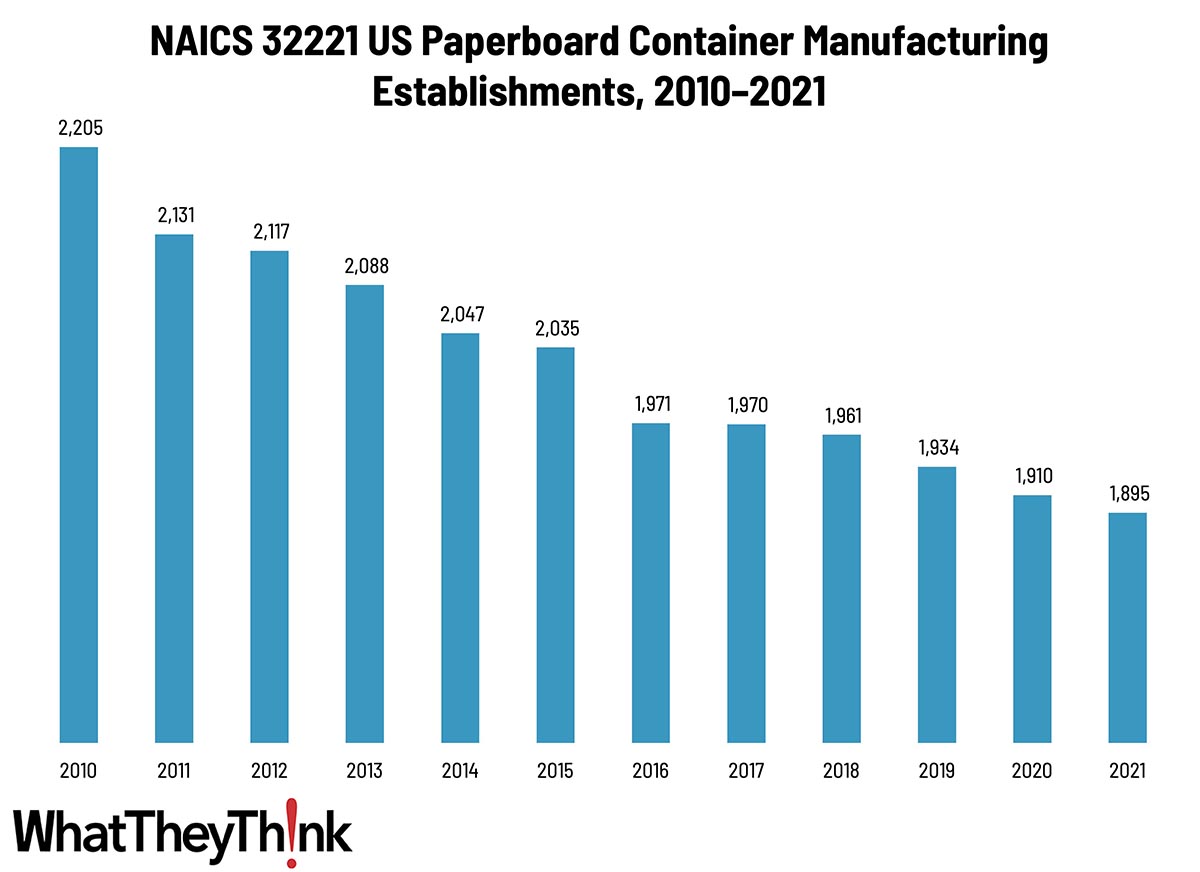
Paperboard Container Manufacturing Establishments—2010–2021
Published: May 10, 2024
According to County Business Patterns, in 2021 there were 1,895 establishments in NAICS 32221 (Paperboard Container Manufacturing). This category saw a net decrease of 15% since 2010. In macro news, early Q2 GDP predictions are bullish. Full Analysis
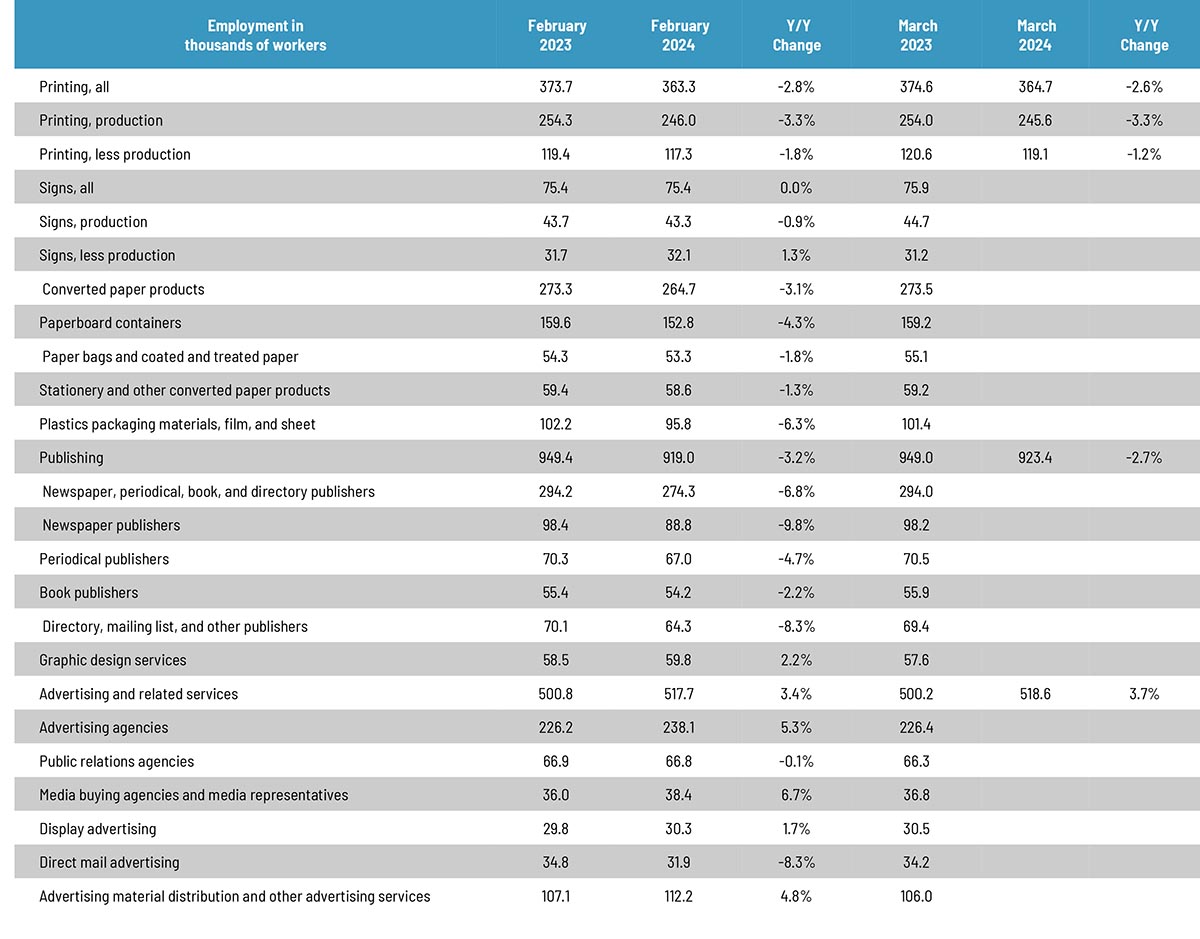
March Graphic Arts Employment A Mixed Bag
Published: May 3, 2024
Overall printing employment in March 2024 was generally up—+0.4% from February—with production employment down -0.2% and non-production employment up +1.5%. Full Analysis
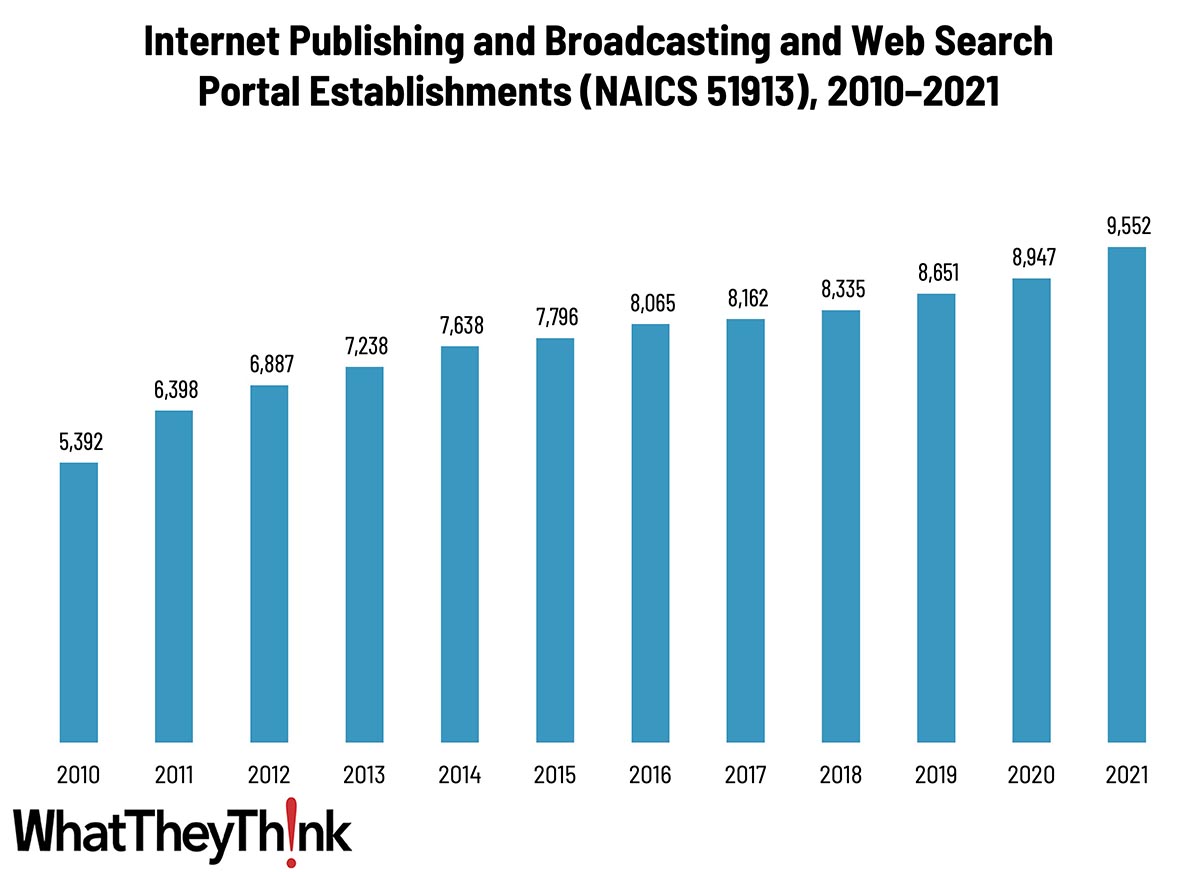
Internet Publishing and Broadcasting and Web Search Portal Establishments—2010–2021
Published: April 26, 2024
According to County Business Patterns, in 2020 there were 8,947 establishments in NAICS 51913 (Internet Publishing and Broadcasting and Web Search Portals). This category saw a net increase of 66% since 2010. In macro news, Q1 GDP is much lower than expected. Full Analysis
February Shipments: Well, At Least It’s Seasonal
Published: April 19, 2024
February 2024 shipments came in at $6.01 billion, down from January’s $7.04 billion—and right between February 2021 and 2022. Full Analysis
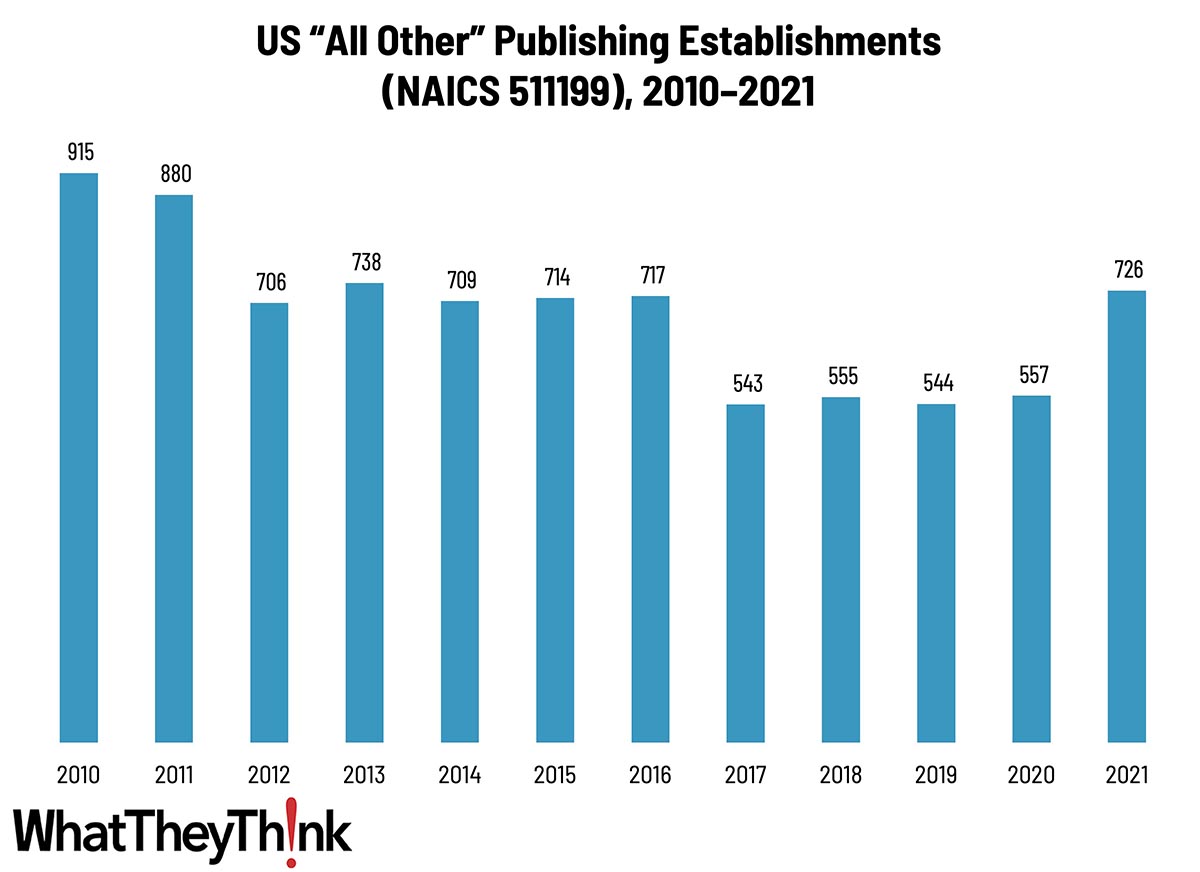
Assorted Publishing Establishments—2010–2021
Published: April 12, 2024
According to County Business Patterns, in 2021 there were 726 establishments in NAICS 511199 (All Other Publishing). This category saw a net decrease of 39% since 2010, although establishments spiked from 2020 to 2021. In macro news, estimates of Q1 GDP are running around +2%. Full Analysis
Tales from the Database: These Are Not the Applications You’re Looking For
Published: April 5, 2024
Drawing on six years’ worth of Print Business Outlook surveys, our “Tales from the Database” series looks at historical data to see if we can spot any particular hardware, software, or business trends. This issue, we turn our attention to specialty printing—or any printing beyond traditional offset or digital commercial work. Full Analysis
February Graphic Arts Employment Remains Generally Flat
Published: March 29, 2024
Overall printing employment in February 2024 was little changed from January, with production employment down -1.0%, while non-production employment was down -0.6%, with net employment down -0.1%. Full Analysis
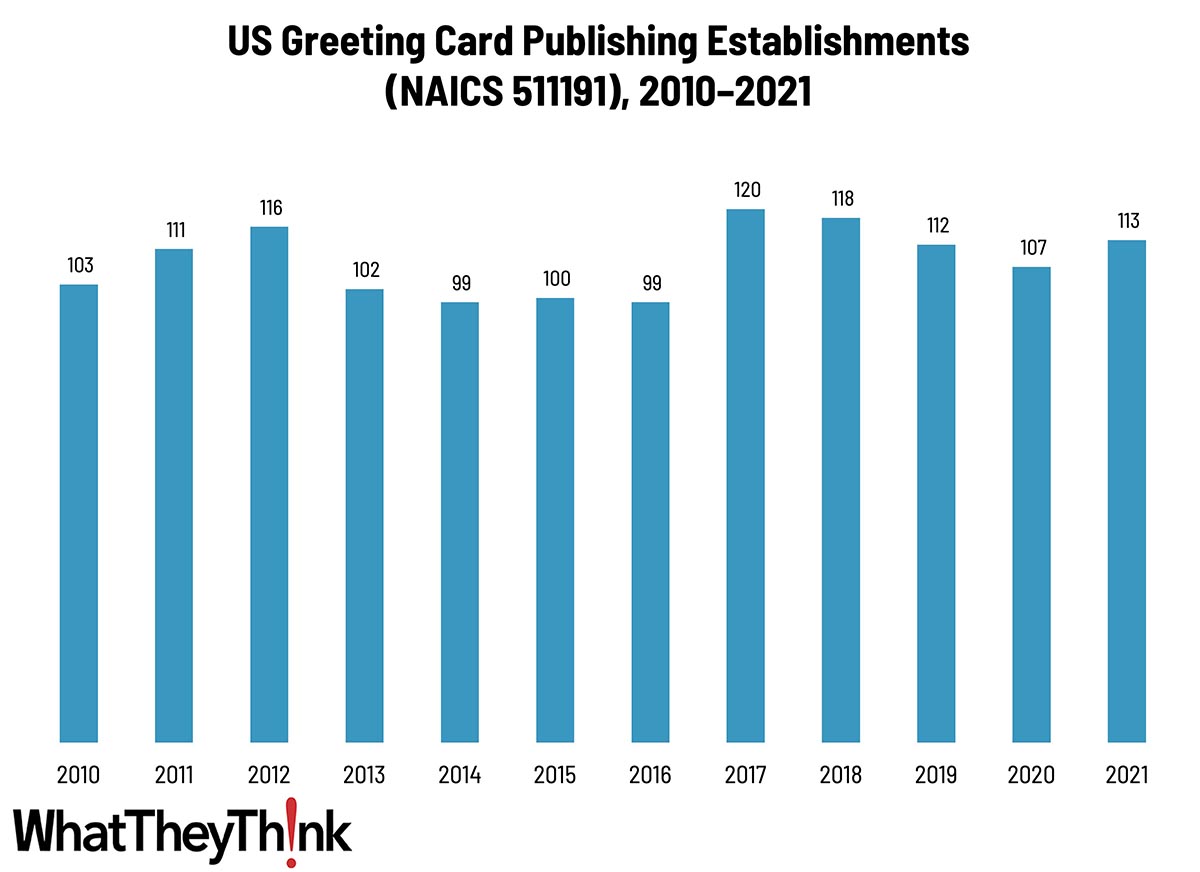
Greeting Card Publishing Establishments—2010–2021
Published: March 22, 2024
According to the latest edition of County Business Patterns, in 2021 there were 113 establishments in NAICS 511191 (Greeting Card Publishers). Although this represents a net increase of 10% since 2010, it has been a category that has ebbed and flowed over the course of the decade, although we’re not talking about a tremendous number of establishments. In macro news, inflation increased in February. Full Analysis
January Shipments: Back to Normal?
Published: March 15, 2024
January 2024 shipments came in at $7.04 billion, up from December’s $6.94 billion—and right between January 2021 and 2022. Full Analysis
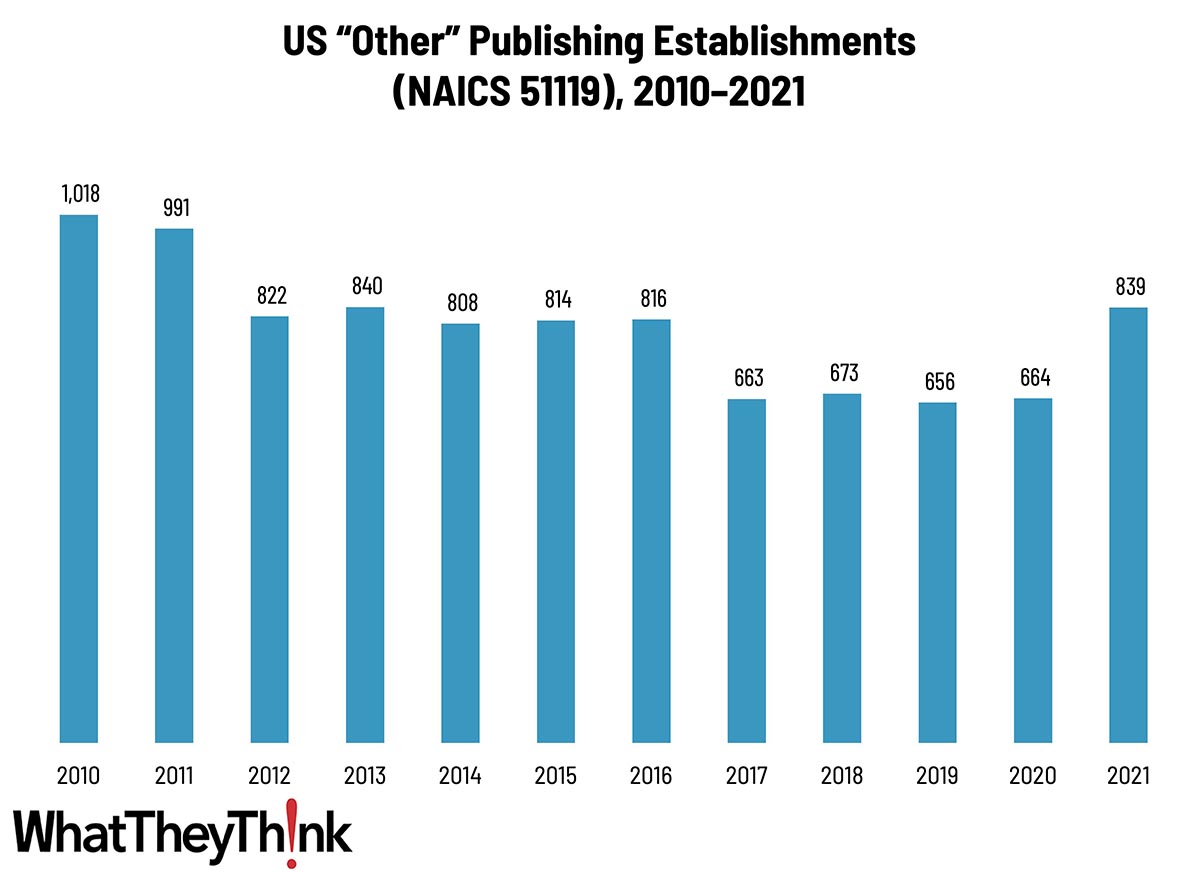
“Other” Publishing Establishments—2010–2021
Published: March 8, 2024
According to the latest edition of County Business Patterns, in 2021 there were 839 establishments in NAICS 51119 (Other Publishers). This represents a net decrease of 18% since 2010, but a 26% increase in the past year. In macro news, Q4 GDP was revised down slightly. Full Analysis
December Shipments: Ending the Year on a Low Note
Published: March 1, 2024
December 2023 shipments came in at $6.98 billion, down from November’s $7.24 billion—and, alas, the lowest of the year. Full Analysis
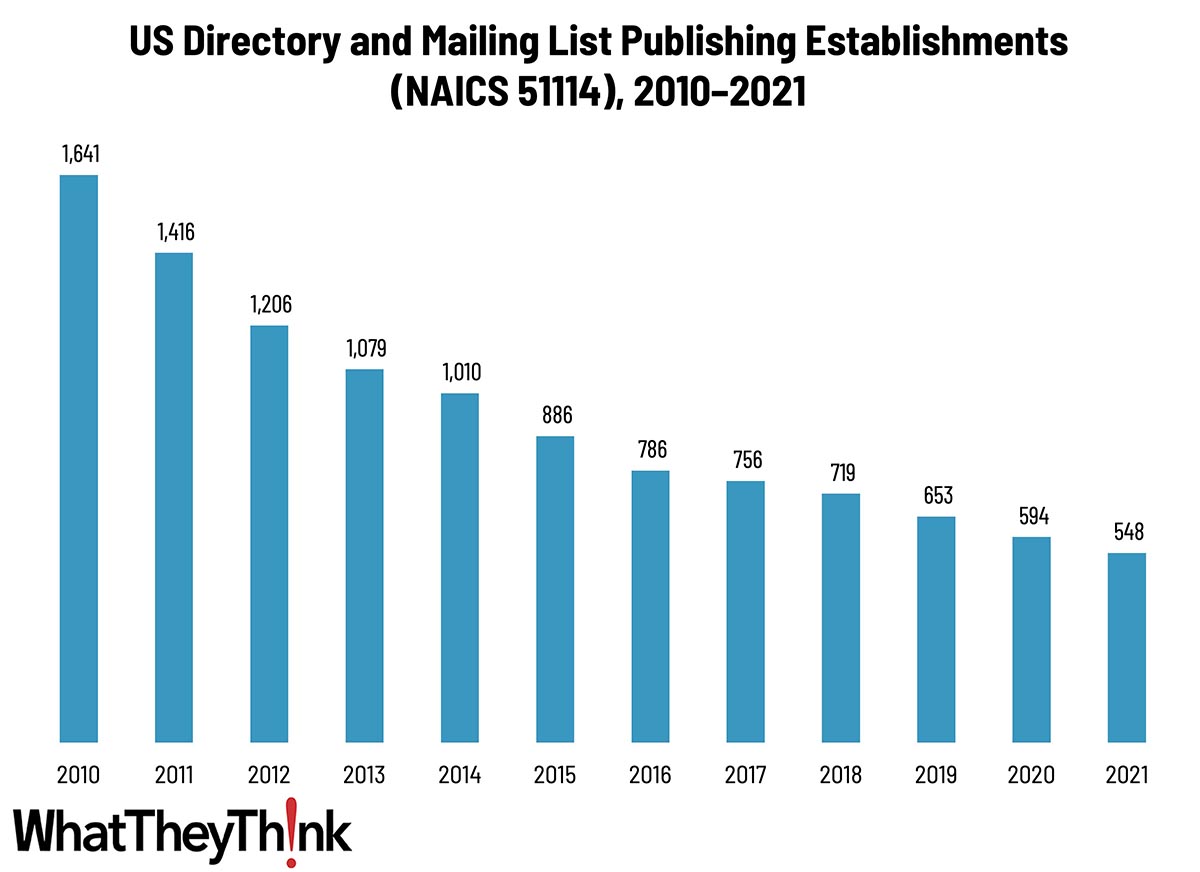
Directory and Mailing List Publishing Establishments—2010–2021
Published: February 23, 2024
According to the latest edition of County Business Patterns, in 2021 there were 548 establishments in NAICS 51114 (Directory and Mailing List Publishers). This represents a decrease of 67% since 2010. In macro news, retail sales dipped slightly in January. Full Analysis
January Graphic Arts Employment Generally Flat
Published: February 16, 2024
Overall printing employment in January 2024 was unchanged from December, with production employment up 0.7%, while non-production employment was down -1.3%. Full Analysis
Tales from the Database: Looking at the Cloud from Both Sides
Published: February 9, 2024
Drawing on eight years’ worth of Print Business Outlook surveys, our “Tales from the Database” series looks at historical data to see if we can glean any particular hardware, software, or business trends. This issue, we turn our attention to software—specifically, migration to the cloud. Full Analysis
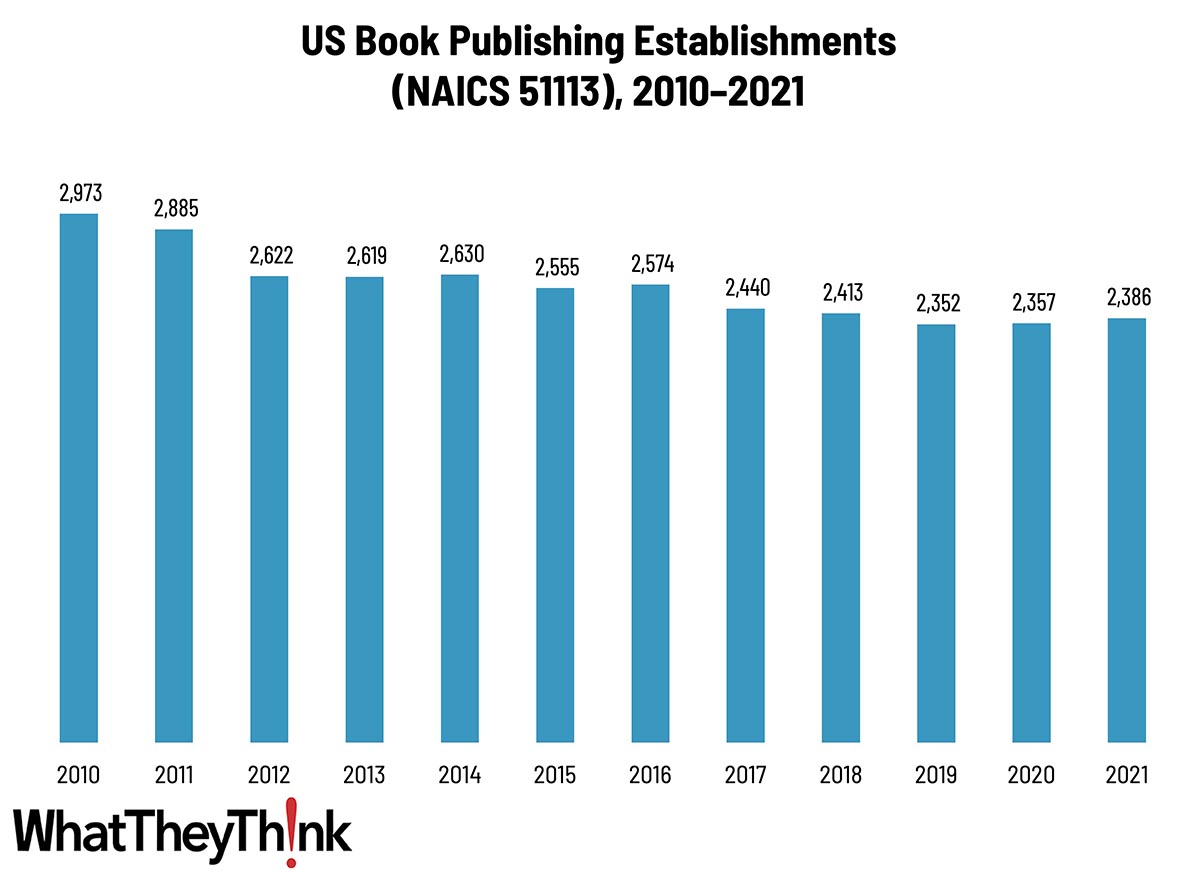
Book Publishing Establishments—2010–2021
Published: February 2, 2024
According to the latest edition of County Business Patterns, in 2021 there were 2,386 establishments in NAICS 51113 (Book Publishing). Although this represents a decrease of 20% since 2010, establishments ticked up by 29 establishments in 2021. In macro news, Q4 GDP grew 3.3%. Full Analysis
November Shipments: Tis the Season…
Published: January 26, 2024
November 2023 shipments came in at $7.24 billion, down from the year’s high of $7.76 billion a month earlier. Full Analysis
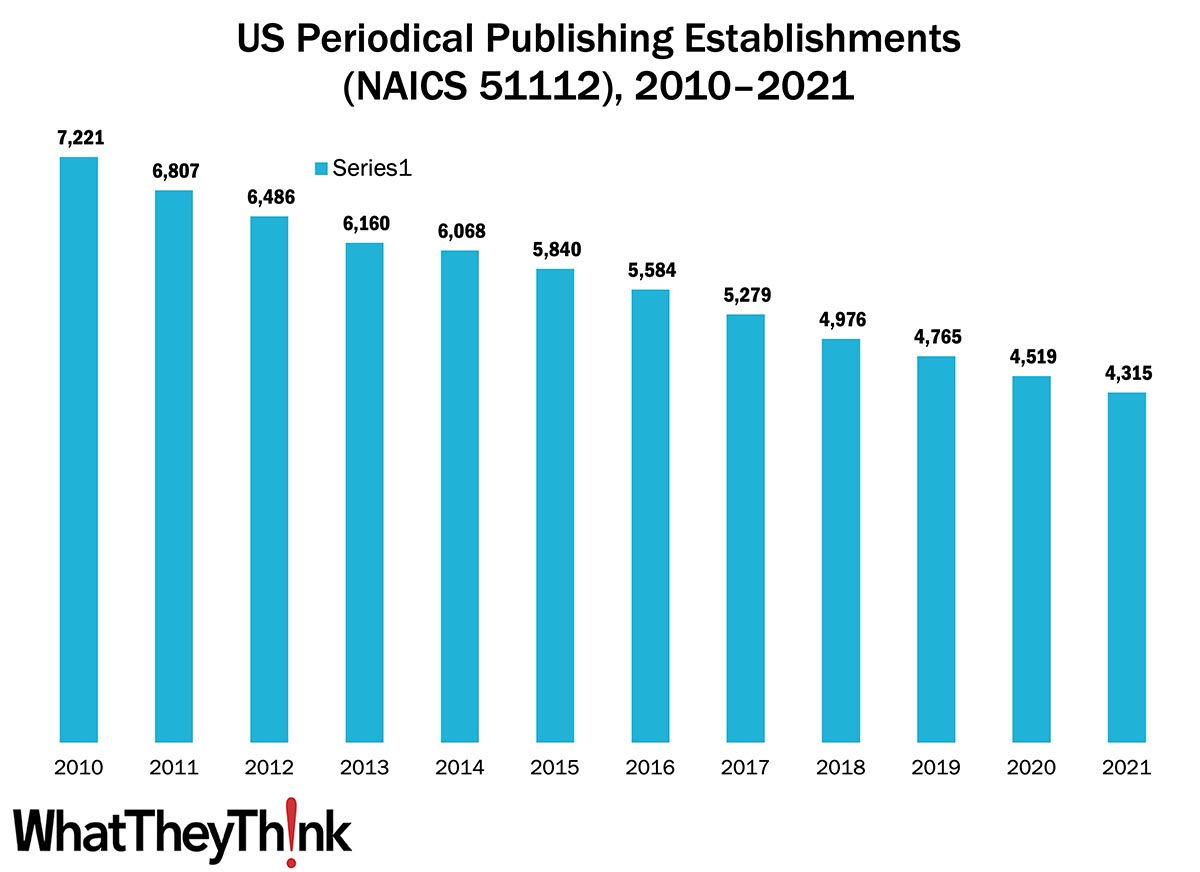
Periodical Publishing Establishments—2010–2021
Published: January 19, 2024
According to the latest edition of County Business Patterns, in 2021 there were 4,315 establishments in NAICS 51112 (Periodical Publishing). This represents a decrease of 40% since 2010. In macro news, December retail sales were up from November. Full Analysis
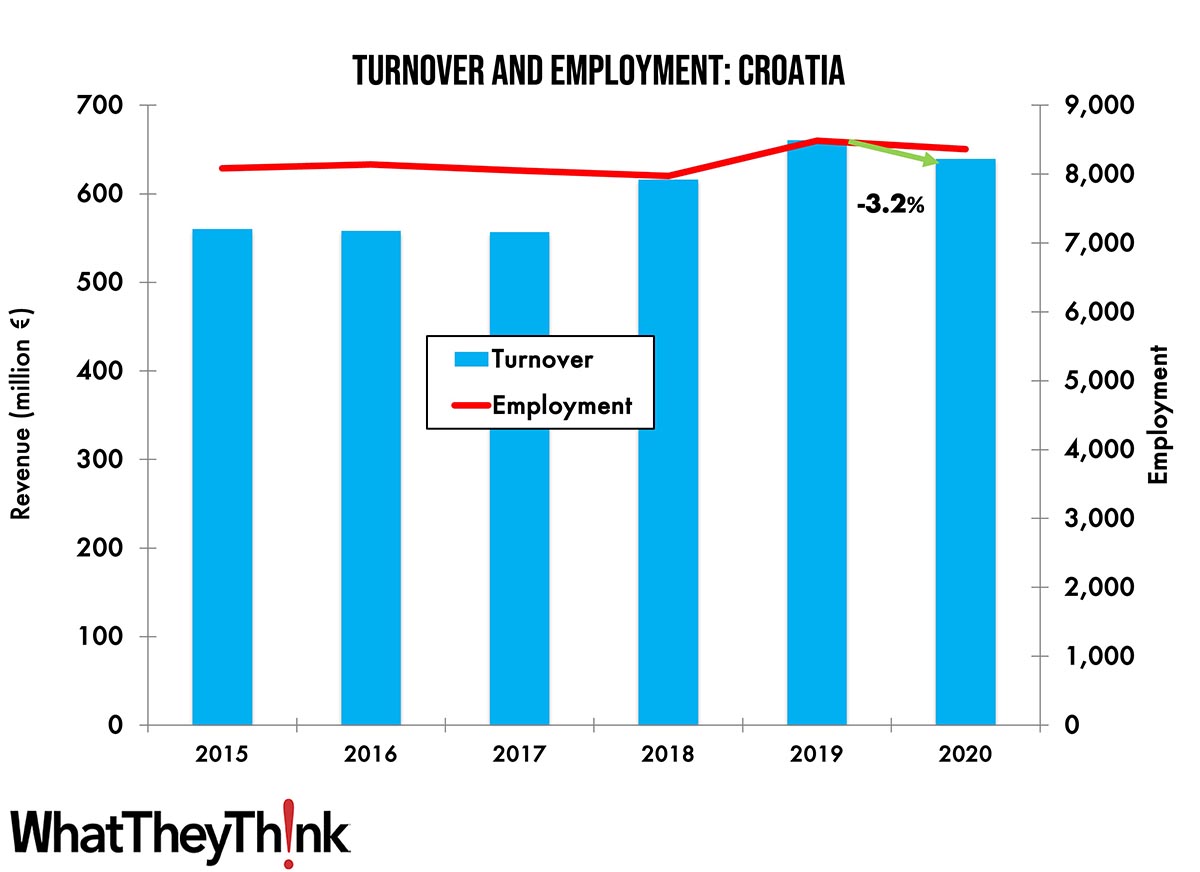
Turnover and Employment in Print in Europe—Croatia
Published: January 16, 2024
This bi-weekly series of short articles aims to shed a spotlight on the size of the printing industry in Europe per country and how revenues and employment developed in 2020, when the pandemic impacted businesses. In this final installment, we look at Croatia, which ranks at number 19 among the printing industries by turnover in Europe. Full Analysis
October Shipments: Peak Performance
Published: January 12, 2024
October 2023 printing shipments came in at $7.84 billion, up from September’s $7.37 billion. Full Analysis
Tales from the Database: Prints Charming
Published: December 15, 2023
Drawing on six years’ worth of Print Business Outlook surveys, our “Tales from the Database” series looks at historical data to see if we can spot any particular hardware, software or business trends. In this installment, we turn our attention to printing technologies. Full Analysis
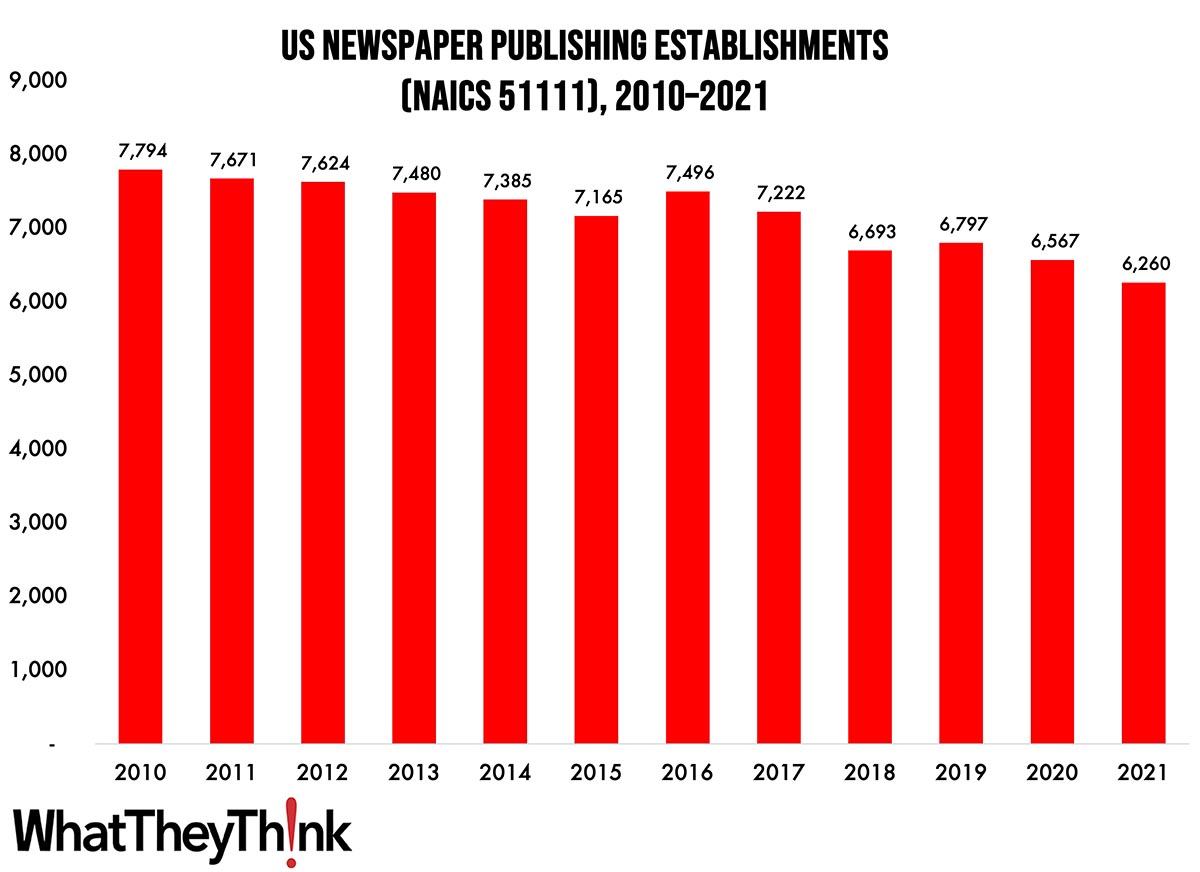
Newspaper Publishing Establishments—2010–2021
Published: December 8, 2023
According to the latest, recently released edition of County Business Patterns, in 2021 there were 6,260 establishments in NAICS 51111 (Newspaper Publishing). This represents a decrease of 20% since 2010. In macro news, what is going on with GDP? Full Analysis
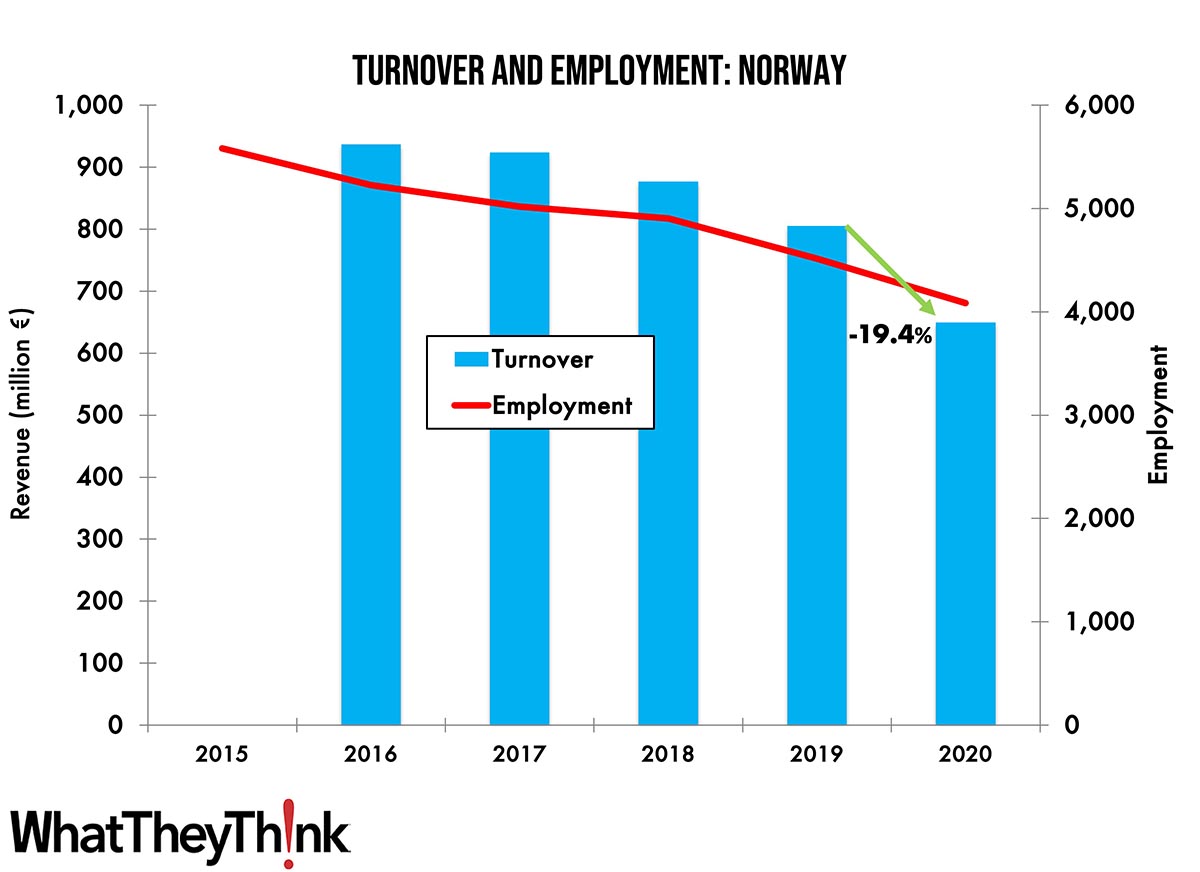
Turnover and Employment in Print in Europe—Norway
Published: December 5, 2023
This bi-weekly series of short articles aims to shed a spotlight on the size of the printing industry in Europe per country and how revenues and employment developed in 2020, when the pandemic impacted businesses. This time we look at Norway, which ranks at number 18 among the printing industries by turnover in Europe. Full Analysis
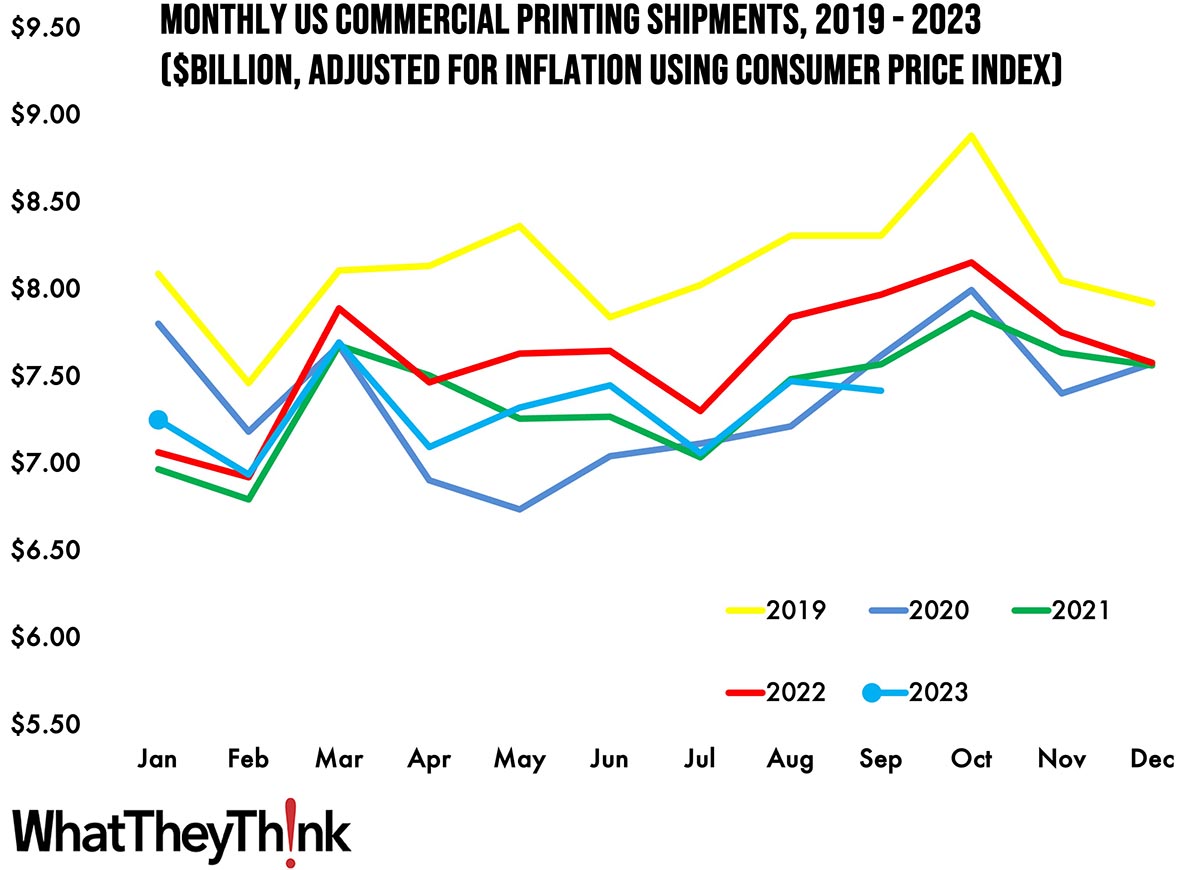
September Shipments: Heading into the Fall
Published: December 1, 2023
September 2023 printing shipments came in at $7.42 billion, down from August’s $7.47 billion. Full Analysis
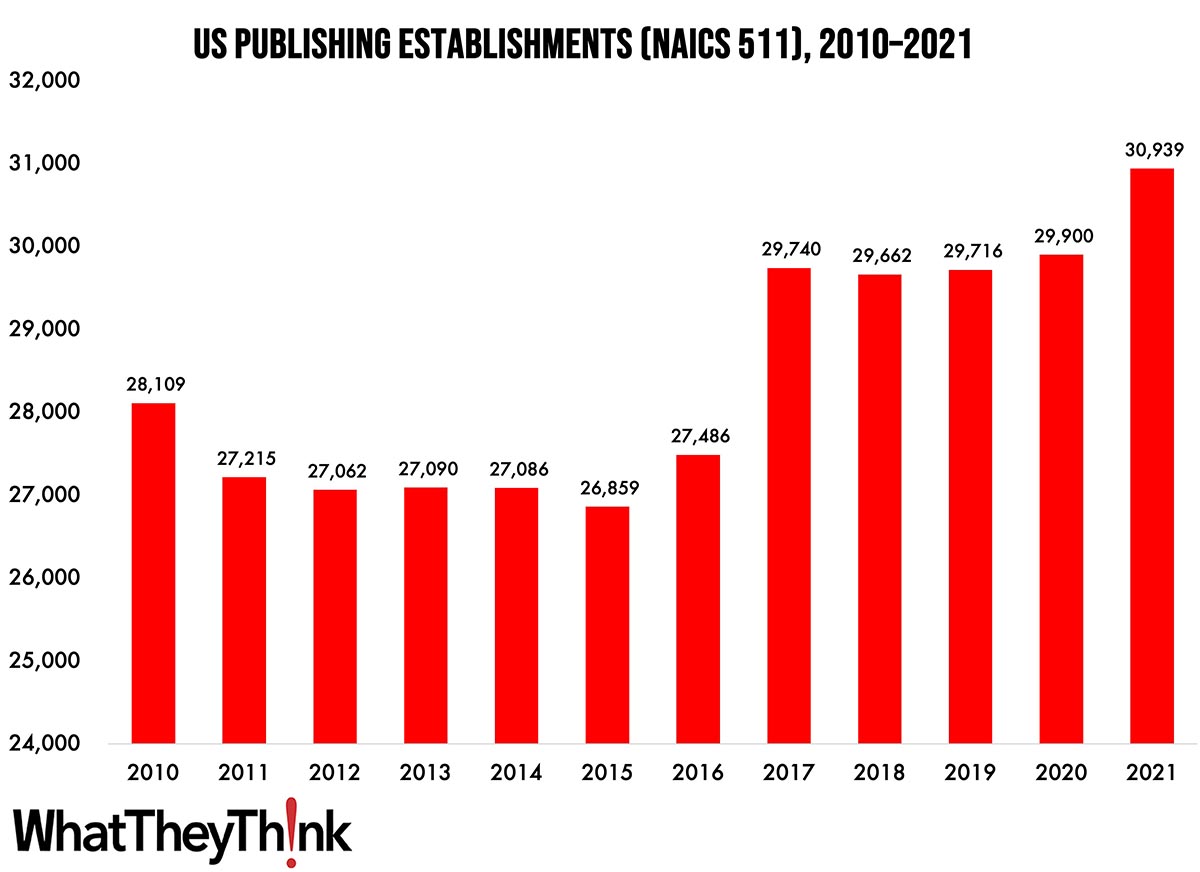
Publishing Establishments—2010–2021
Published: November 17, 2023
According to the latest, recently released edition of County Business Patterns, in 2020 there were 30,939 establishments in NAICS 511 (Publishing Industries [except Internet]). This represents an increase of 10% since 2010 and increase of 13% since 2016. In macro news, October inflation was unchanged from September. Full Analysis
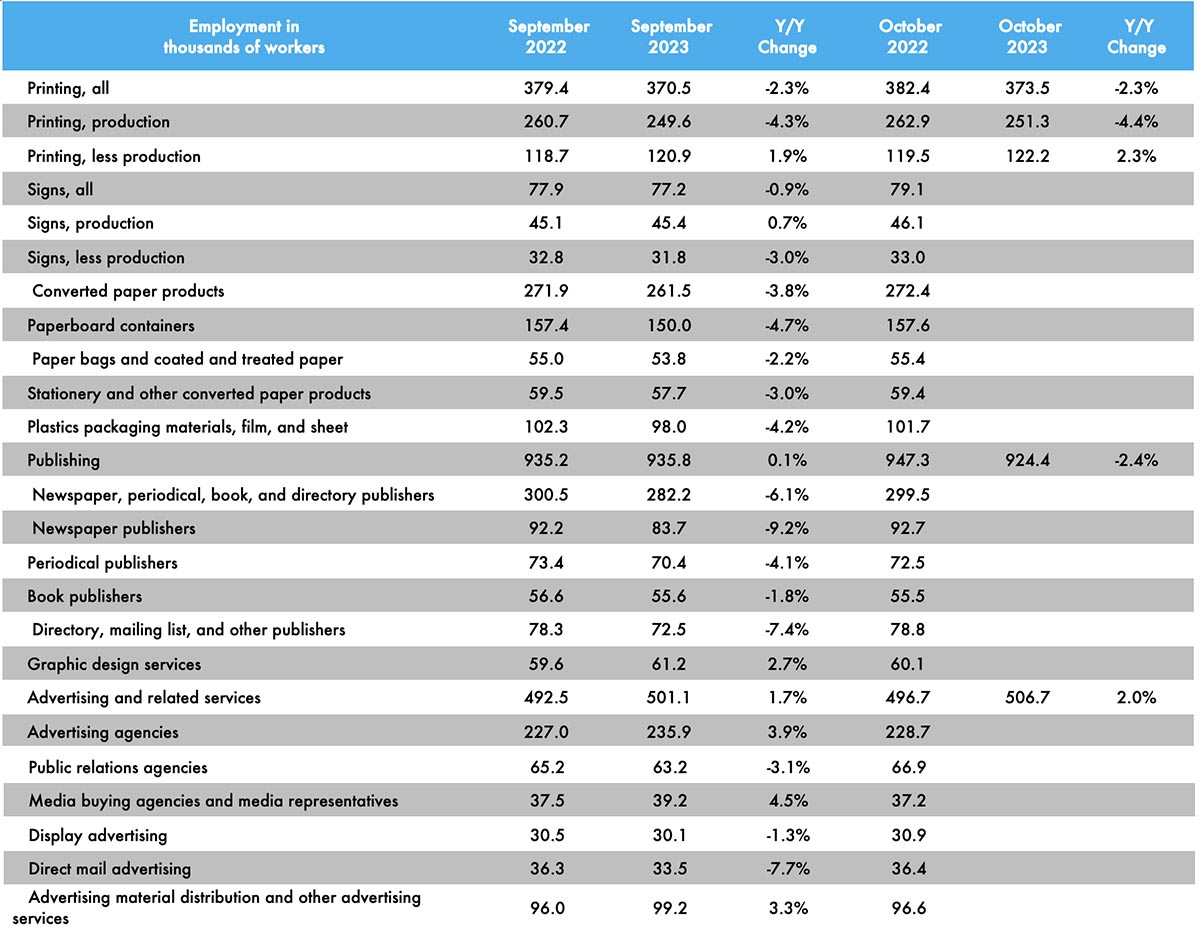
October Graphic Arts Employment Up Slightly
Published: November 10, 2023
Overall printing employment in October 2023 was up 0.8% from September. Production employment was up 0.7% while non-production employment was up 1.1%. Full Analysis
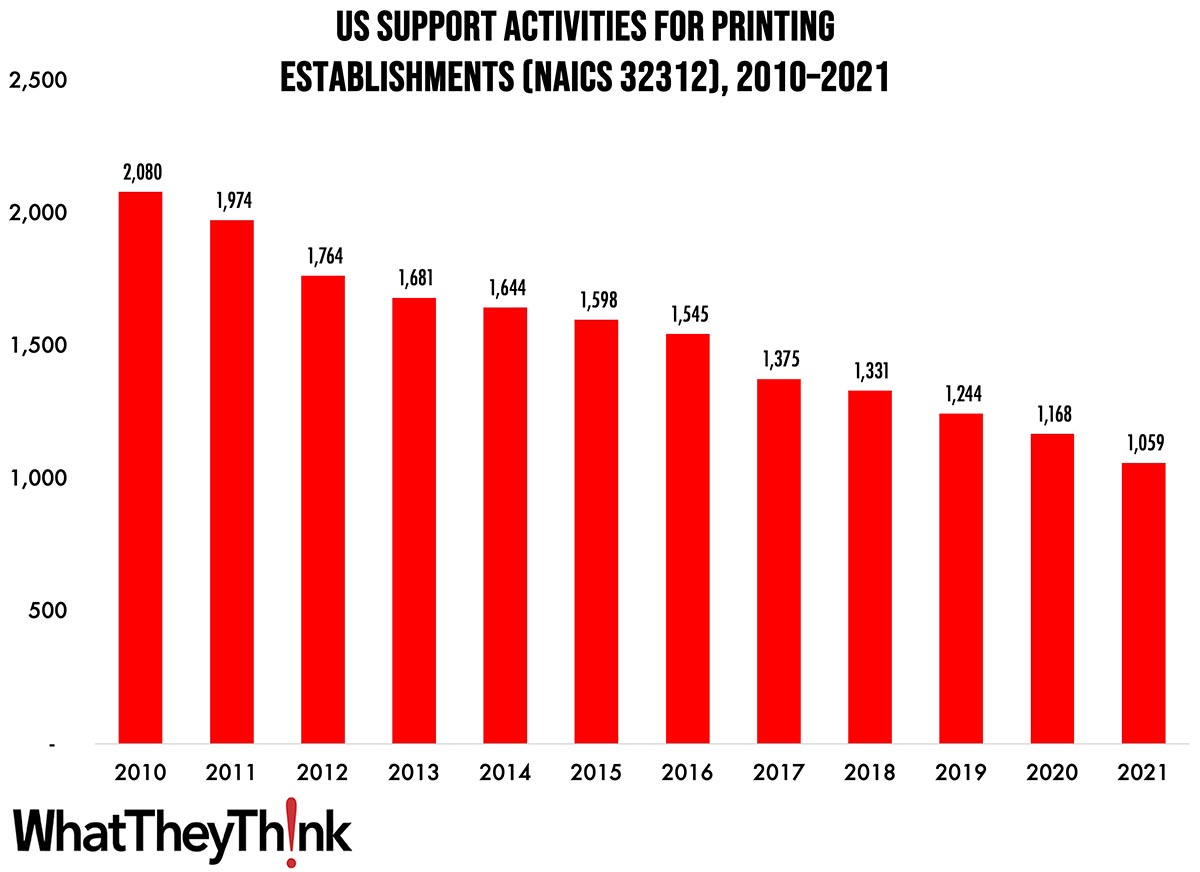
Pre- and Postpress Establishments—2010–2021
Published: November 3, 2023
According to the latest, recently released edition of County Business Patterns, in 2021 there were 1,059 establishments in NAICS 32312 (Support Activities for Printing). This represents a decrease of 49% since 2010. In macro news, Q3 GDP was up 4.9%. Full Analysis
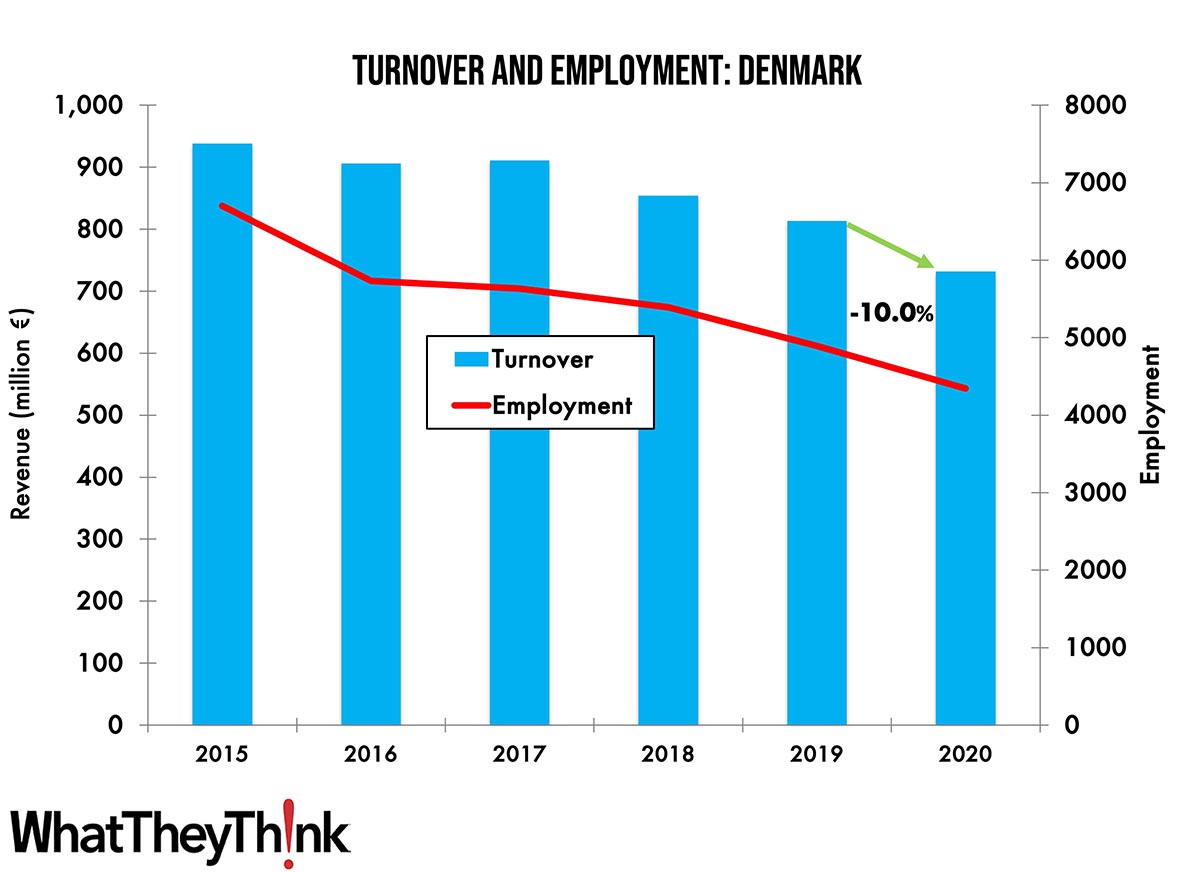
Turnover and Employment in Print in Europe—Denmark
Published: October 31, 2023
This bi-weekly series of short articles aims to shed a spotlight on the size of the printing industry in Europe per country and how revenues and employment developed in 2020, when the pandemic impacted businesses. This time we look at Denmark, the 17th largest printing industry by turnover in Europe and the third largest in the Nordic region. Full Analysis
August Shipments: …And We’re Up Again
Published: October 27, 2023
August 2023 printing shipments came in at $7.44 billion, up from July’s $7.04 billion. Full Analysis
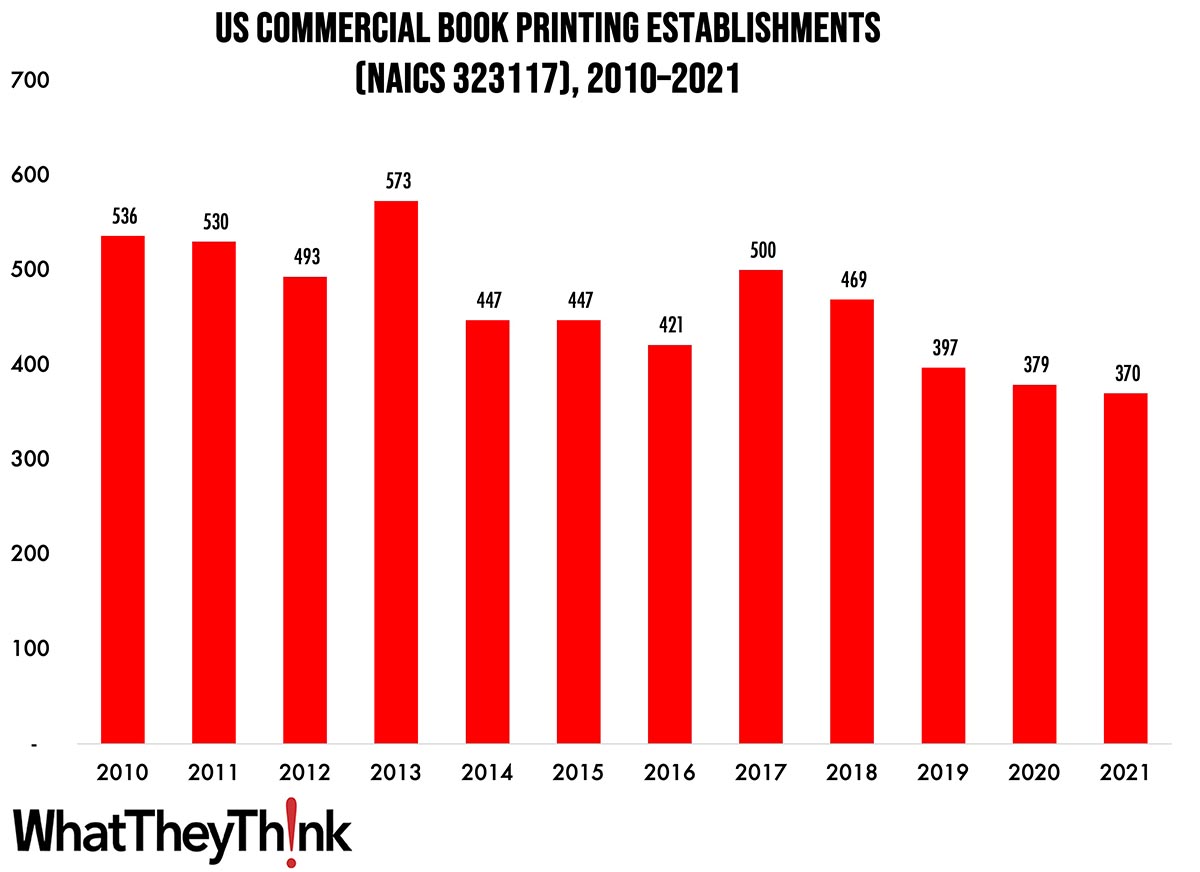
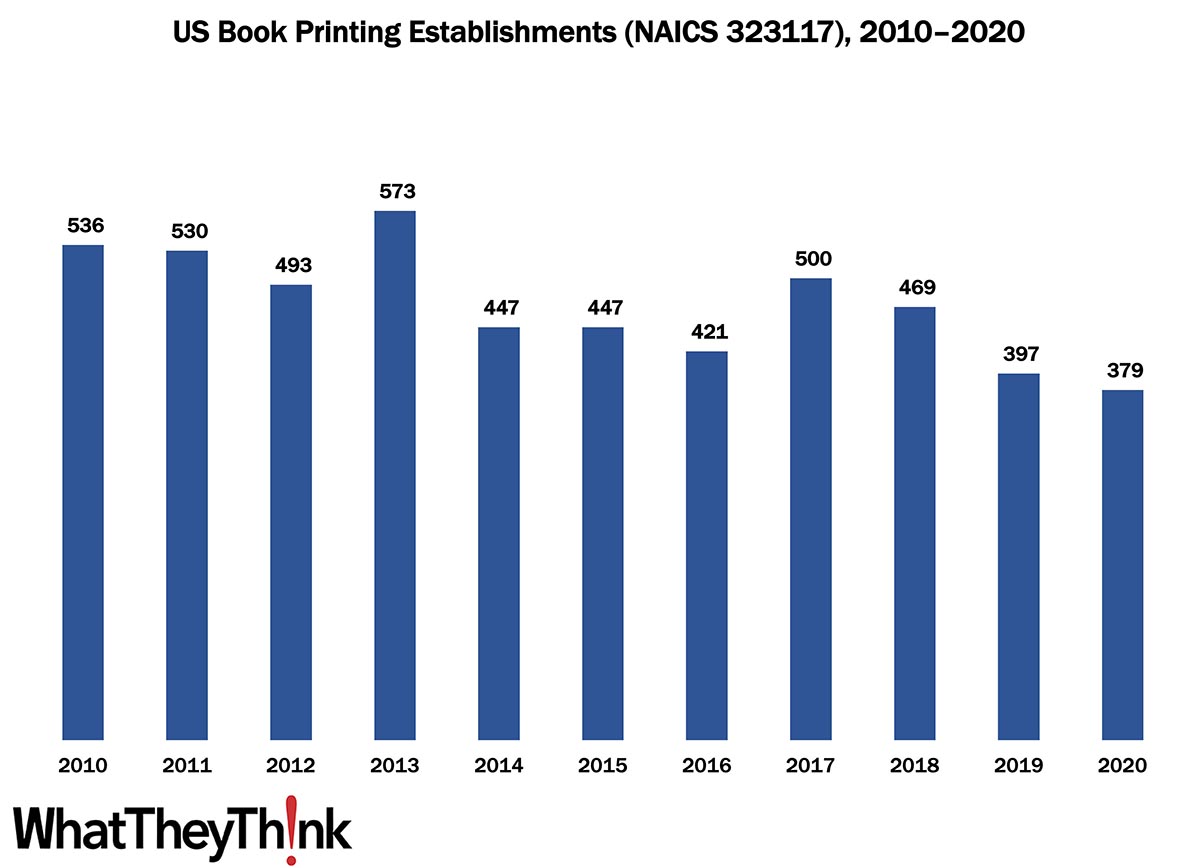
Book Printing Establishments—2010–2021
Published: October 20, 2023
According to the latest, recently released edition of County Business Patterns, in 2021 there were 370 establishments in NAICS 323117 (Commercial Book Printing). This represents a decrease of 31% since 2010—but a decrease of -2.4% from 2020. In macro news, AIA’s Architecture Billings Index (ABI) indicates that demand for design services decelerated in September, boding ill for commercial real estate construction and thus signage projects. Full Analysis
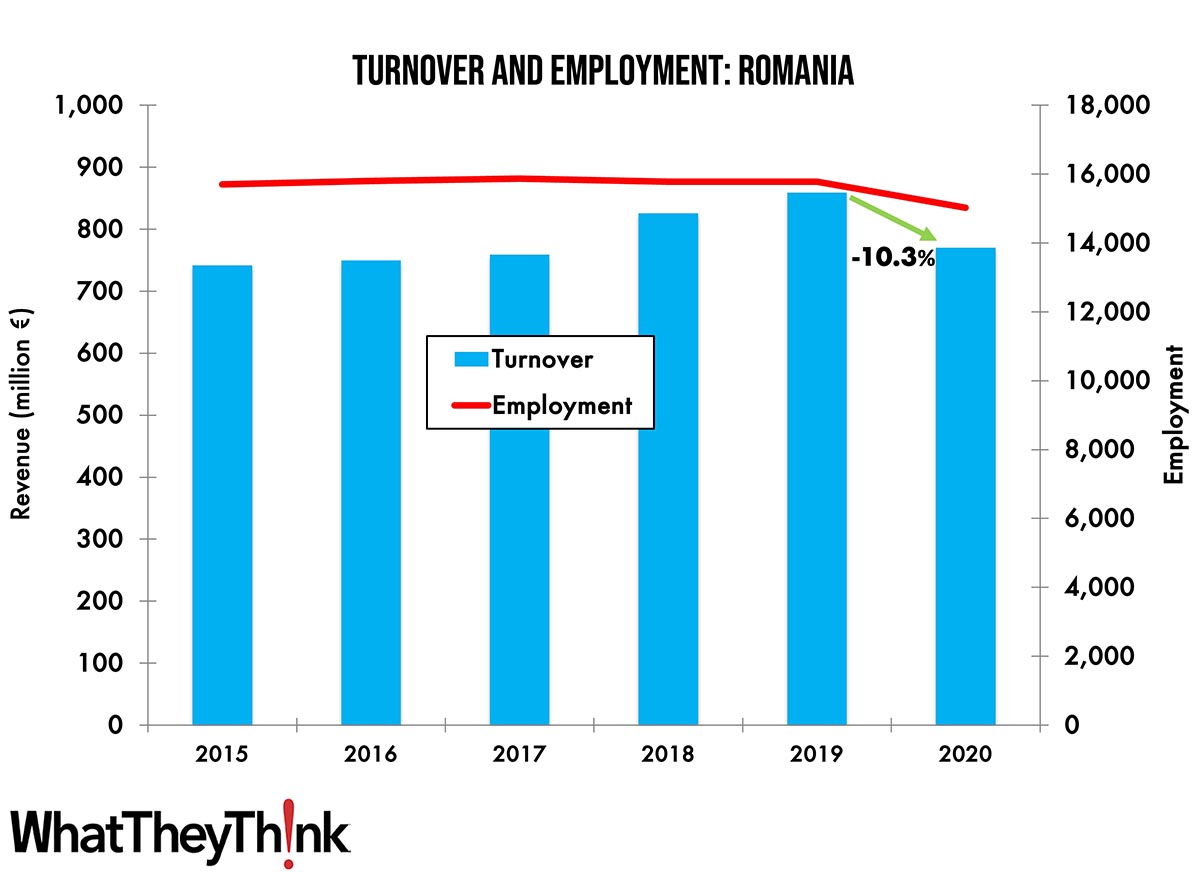
Turnover and Employment in Print in Europe—Romania
Published: October 17, 2023
This bi-weekly series of short articles aims to shed a spotlight on the size of the printing industry in Europe per country and how revenues and employment developed in 2020, when the pandemic impacted businesses. This time we look at Romania, the fourth-largest printing industry by turnover in Central and Eastern Europe. Full Analysis
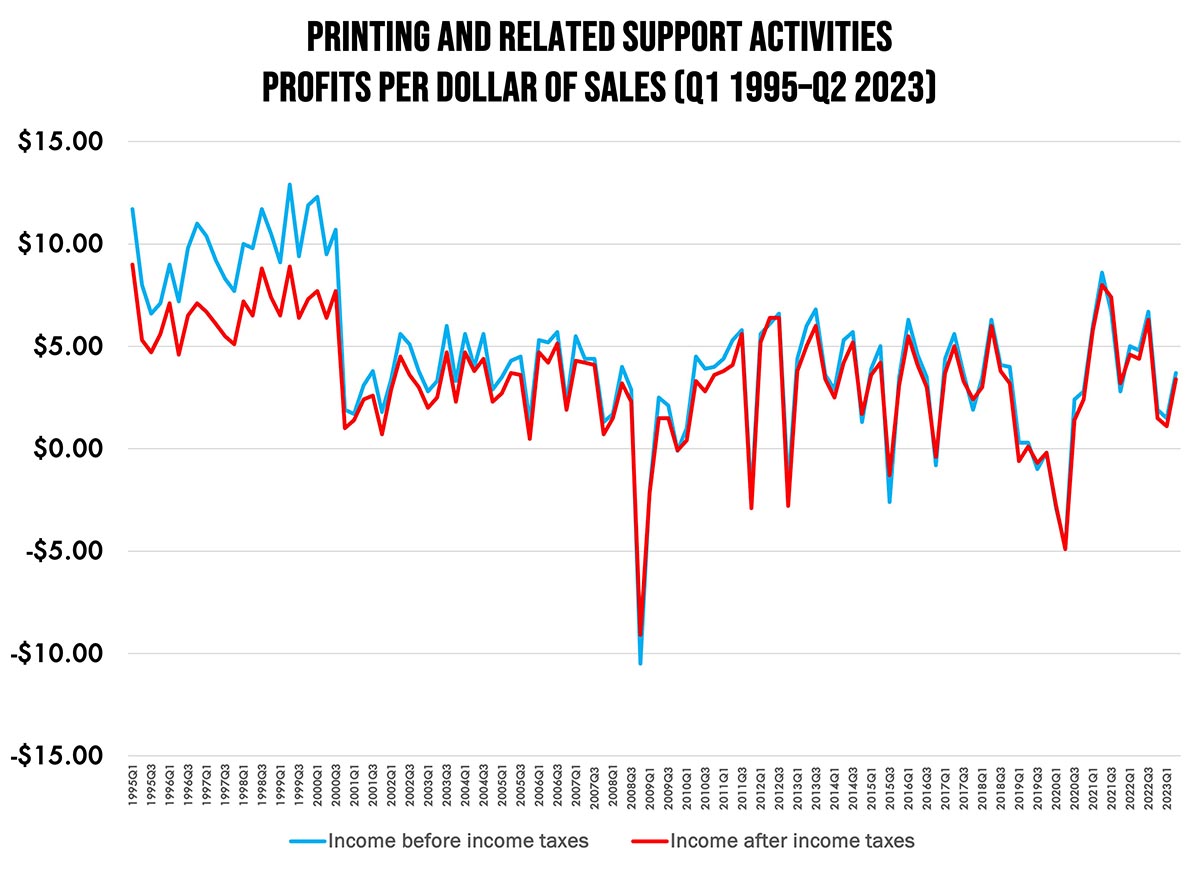
Q2 Industry Profits: The Latest From the Two Cities
Published: October 13, 2023
Quarter-over-quarter profit margin data can be fairly noisy but we’re on a general upward trend since the trough of the pandemic. Full Analysis
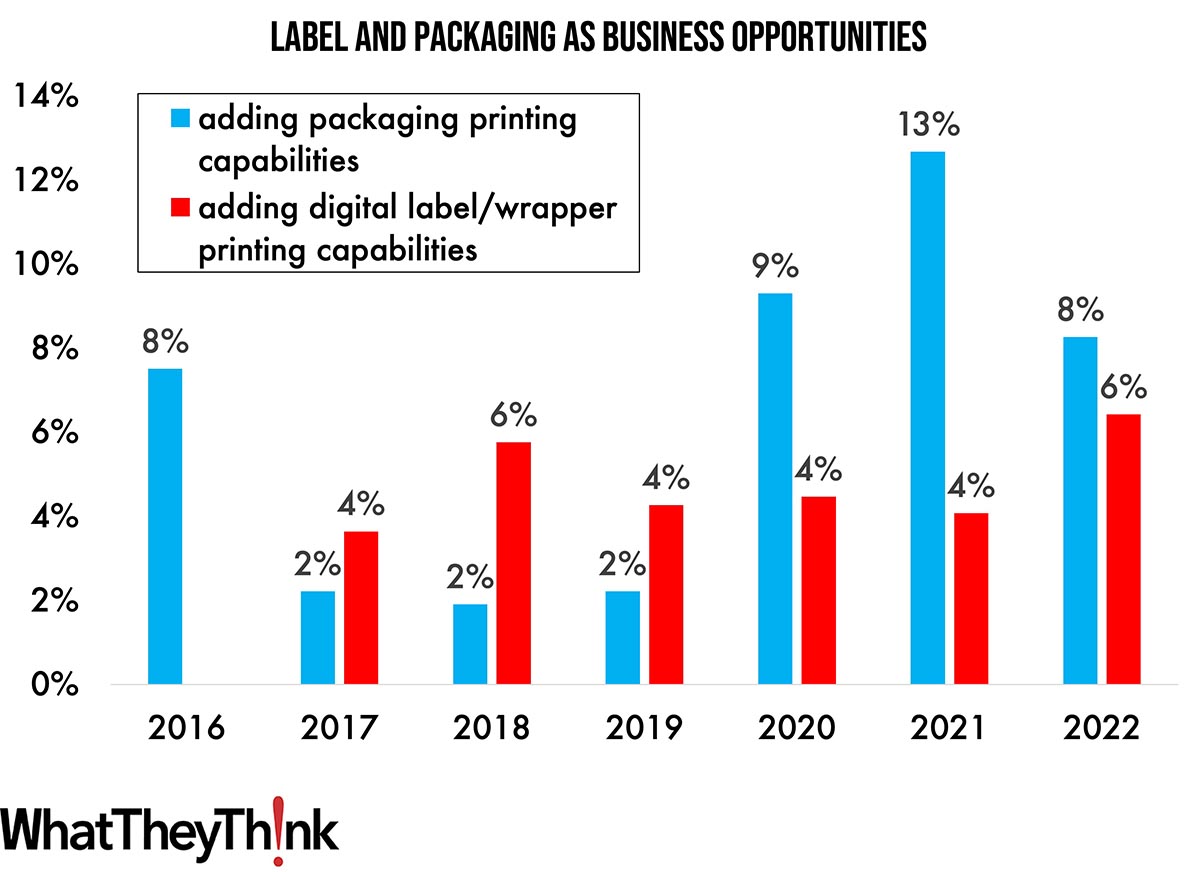
Tales from the Database: A Complete Package?
Published: October 6, 2023
Drawing on six years’ worth of Print Business Outlook surveys, our “Tales from the Database” series looks at historical data to see if we can spot any particular hardware, software or business trends. In this installment, we turn our attention to labels and packaging. Full Analysis
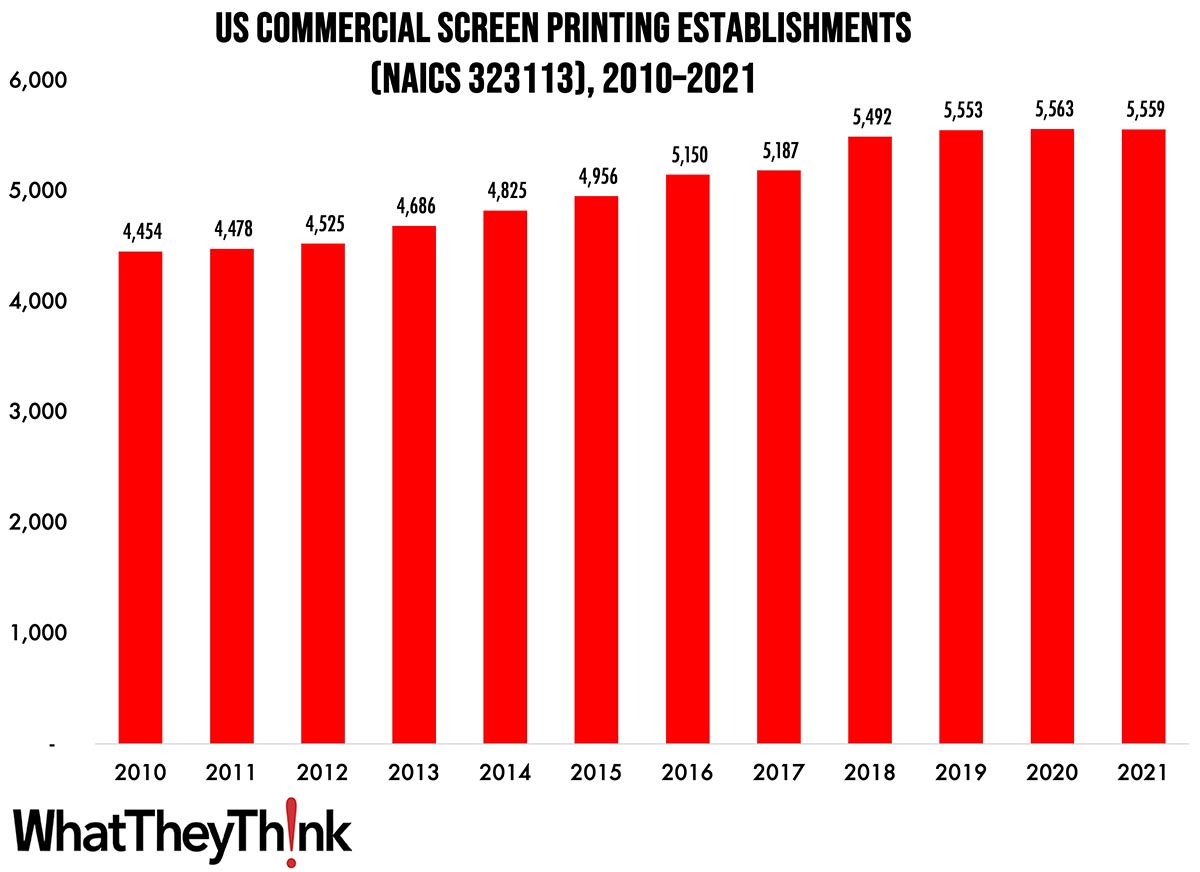
Screen Printing Establishments—2010–2020
Published: September 29, 2023
According to the latest, recently released edition of County Business Patterns, in 2021 there were 5,559 establishments in NAICS 323113 (Commercial Screen Printing). This represents an increase of 25% since 2010—but a decrease of -0.1% from 2020. In macro news, the third estimate of Q2 GDP is unchanged, but with some subtle changes “under the hood.” Full Analysis
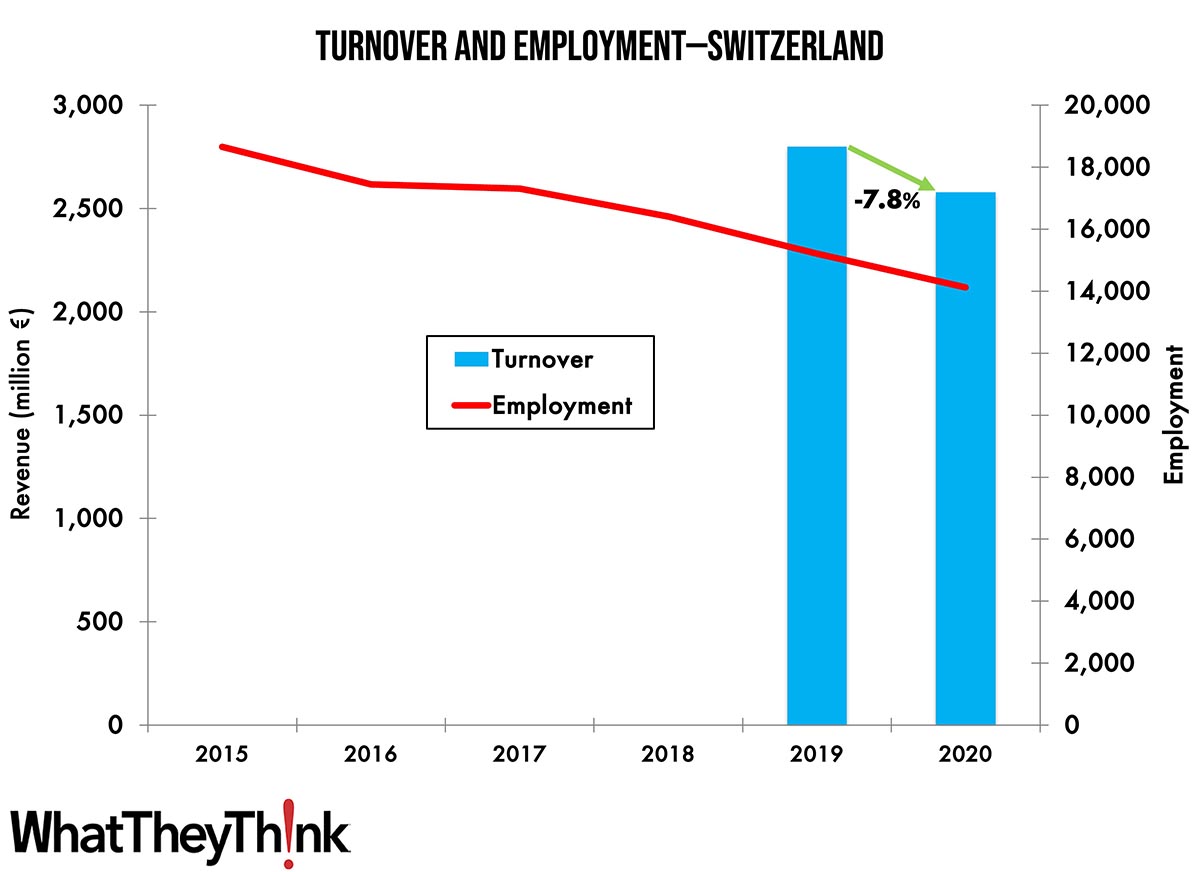
Turnover and Employment in Print in Europe—Switzerland
Published: September 27, 2023
This bi-weekly series of short articles aims to shed a spotlight on the size of the printing industry in Europe per country and how revenues and employment developed in 2020, when the pandemic impacted businesses. This time we look at Switzerland, the eighth-largest printing industry by turnover in Europe. Full Analysis
July Shipments: Down, Down We Go
Published: September 22, 2023
In a year that continues to surprise, July 2023 printing shipments came in at $7.04 billion, down from June’s $7.40 billion. Full Analysis
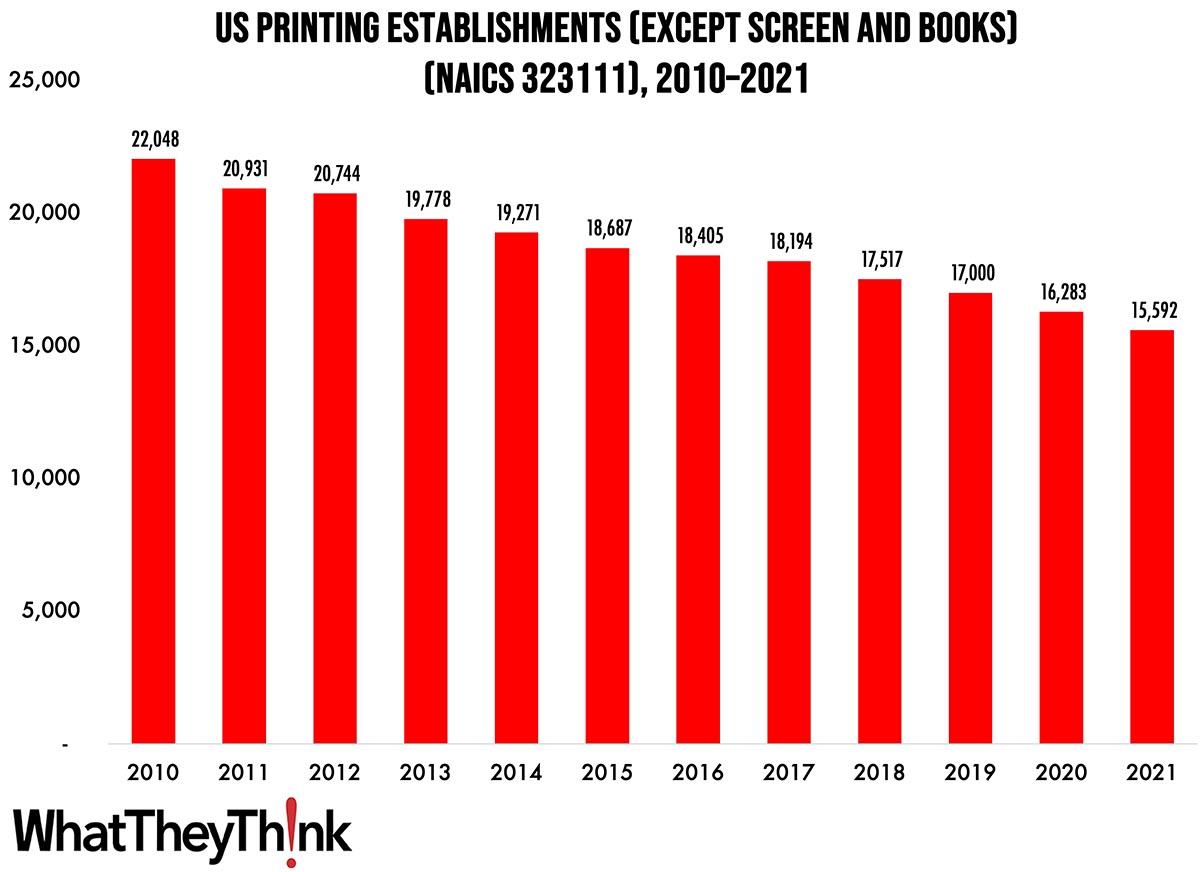
Commercial Printing Establishments—2010–2021
Published: September 15, 2023
According to the latest, recently released edition of County Business Patterns, in 2021 there were 15,592 establishments in NAICS 323111 (Commercial Printing except Screen and Books). This represents a decline of 26% since 2010. In macro news, inflation is alas up. Full Analysis
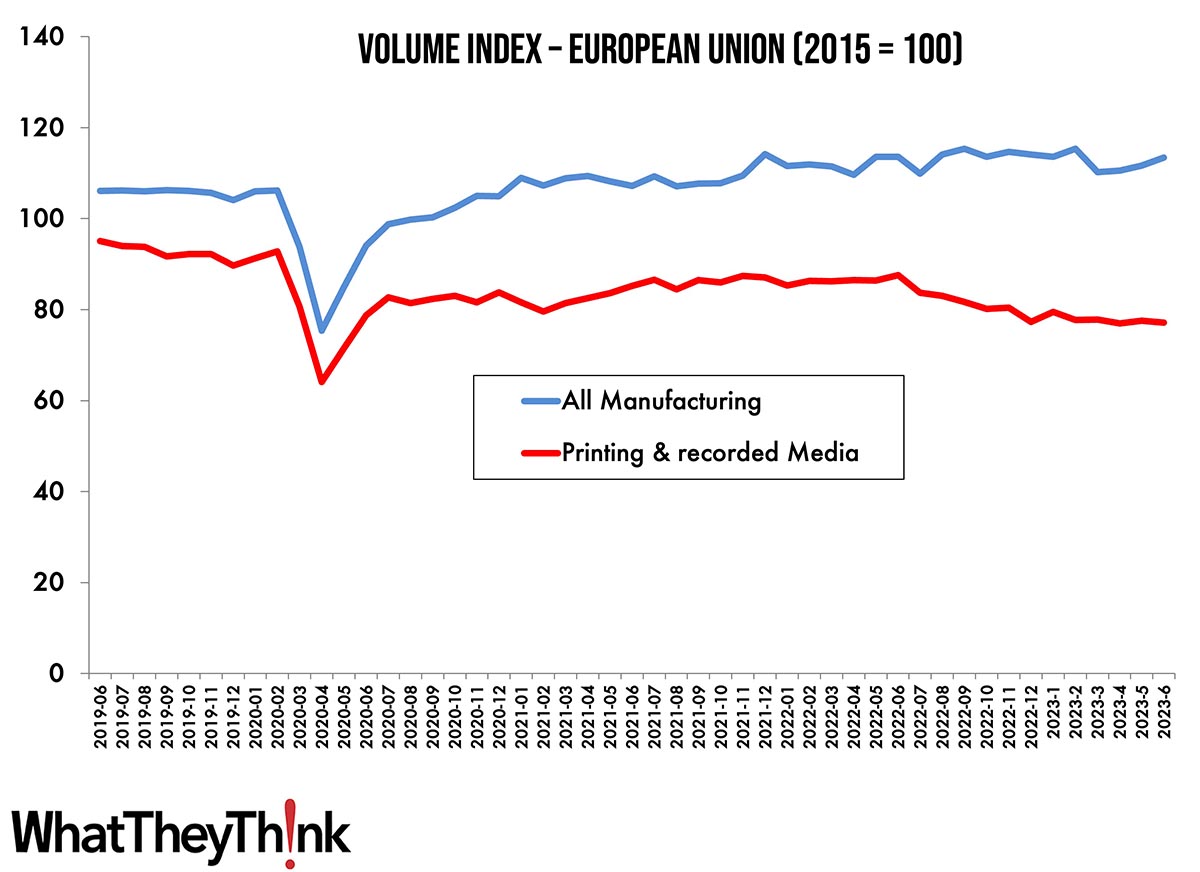
European Print Volume Trends
Published: September 12, 2023
European section editor Ralf Schlözer takes a break from the Europen country-by-country look at turnover and employment to provide a bigger-picture look at print volumes in Europe pre- and post-pandemic. Full Analysis
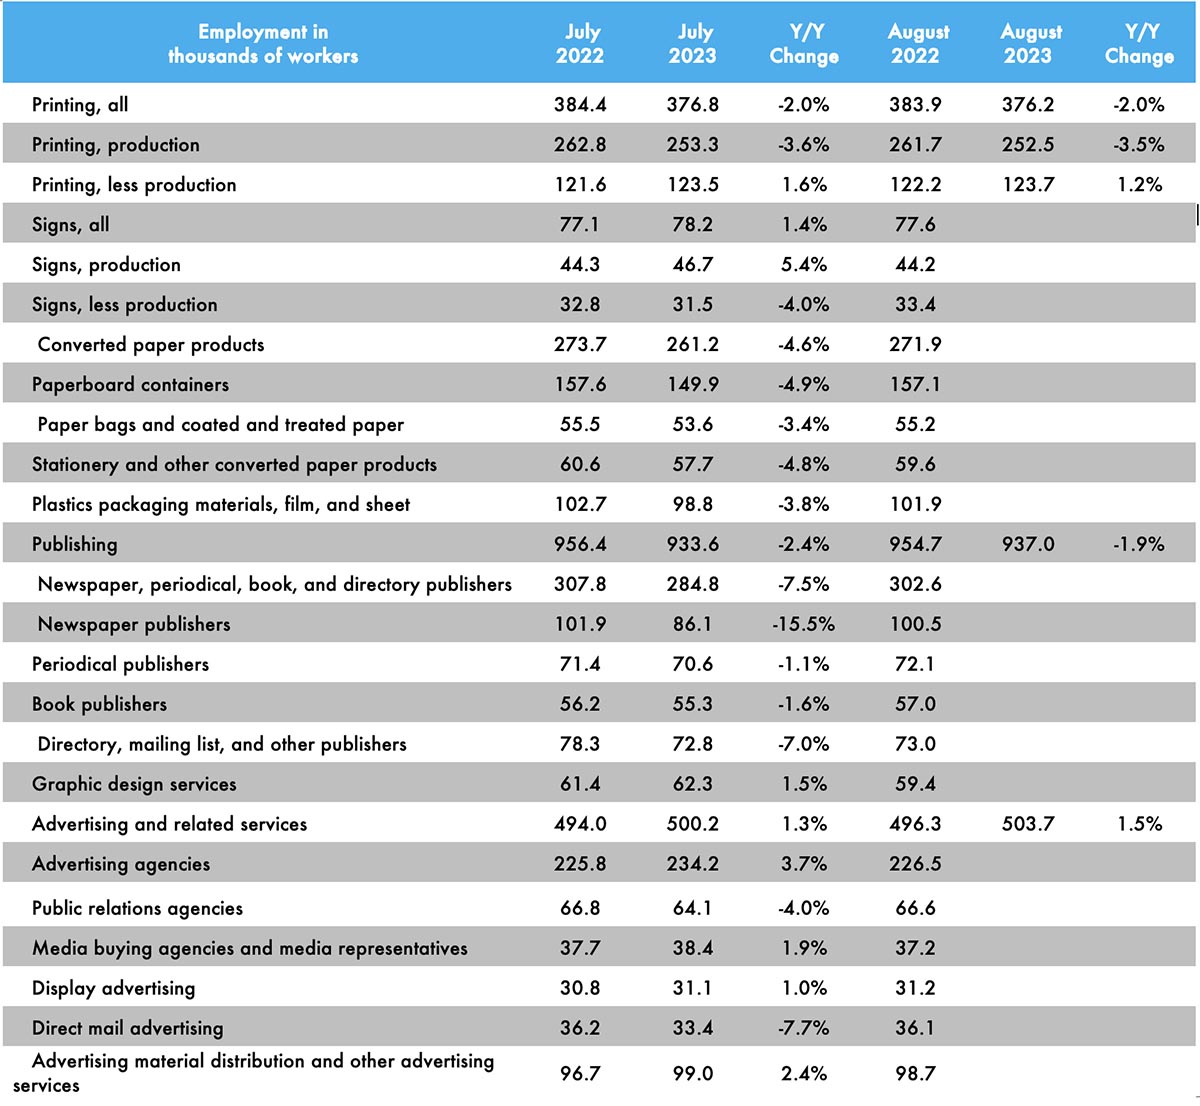
August Printing Production Employment Basically Flat
Published: September 8, 2023
Overall printing employment in August 2023 was down 0.2% from July. Production employment was down 0.3% while non-production employment was up 0.2%. Full Analysis
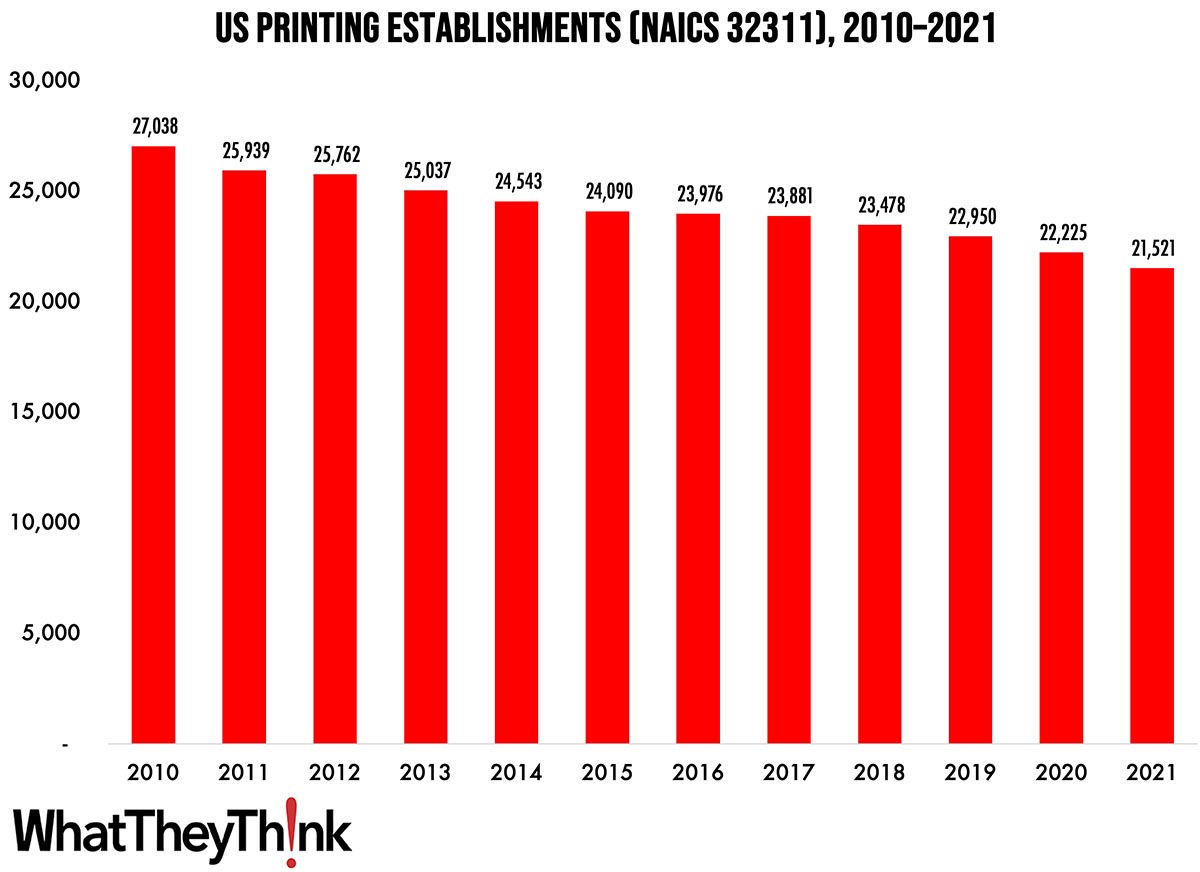
Printing Establishments—2010–2021
Published: September 1, 2023
According to the latest, just-released edition of County Business Patterns, in 2021 there were 21,521 establishments in NAICS 32311 (Printing). This represents a decline of 20% since 2010. In macro news, Q2 GDP revised downward. Full Analysis
June Shipments: Up, Up, and Away
Published: August 25, 2023
In a year that continues to surprise, June 2023 printing shipments came in at $7.38 billion, up from May’s $7.26 billion. Full Analysis
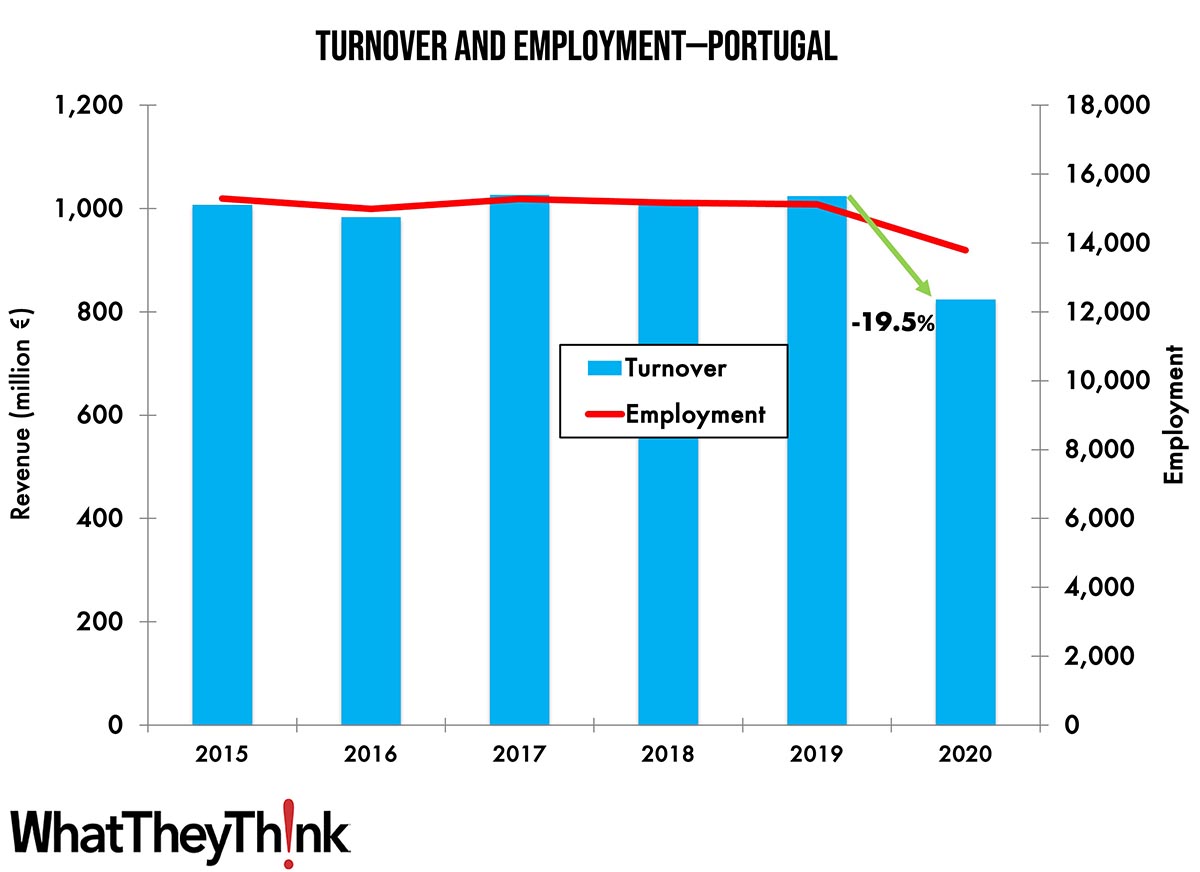
Turnover and Employment in Print in Europe—Portugal
Published: August 21, 2023
This bi-weekly series of articles aims at shedding a spotlight on the size of the printing industry in Europe per country and how revenues and employment developed in 2020, when the pandemic impacted businesses. This time we look at Portugal, the 15th-largest printing industry by turnover in Europe. Full Analysis
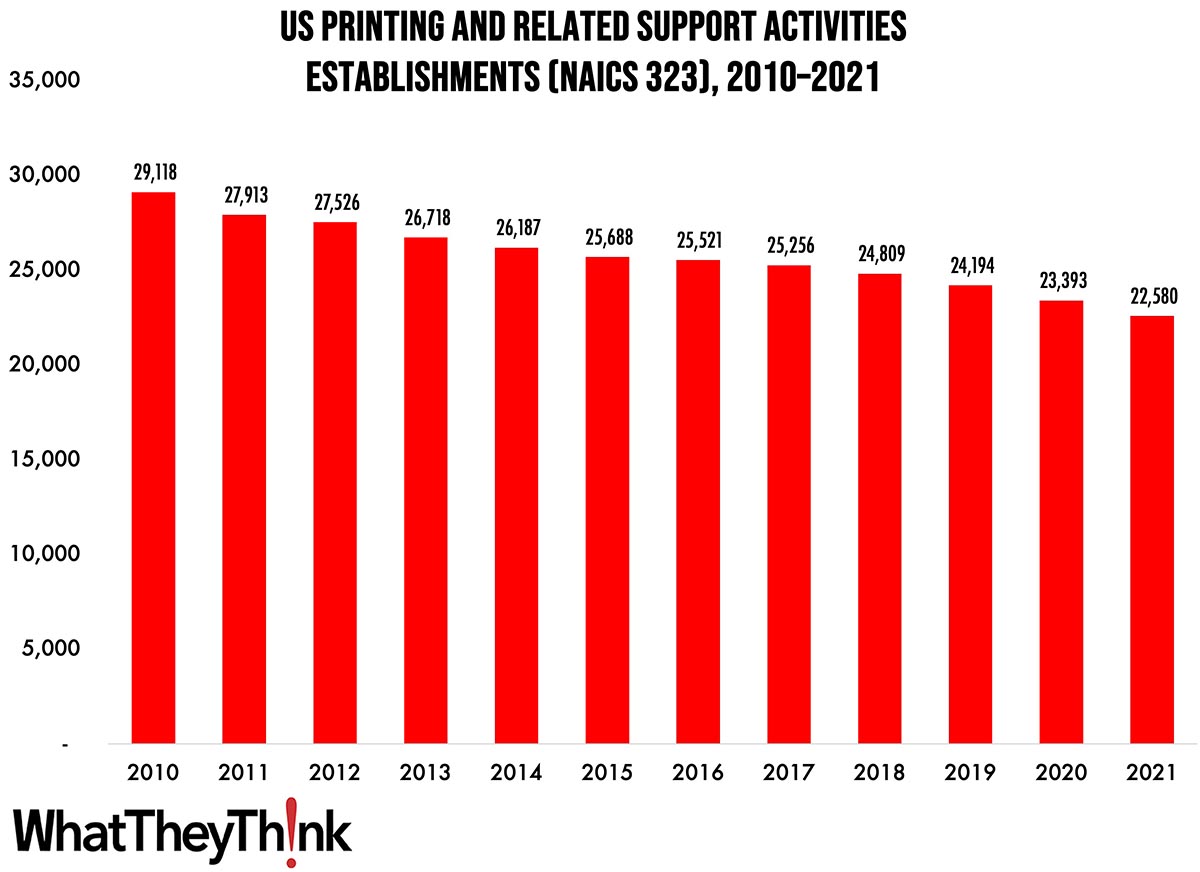
Printing Establishments—2010–2021
Published: August 18, 2023
According to the latest, just-released edition of County Business Patterns, in 2021 there were 22,580 establishments in NAICS 323 (Printing and Related Support Activities). This represents a decline of 22% since 2010. In macro news, July retail sales came in above expectations. Full Analysis
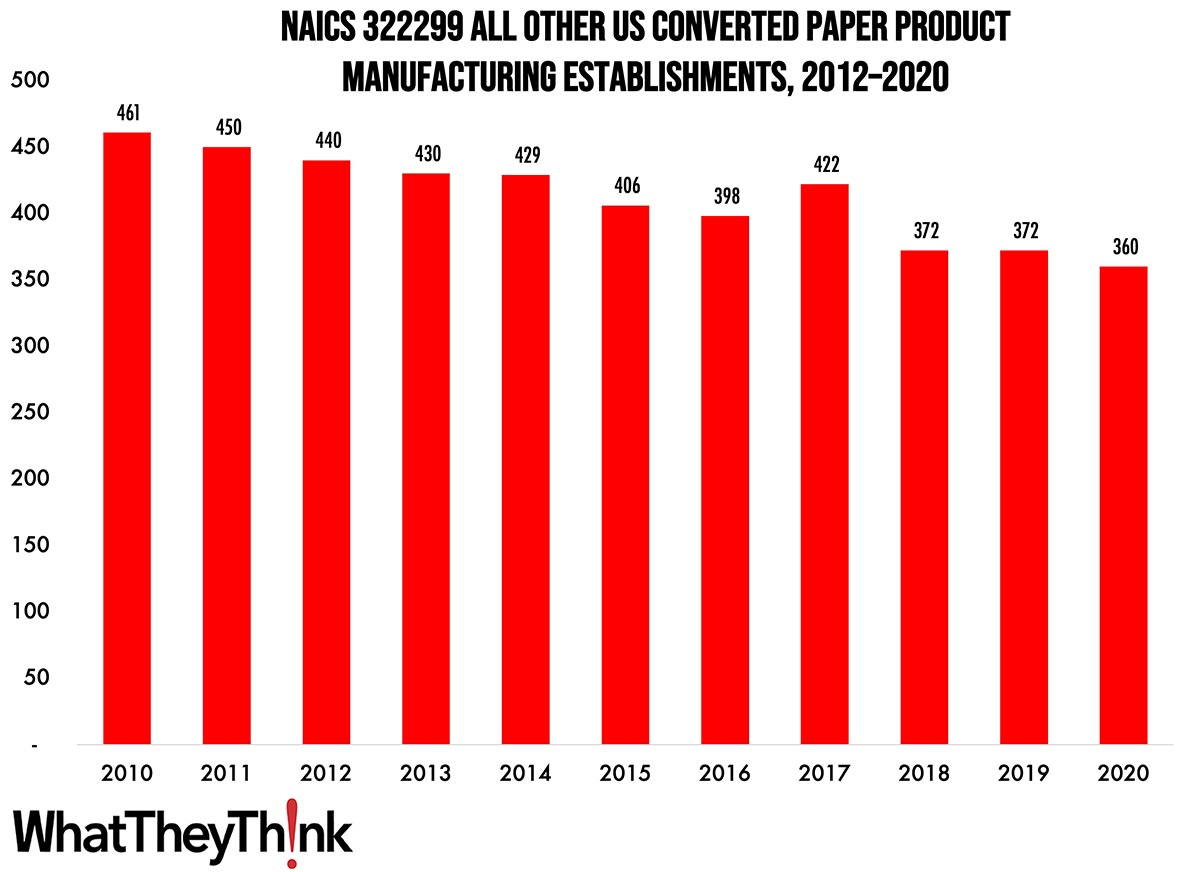
All Other Converted Paper Product Manufacturing Establishments—2010–2020
Published: August 4, 2023
According to County Business Patterns, in 2020 there were 360 establishments in NAICS 322299 (All Other Converted Paper Product Manufacturing). This category saw a net decrease in establishments of -22% since 2010. In macro news, Q2 GDP is up. Full Analysis
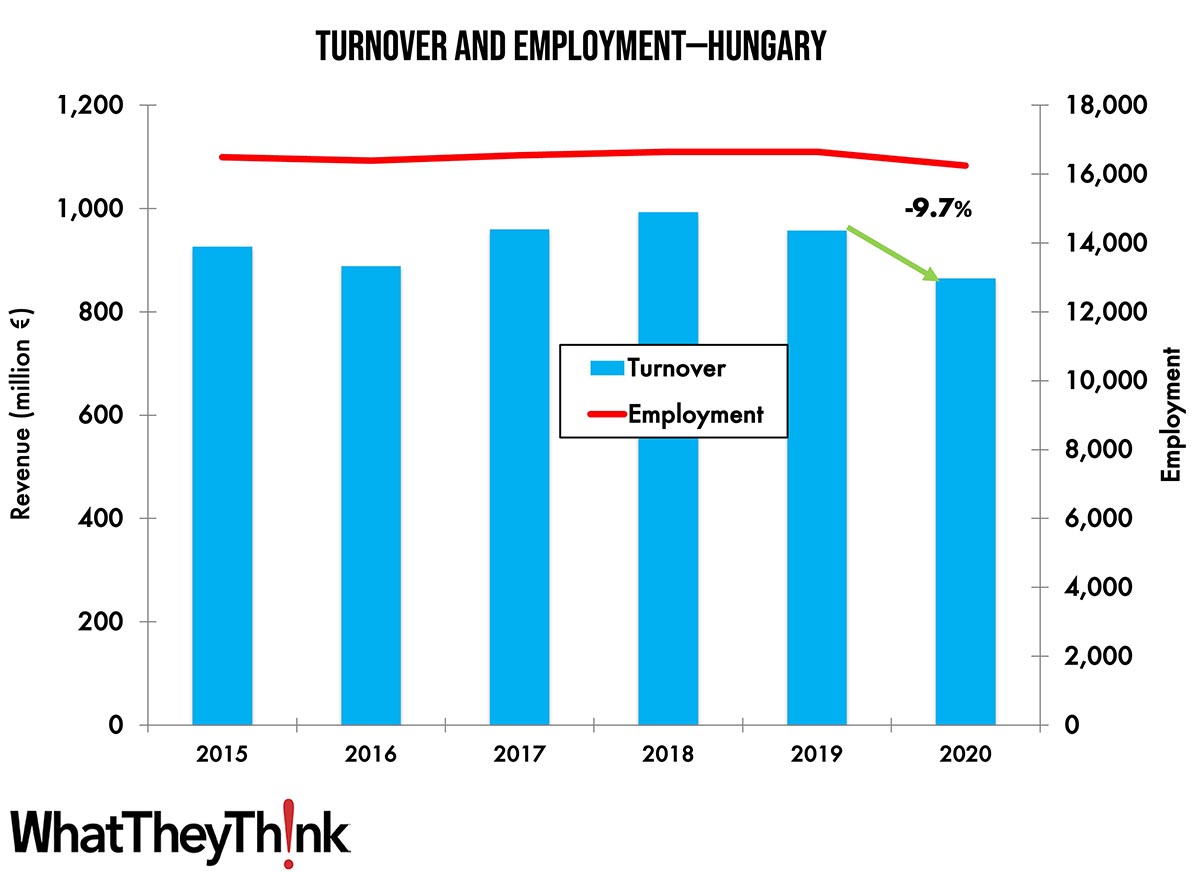
Turnover and Employment in Print in Europe—Hungary
Published: August 1, 2023
This series of short articles aims at shedding a spotlight on the size of the printing industry in Europe per country and how revenues and employment developed in 2020, when the pandemic impacted businesses. This time we look at Hungary, the 13th-largest printing industry by turnover in Europe and third largest in Central and Eastern Europe. Full Analysis
May Shipments Take an Unexpected—But Welcome—Turn
Published: July 28, 2023
May 2023 printing shipments came in at $7.26 billion, unexpectedly up from April’s $7.01 billion. Full Analysis
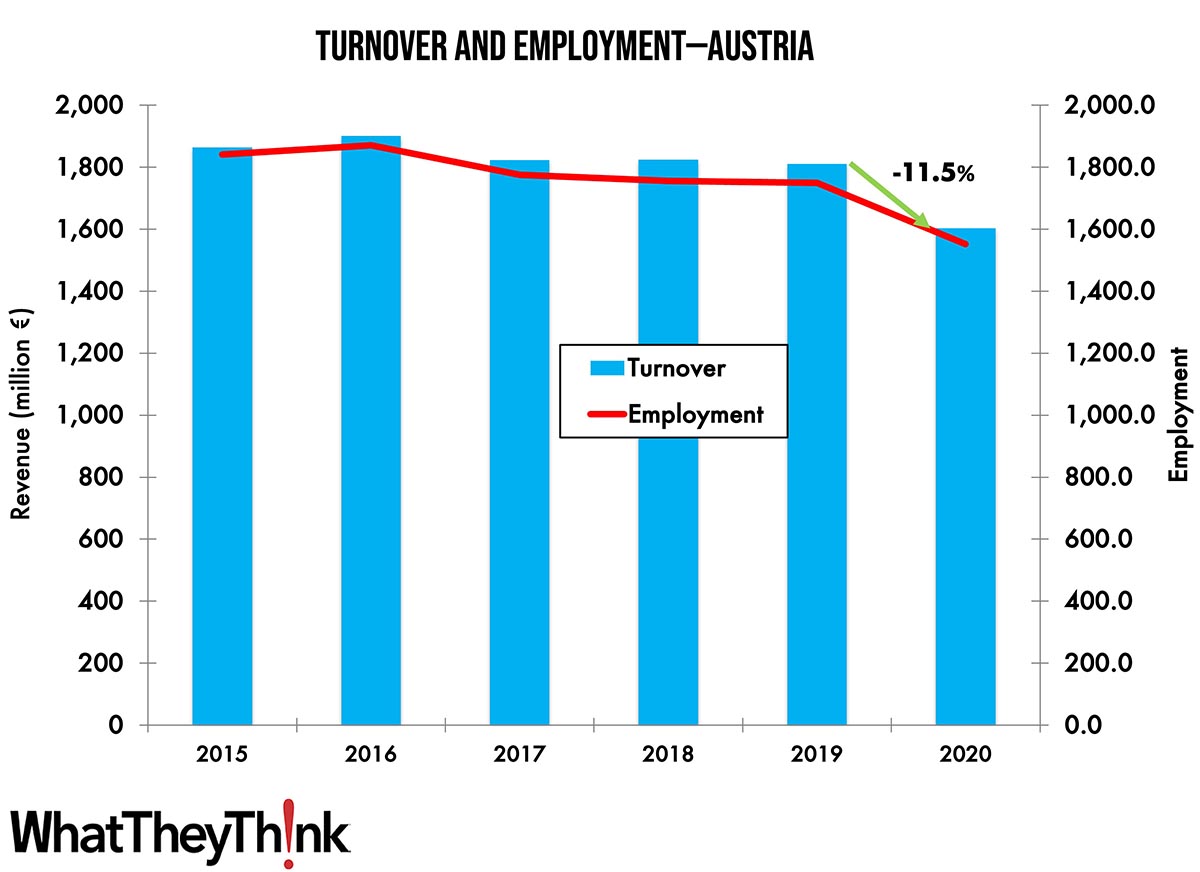
Turnover and Employment in Print in Europe—Austria
Published: July 25, 2023
This bi-weekly series of short articles aims at shedding a spotlight on the size of the printing industry in Europe per country and how revenues and employment developed in 2020, when the pandemic impacted businesses. This time we look at Austria, the tenth-largest printing industry by turnover in Europe. Full Analysis
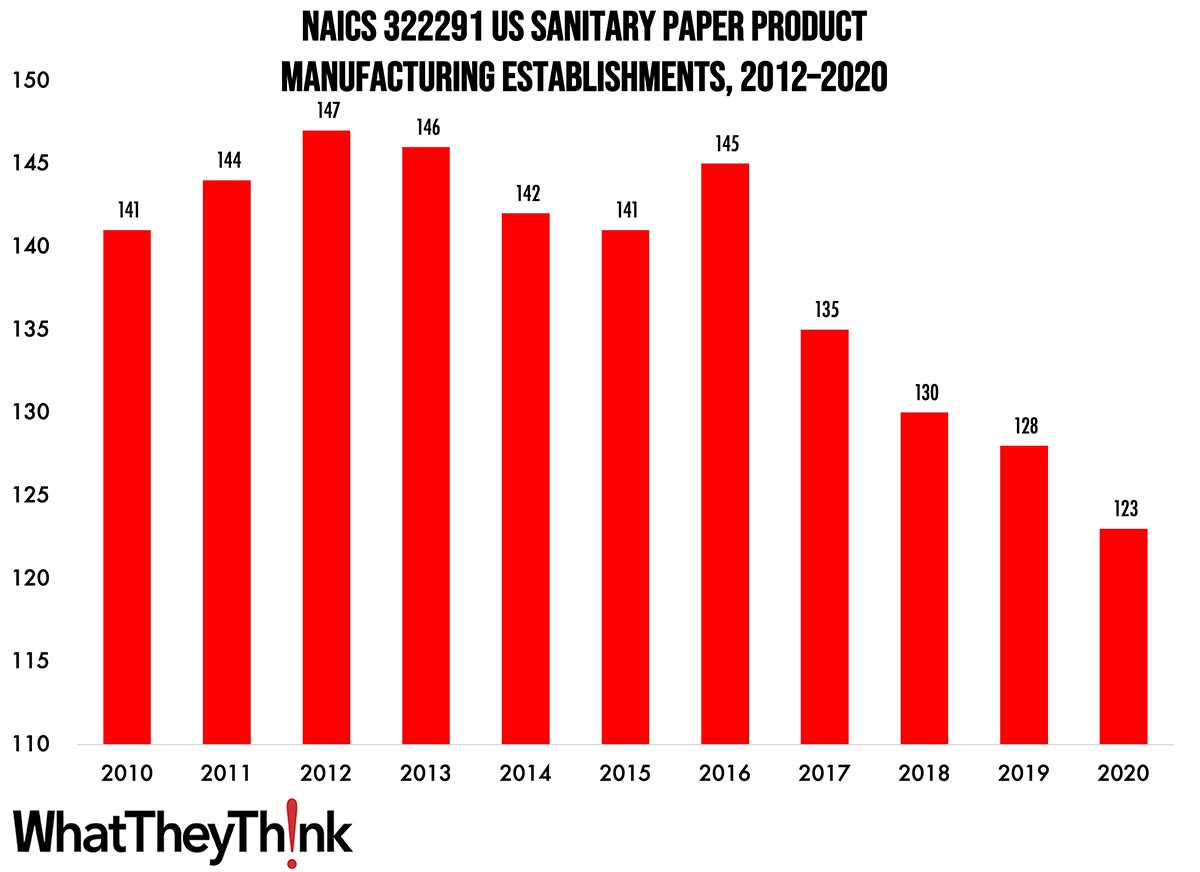
Sanitary Paper Product Manufacturing Establishments—2010–2020
Published: July 21, 2023
According to County Business Patterns, in 2020 there were 123 establishments in NAICS 322291 (Sanitary Paper Product Manufacturing). This category saw a net decrease in establishments of -13% since 2010. In macro news, new business applications continue to rise. Full Analysis
June Printing Production Employment Up Slightly, Non-Production Down
Published: July 14, 2023
Overall printing employment in June 2023 was down -0.2% from March. Production employment was up 0.4% while non-production employment was down -0.6%. Full Analysis
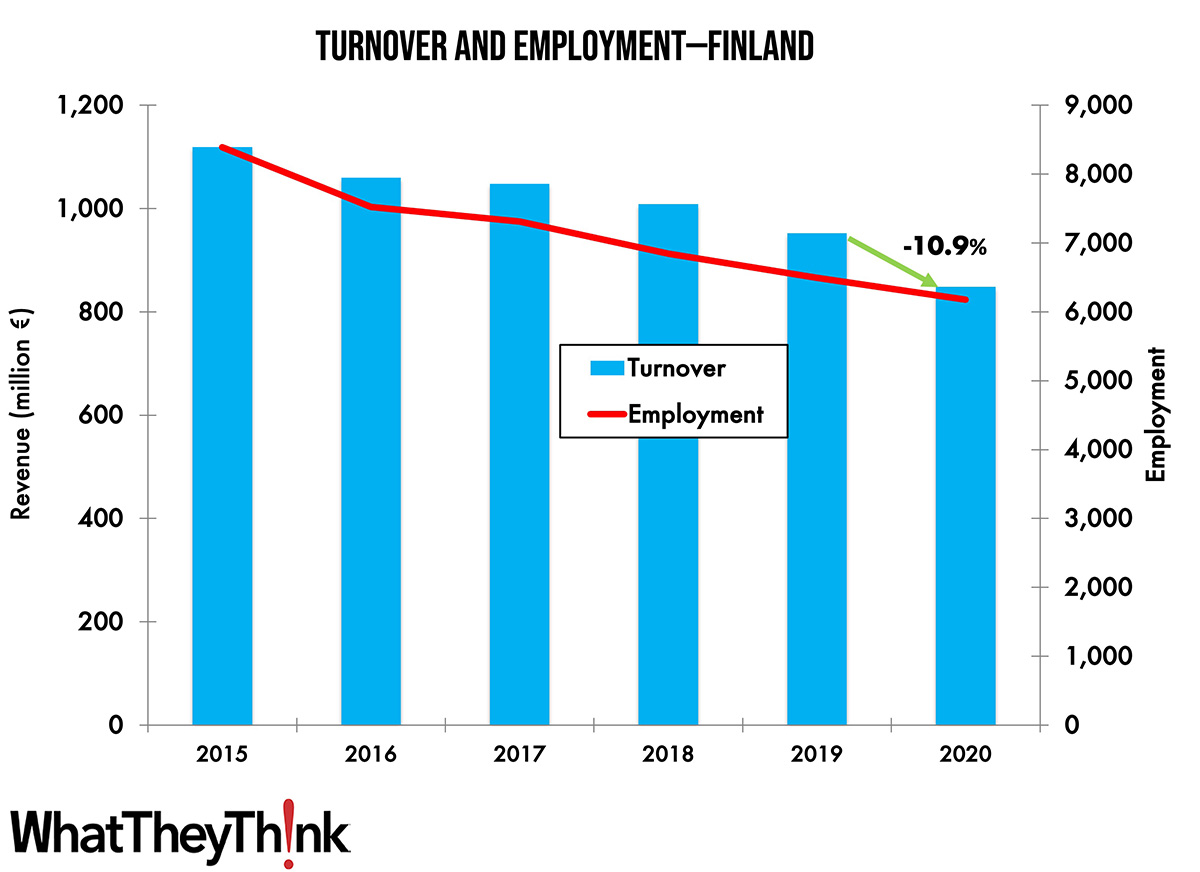
Turnover and Employment in Print in Europe—Finland
Published: July 11, 2023
This bi-weekly series of short articles aims at shedding a spotlight on the size of the printing industry in Europe per country and how revenues and employment developed in 2020, when the pandemic impacted businesses. This time we look at Finland, the 14th largest printing industry by turnover in Europe and the second largest in the Nordic region. Full Analysis
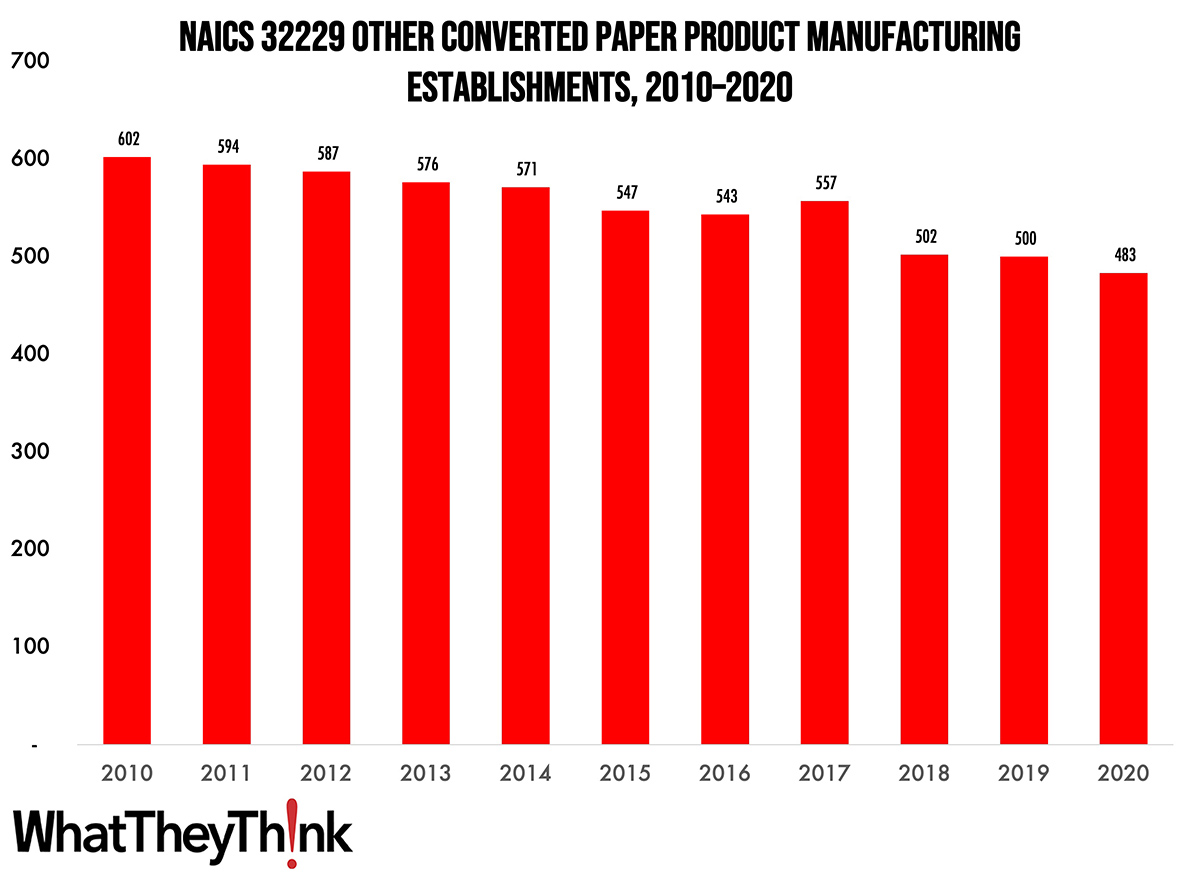
Other Converted Paper Product Manufacturing Establishments—2010–2020
Published: June 30, 2023
According to County Business Patterns, in 2020 there were 483 establishments in NAICS 32229 (Other Converted Paper Product Manufacturing). This category saw a net decrease in establishments of -20% since 2010. In macro news, BEA revises Q1 GDP up. Full Analysis
April Shipments Maintain Seasonality—Just as We Feared
Published: June 23, 2023
April 2023 printing shipments came in at $7.00 billion, down from March’s $7.58 billion and in line with annual seasonality—although it is a bit below the previous two Aprils. Full Analysis
Stationery Product Manufacturing Establishments—2010–2020
Published: June 16, 2023
According to County Business Patterns, in 2020 there were 324 establishments in NAICS 32223 (Stationery Product Manufacturing). This category saw a net decrease in establishments of -35% since 2010. In macro news, the US birth rate increased insignificantly in 2022—the latest in a worrying demographic trend. Full Analysis
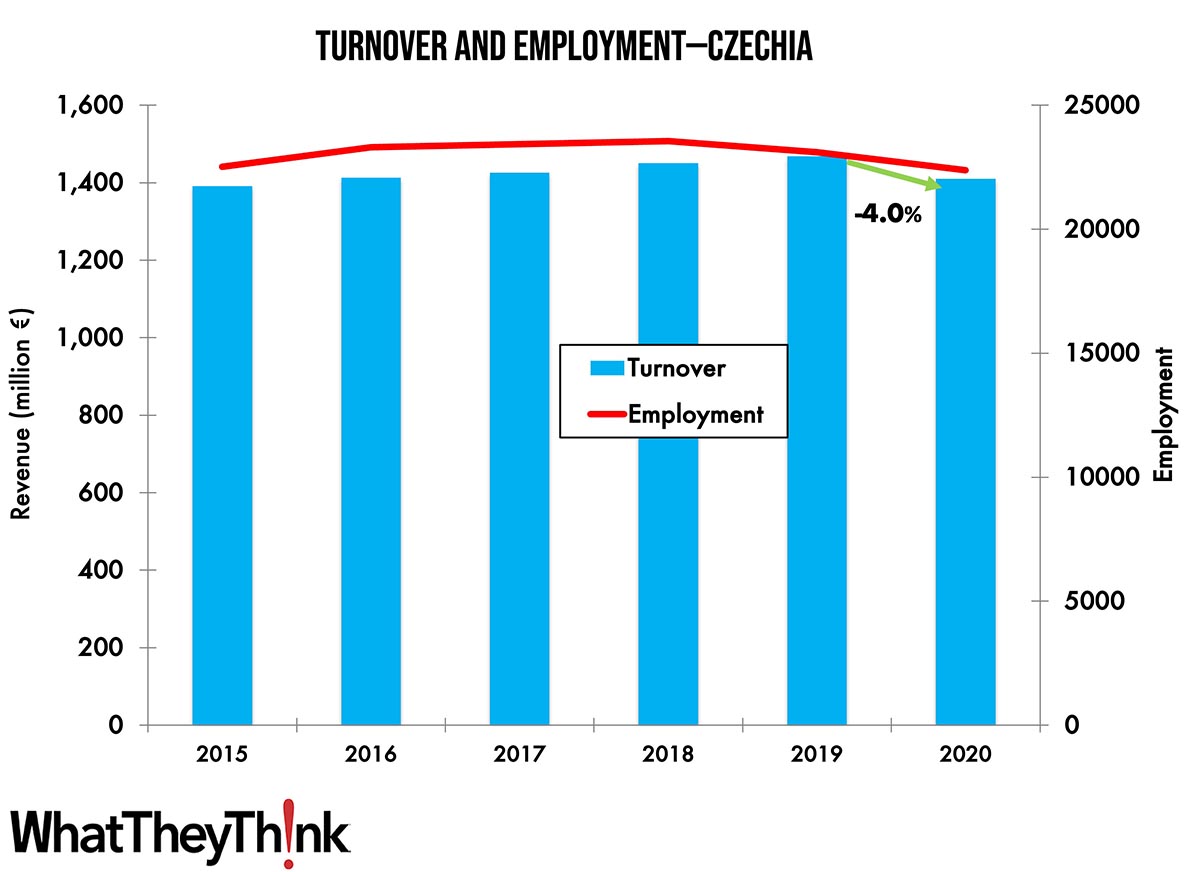
Turnover and Employment in Print in Europe—Czechia
Published: June 14, 2023
This bi-weekly series of short articles aims at shedding a spotlight on the size of the printing industry in Europe per country and how revenues and employment developed in 2020, when the pandemic impacted businesses. This time we look at Czechia (also called Czech Republic), the eleventh-largest printing industry by turnover in Europe and the second largest in Central and Eastern Europe. Full Analysis
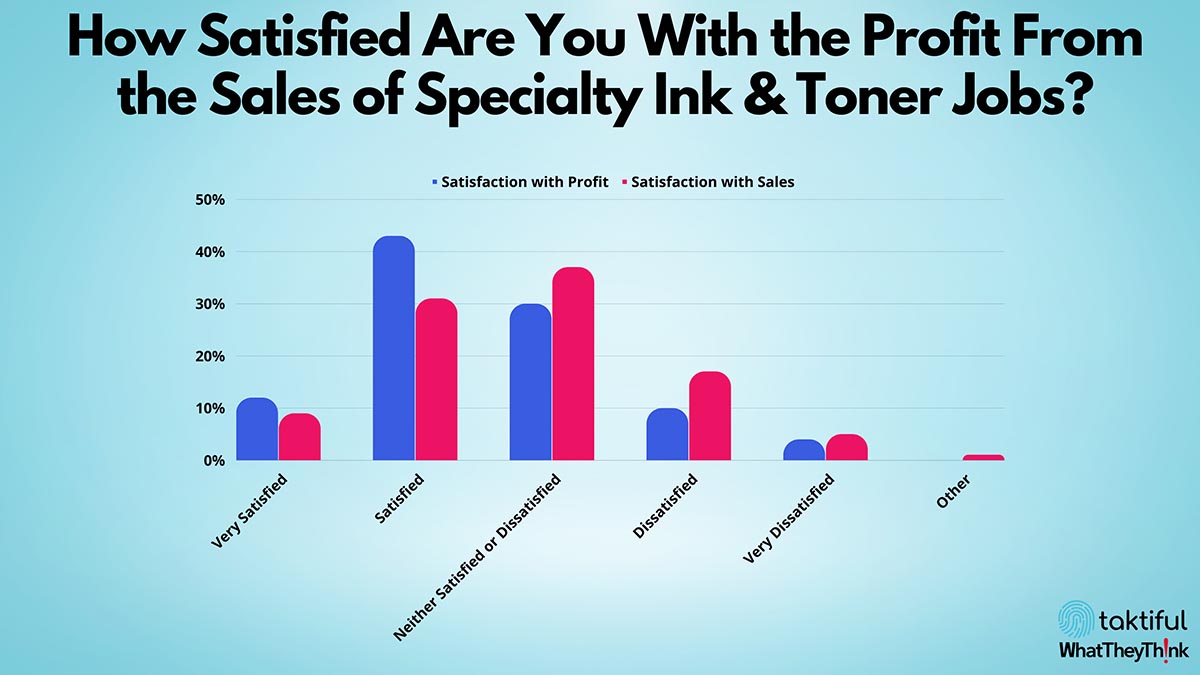
Printing Pulse: Embellishment Edition
Published: June 9, 2023
This edition of our Friday data series offers a preliminary “sneak peek” at the results of the Taktiful and WhatTheyThink 2023 Specialty Digital Ink and Toner Embellishment Study. This study takes a deep dive into how current users of digital ink and toner embellishment technologies are utilizing them, what the response from customers has been, how satisfied print providers have been with the sales and profitability of these jobs, where the challenges lie, and their general feelings about the future of digital ink and toner embellishment technologies. Full Analysis
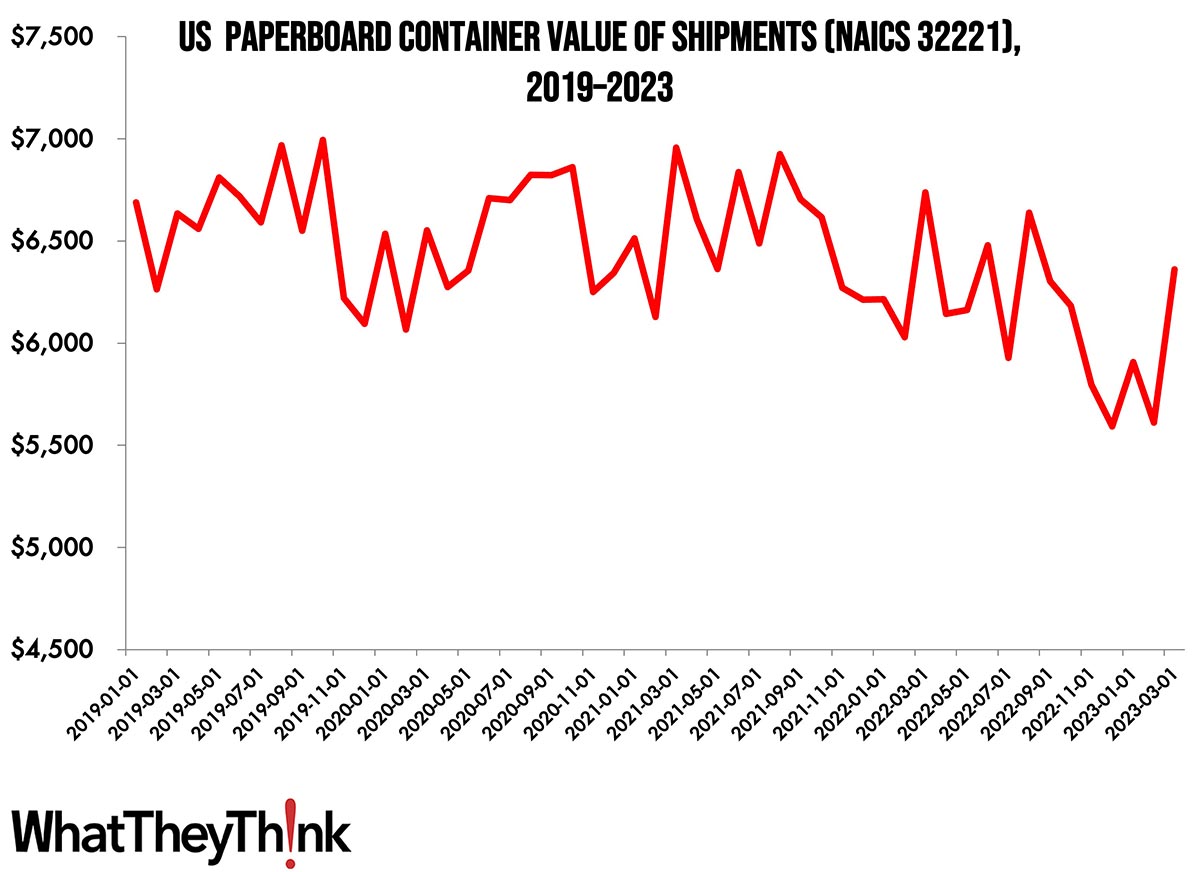
Paperboard Container Shipments Back up to Pandemic Levels
Published: June 2, 2023
In March 2023, the value of shipments of paperboard containers was $6.361 billion, the highest it has been since August 2022. Full Analysis
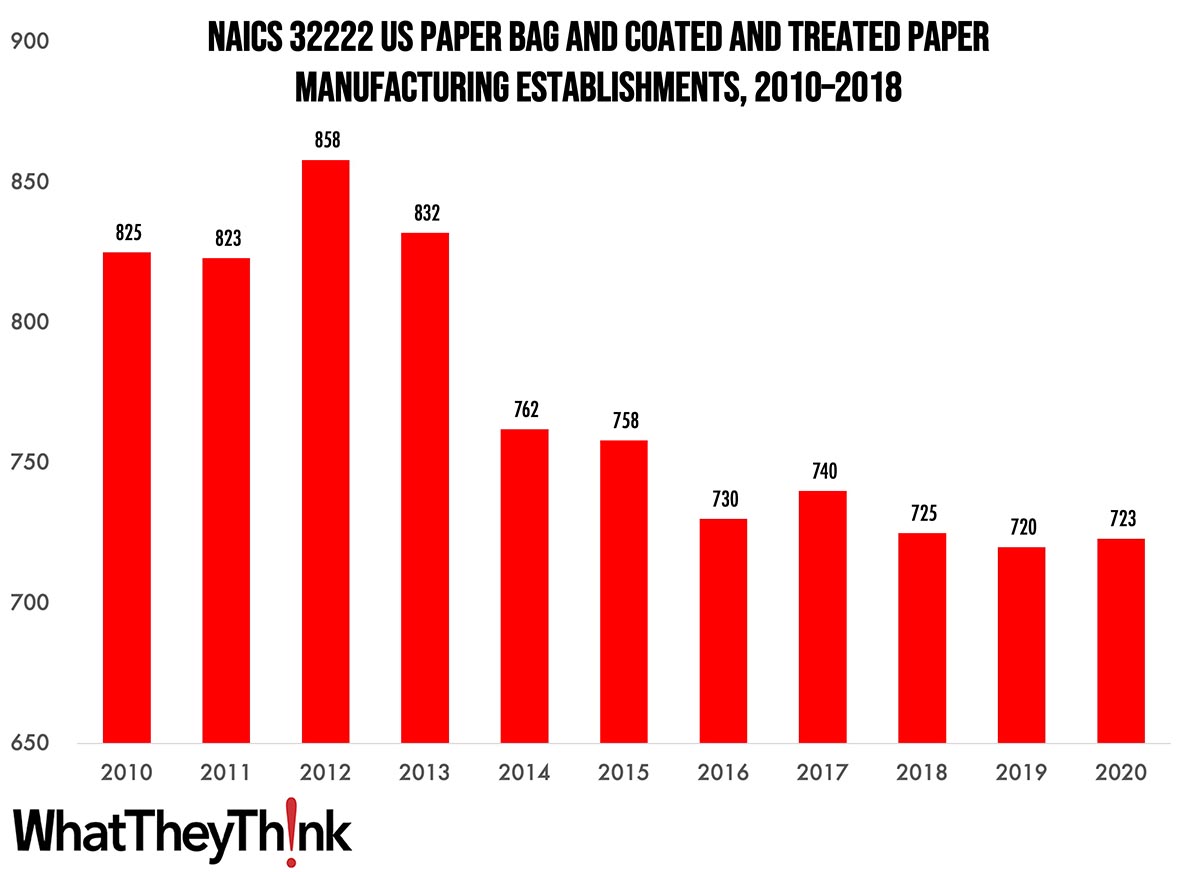
Paper Bag and Coated and Treated Paper Manufacturing Establishments—2010–2020
Published: May 26, 2023
According to County Business Patterns, in 2020 there were 723 establishments in NAICS 32222 (Paper Bag and Coated and Treated Paper Manufacturing). This category saw a net decrease in establishments of -12% since 2010. In macro news, the Architecture Billings Index suggests a recovery from the slowdown in the construction industry. Full Analysis
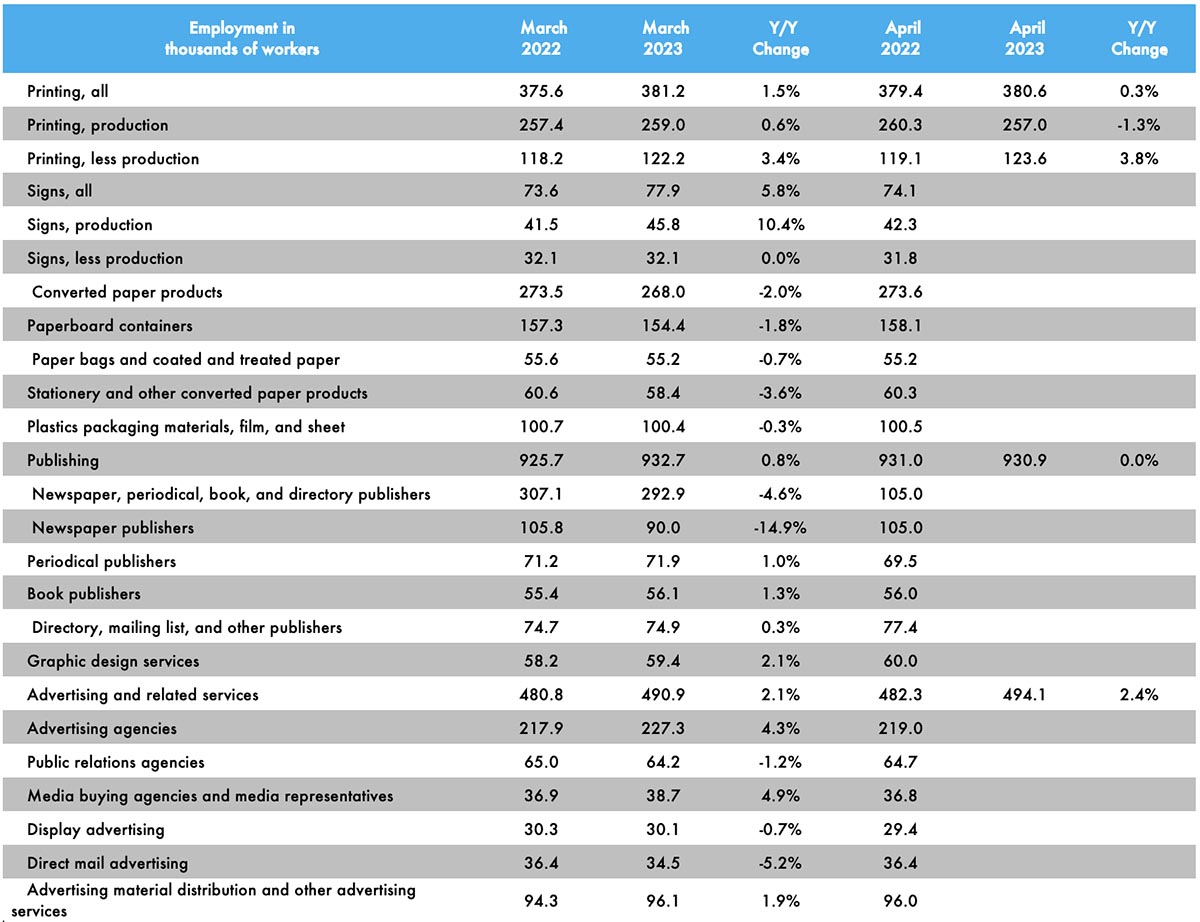
April Printing Production Employment Down Slightly, Non-Production Up
Published: May 19, 2023
Overall printing employment in April 2023 was down -0.2% from March. Production employment was down -0.8% while non-production employment was up 1.1%. Full Analysis
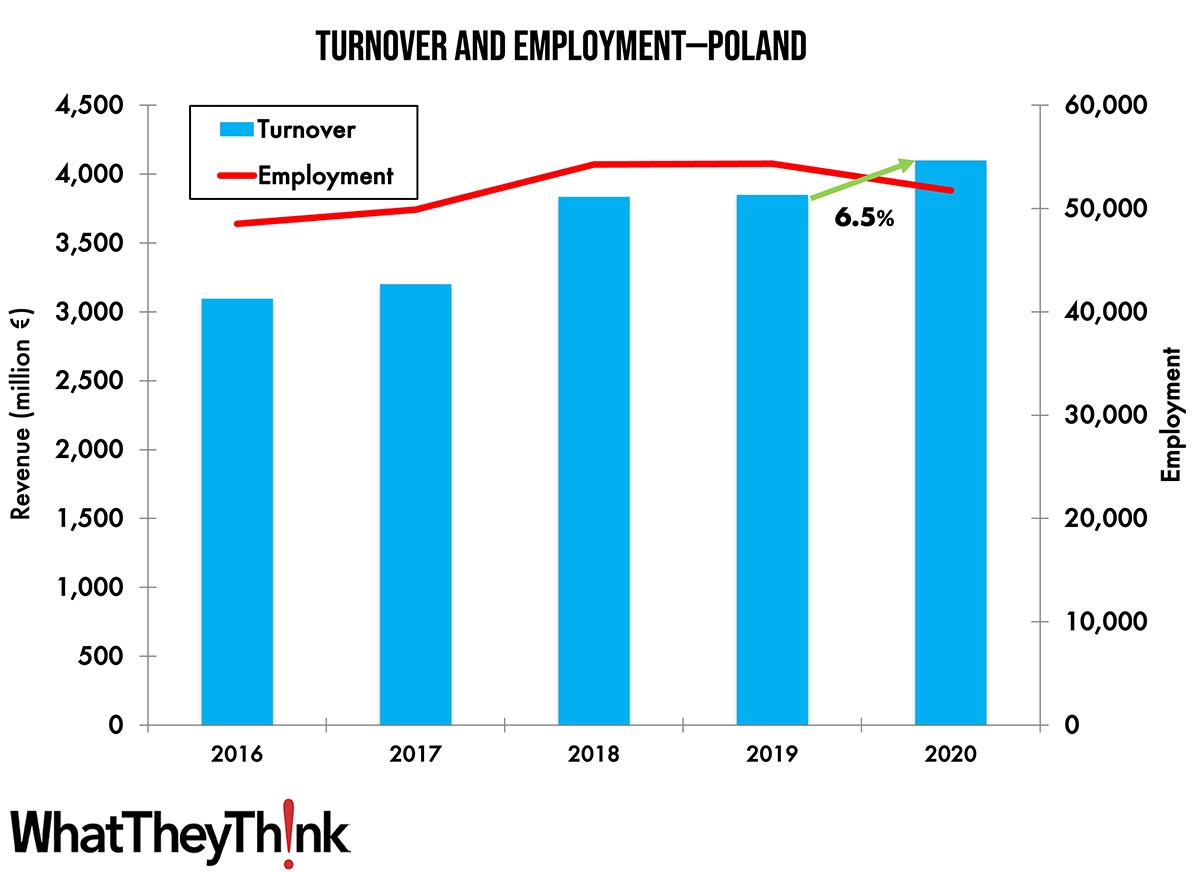
Turnover and Employment in Print in Europe—Poland
Published: May 15, 2023
This bi-weekly series of short articles aims at shedding a spotlight on the size of the printing industry in Europe per country and how revenues and employment developed in 2020, when the pandemic impacted businesses. This time we look at Poland, the sixth-largest printing industry by turnover in Europe and the largest in Central and Eastern Europe. Full Analysis
Other Paperboard Container Manufacturing Establishments—2010–2020
Published: May 12, 2023
According to County Business Patterns, in 2020 there were 278 establishments in NAICS 322219 (Other Paperboard Container Manufacturing). This category saw a net decrease in establishments of -20% since 2010. In macro news, inflation is slowing but still high. Full Analysis
March Shipments Maintain Seasonality—Make of That What You Will
Published: May 5, 2023
March 2023 printing shipments came in at $7.18 billion, up from February’s $6.46 billion and in line with annual seasonality—even if it is below the previous two Marches. Full Analysis
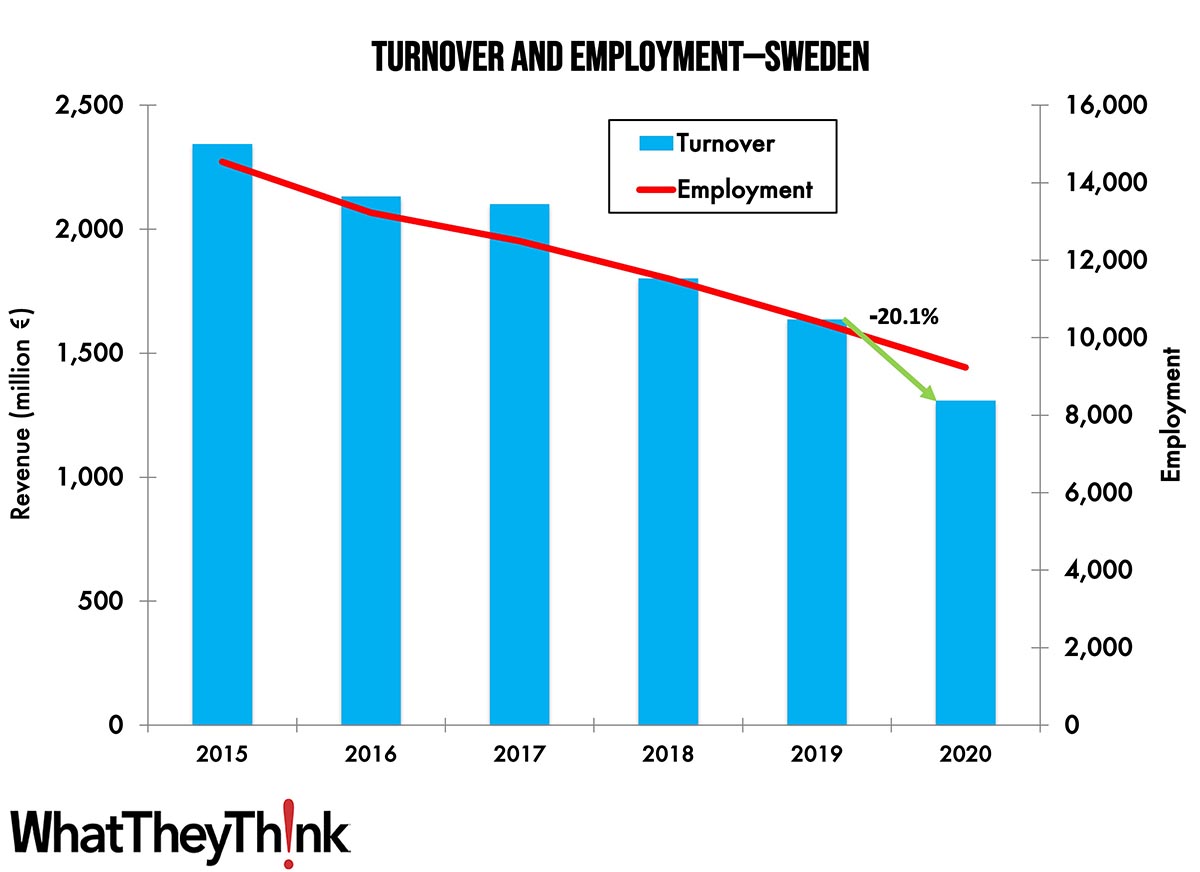
Turnover and Employment in Print in Europe—Sweden
Published: May 1, 2023
This bi-weekly series of short articles aims at shedding a spotlight on the size of the printing industry in Europe per country and how revenues and employment developed in 2020, when the pandemic impacted businesses. This time we look at Sweden, the 12th-largest printing industry by turnover in Europe. Full Analysis
Folding Paperboard Box Manufacturing Establishments—2010–2020
Published: April 28, 2023
According to County Business Patterns, in 2020 there were 546 establishments in NAICS 322212 (Folded Paperboard Box Manufacturing). This category saw a net increase in establishments of 11% since 2010. In macro news, Q1 2023 GDP shows third straight quarter of growth. Full Analysis
February Printing Employment Essentially Flat
Published: April 21, 2023
Overall printing employment in February 2023 was up 0.3% from January. Production employment was up 0.1% while non-production employment was up 0.7%. Full Analysis
Turnover and Employment in Print in Europe—Belgium
Published: April 17, 2023
This bi-weekly series of short articles aims at shedding a spotlight on the size of the printing industry in Europe per country and how revenues and employment developed in 2020, when the pandemic impacted businesses. This time we look at Belgium, the ninth-largest printing industry by turnover in Europe. Full Analysis
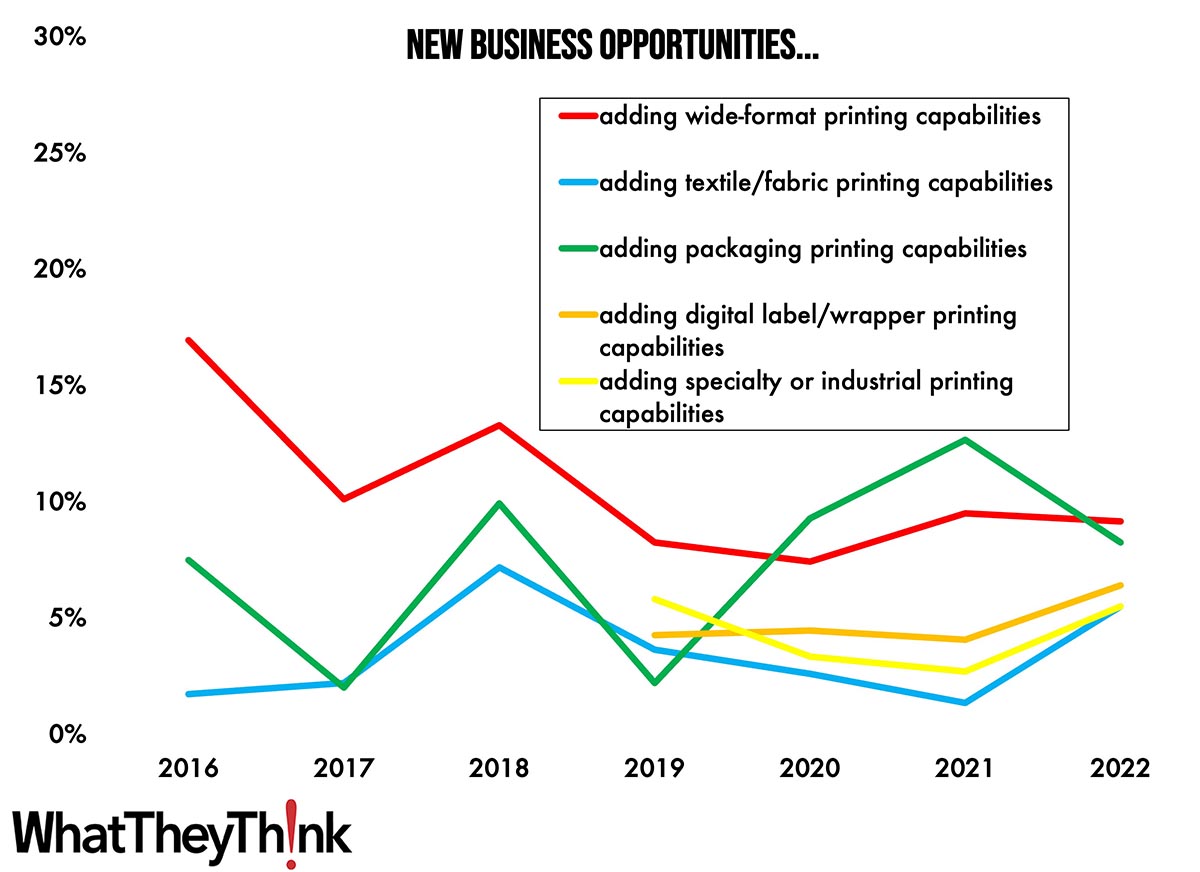
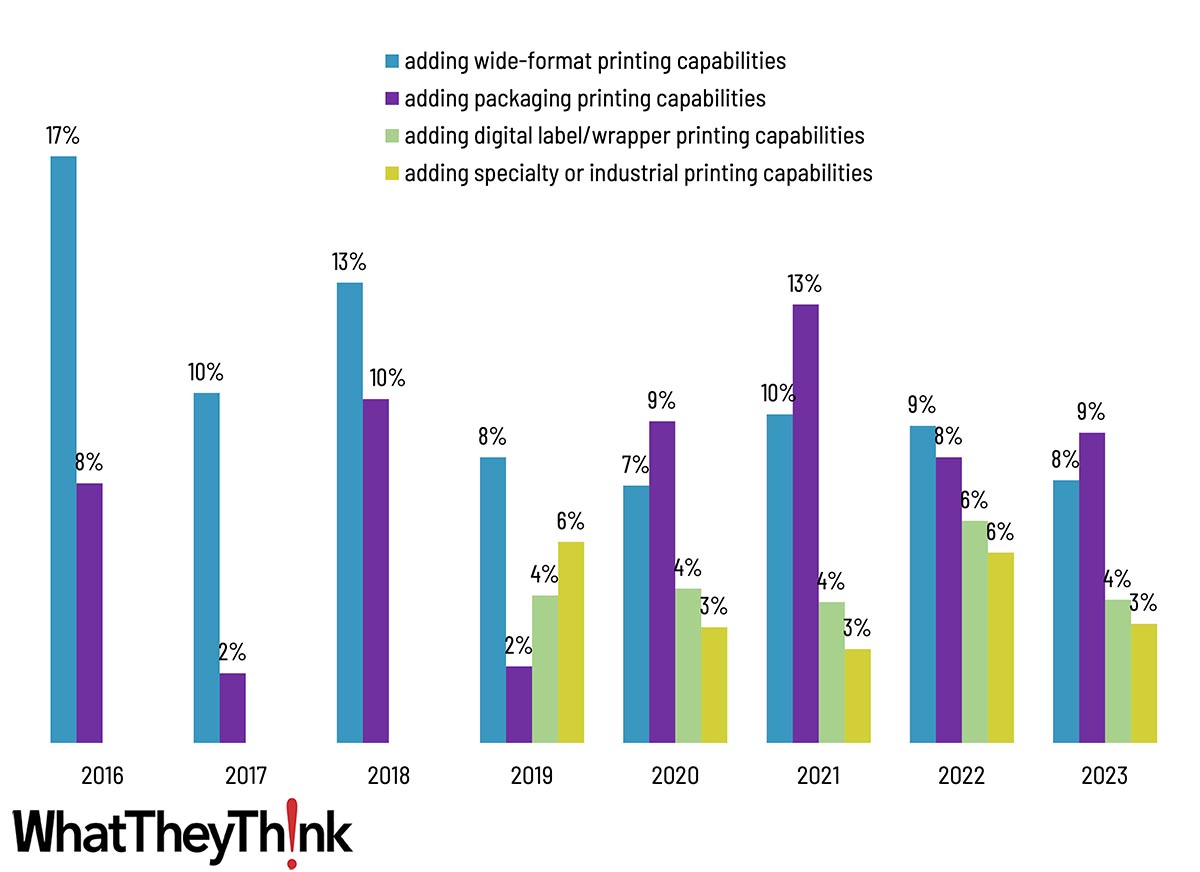
Tales from the Database: Beyond Commercial
Published: April 14, 2023
The latest installment in our “Tales from the Database” series looks at historical opportunities and investments related to adding not only things like wide-format printing and textile printing capabilities, but also packaging as well as other types of specialty printing. Full Analysis
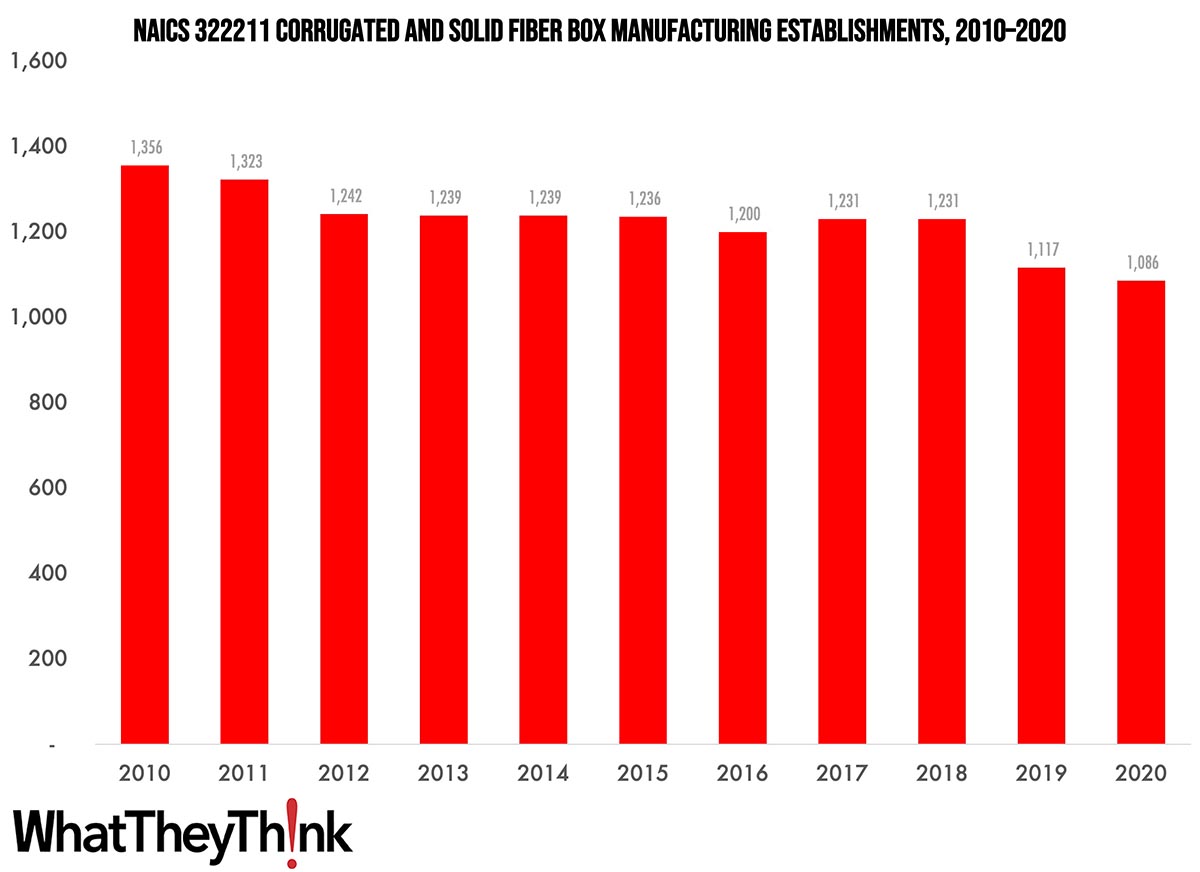
Corrugated and Solid Fiber Box Manufacturing Establishments—2010–2020
Published: March 31, 2023
According to County Business Patterns, in 2020 there were 1,086 establishments in NAICS 322211 (Corrugated and Solid Fiber Box Manufacturing). This category saw a net decrease of 20% since 2010. In macro news, Q4 GDP was revised down. Full Analysis
Kicking Off 2023: Best Shipments Since 2020
Published: March 24, 2023
January 2023 printing shipments came in at $6.67 billion, the best start to a year since 2020. Full Analysis
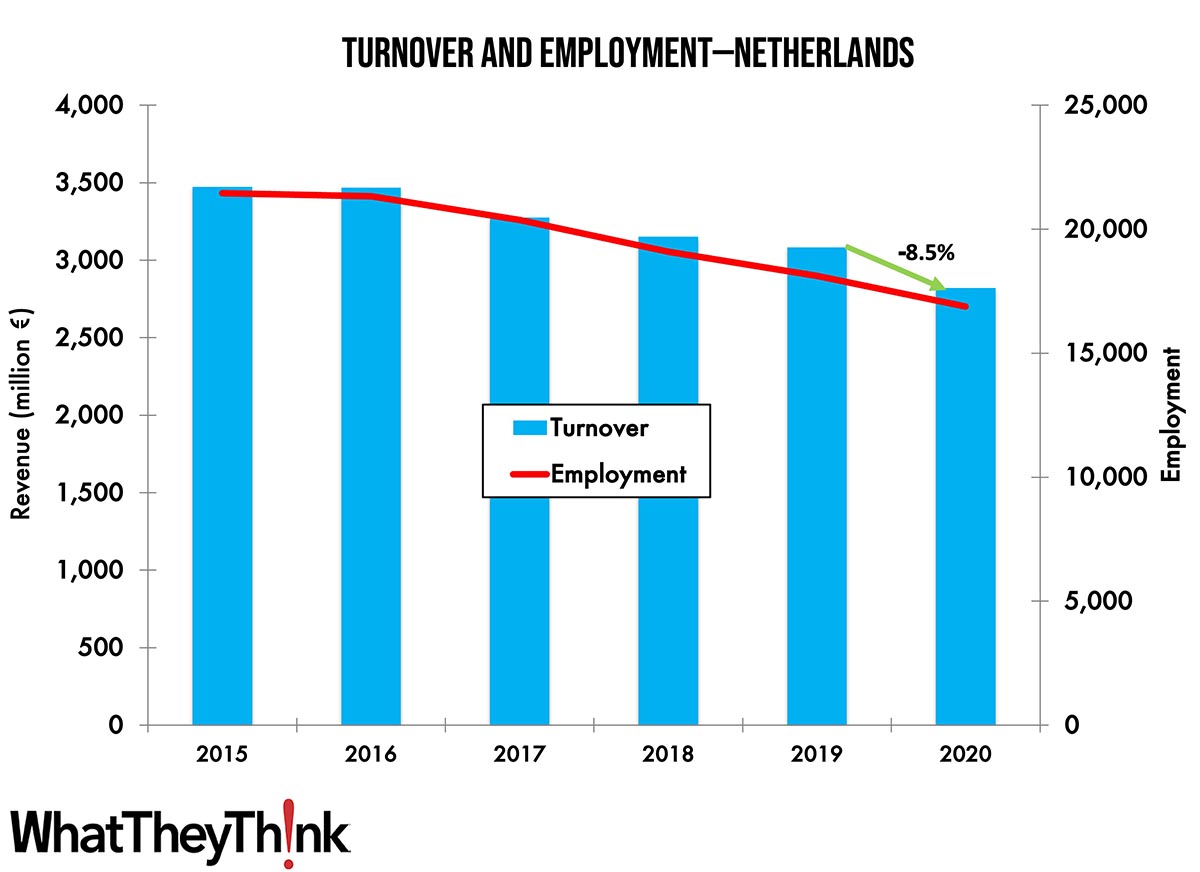
Turnover and Employment in Print in Europe—The Netherlands
Published: March 21, 2023
This bi-weekly series of short articles aims at shedding a spotlight on the size of the printing industry in Europe per country and how revenues and employment developed in 2020, when the pandemic impacted businesses. This time we look at the Netherlands, the seventh largest printing industry by turnover in Europe. Full Analysis
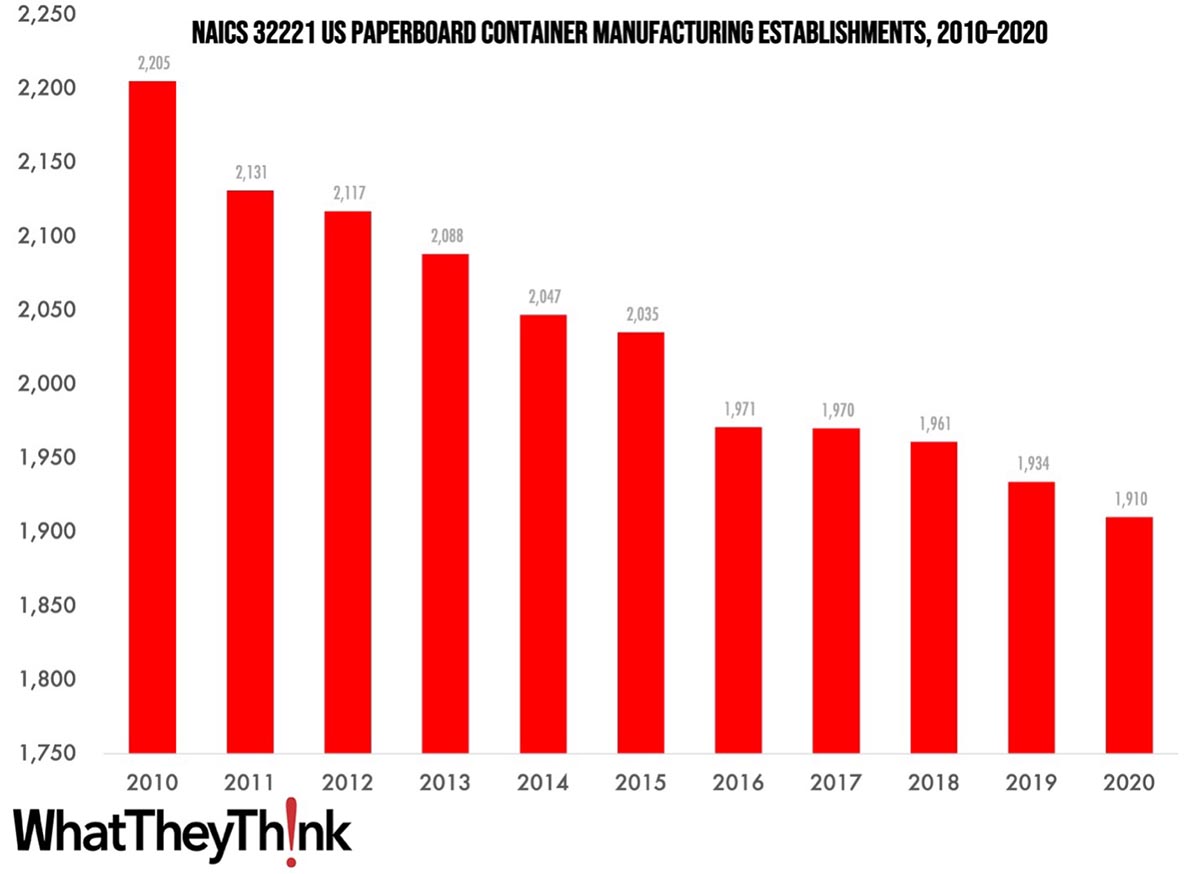
Paperboard Container Manufacturing Establishments—2010–2020
Published: March 17, 2023
According to County Business Patterns, in 2020 there were 1,910 establishments in NAICS 32221 (Paperboard Container Manufacturing). This category saw a net decrease of 13% since 2010. In macro news,inflation is sort of moving sideways. Full Analysis
January Production Employment Down
Published: March 10, 2023
Overall printing employment in January 2023 was down -1.7% from December, due entirely to a -4.2% drop in production employment, as non-production employment was up +4.1%. Full Analysis
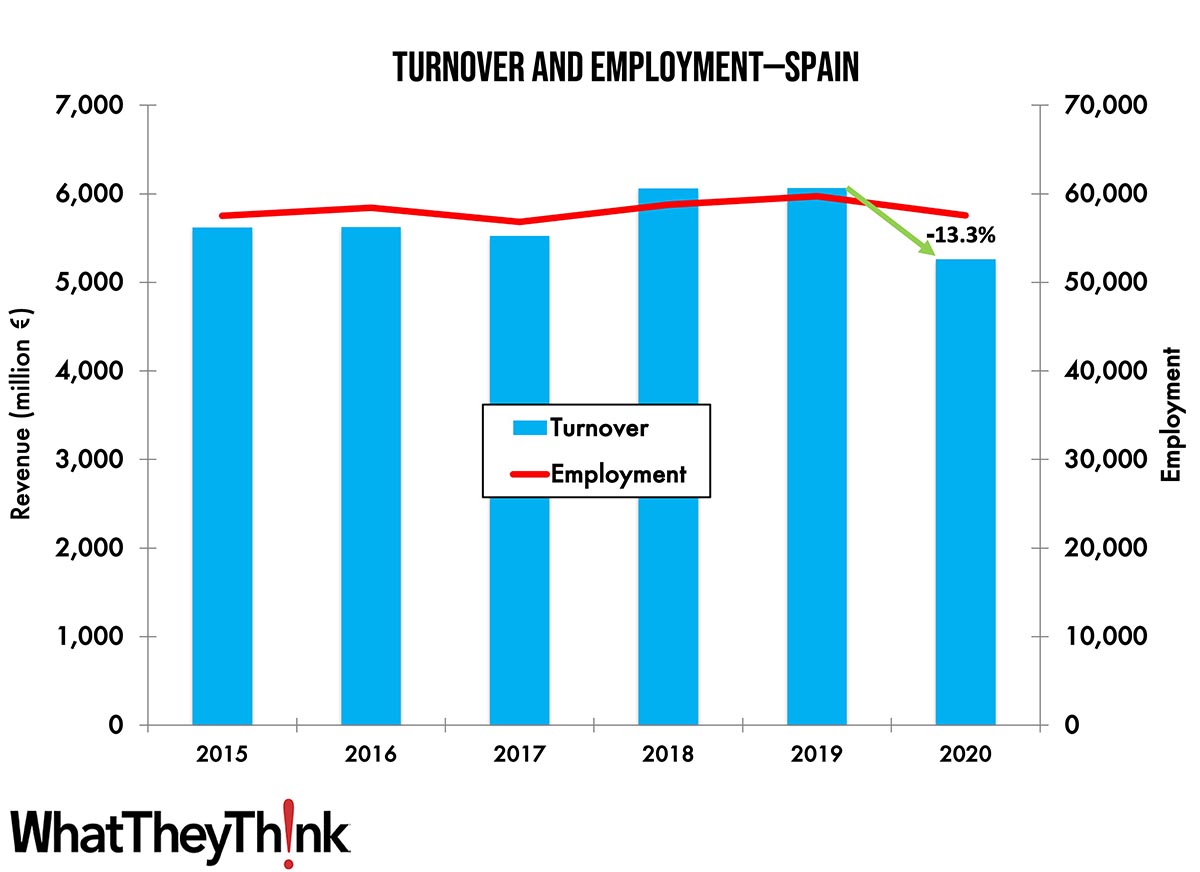
Print Turnover and Employment in Europe—Spain
Published: March 6, 2023
This bi-weekly series of short articles aims at shedding a spotlight on the size of the printing industry in Europe per country and how revenues and employment developed in 2020, when the pandemic impacted businesses. This time we look at Spain, the fifth largest printing industry by turnover in Europe. Full Analysis
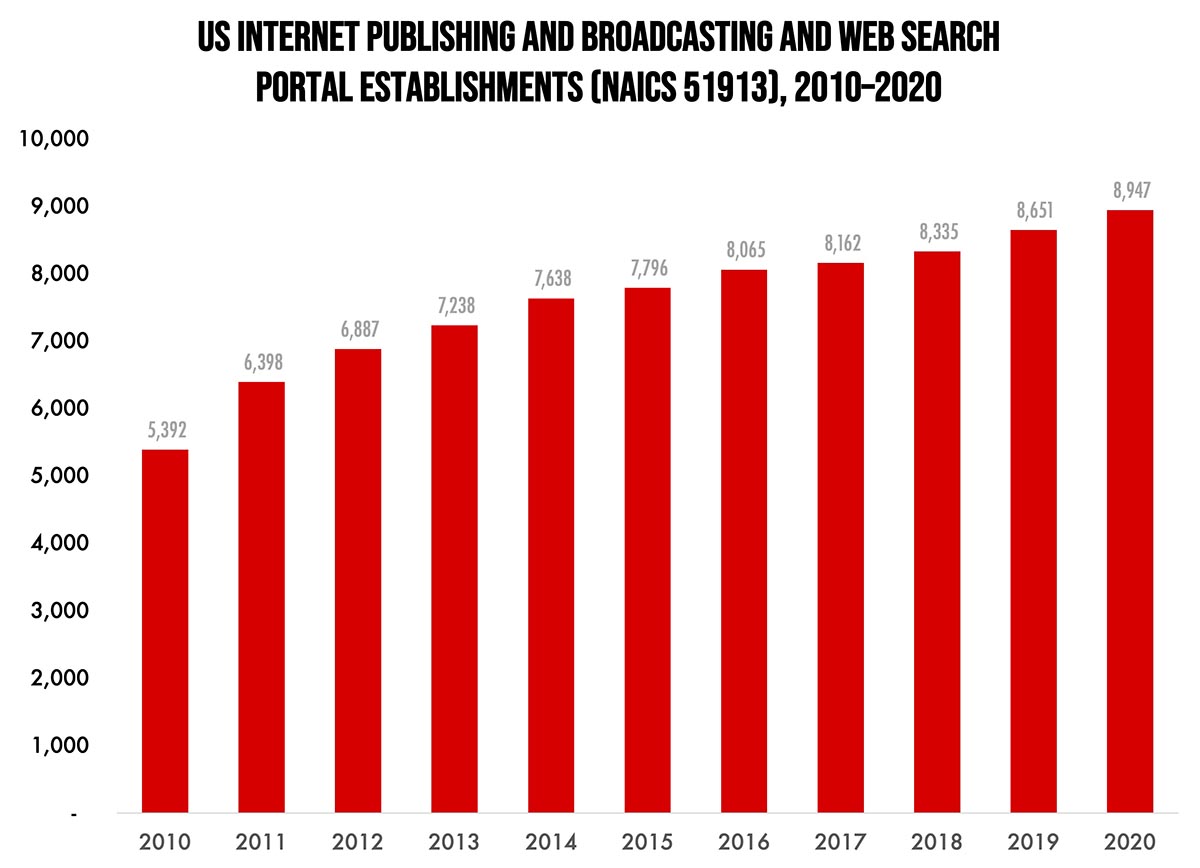
Internet Publishing and Broadcasting and Web Search Portal Establishments—2010–2020
Published: March 3, 2023
According to County Business Patterns, in 2020 there were 8,947 establishments in NAICS 51913 (Internet Publishing and Broadcasting and Web Search Portals). This category saw a net increase of 66% since 2010. In macro news, early forecasts of Q1 GDP are running slightly bearish to slightly bullish. Full Analysis
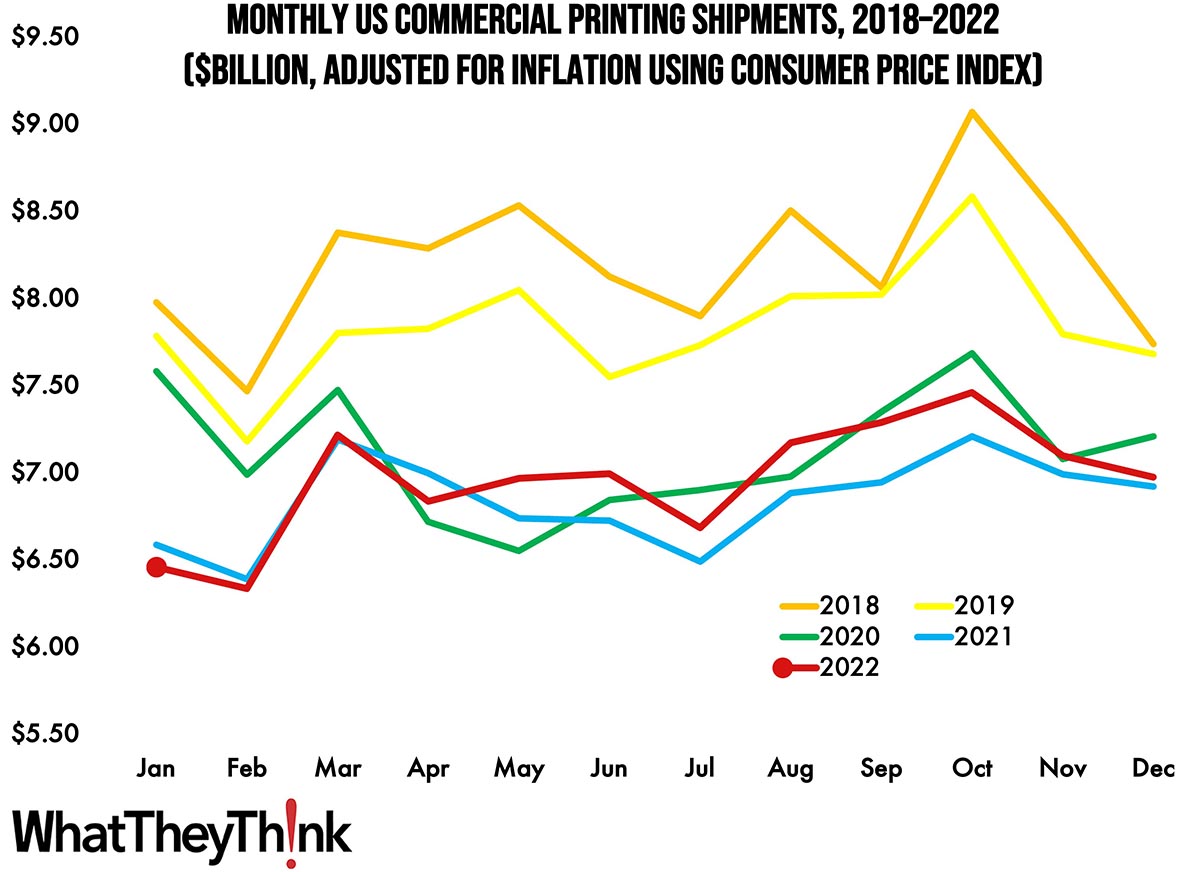
Hooray! 2022 Shipments Outpaced 2021
Published: February 24, 2023
December 2022 printing shipments came in at $6.97 billion, down from November’s $7.10 billion. But January-to-December shipments for 2022 came in at $83.47 billion, an improvement over 2021’s $82.05 billion. Full Analysis
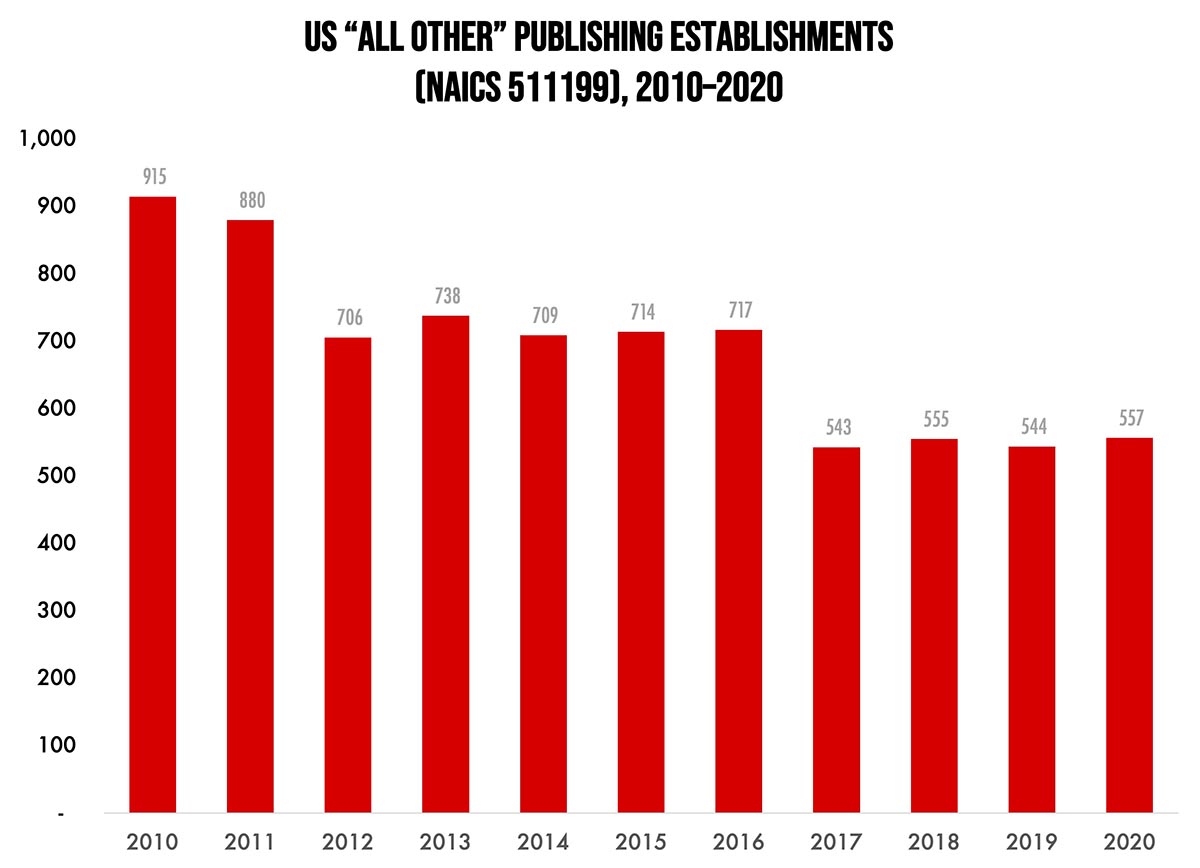
Assorted Publishing Establishments—2010–2020
Published: February 17, 2023
According to County Business Patterns, in 2020 there were 557 establishments in NAICS 511199 (All Other Publishing). This category saw a net decrease of 39% since 2010, , although we’re not talking about a tremendous number of establishments. In macro news, inflation appears to have peaked. Full Analysis
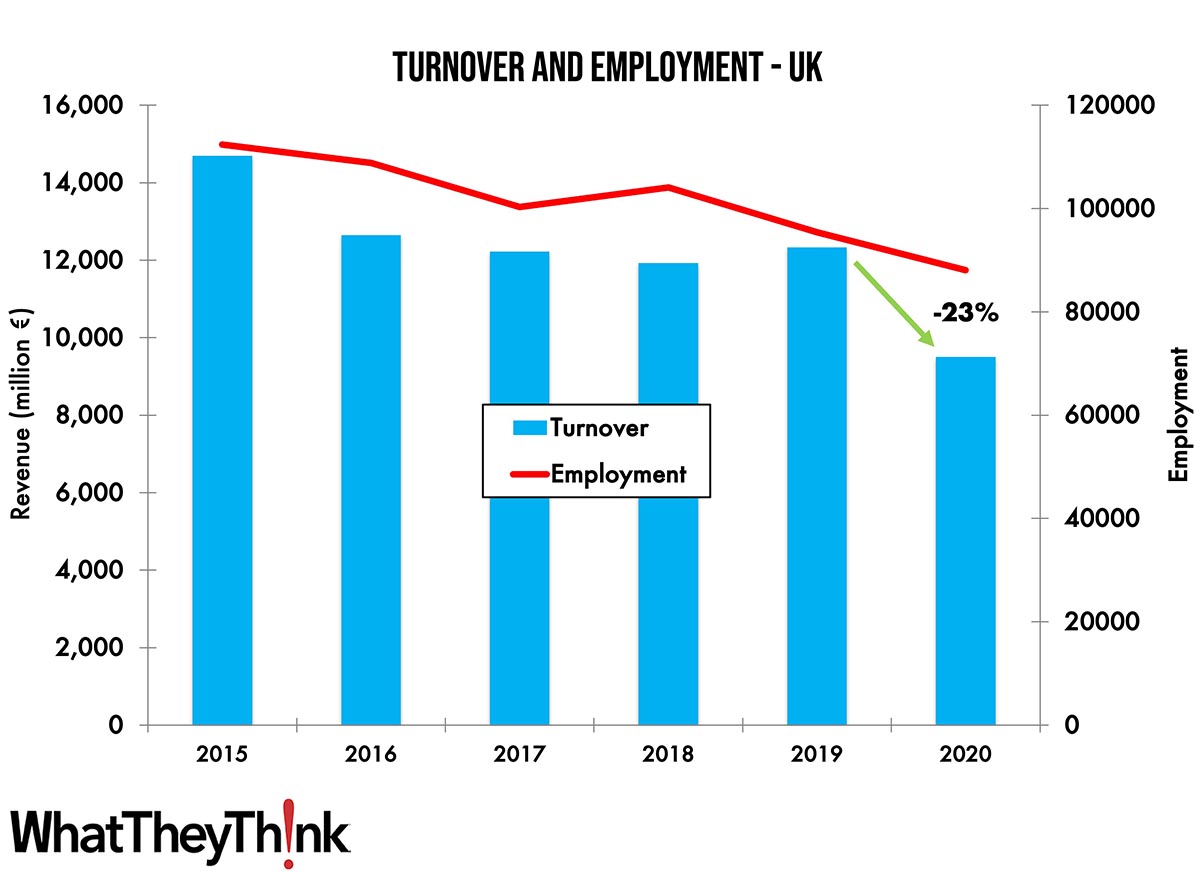
Turnover and Employment in Print in Europe—UK
Published: February 14, 2023
This bi-weekly series of short articles aims at shedding a spotlight on the size of the printing industry in Europe per country and how revenues and employment developed in 2020, when the pandemic impacted businesses. This time we look at the UK, the second-largest printing industry by turnover in Europe. Full Analysis
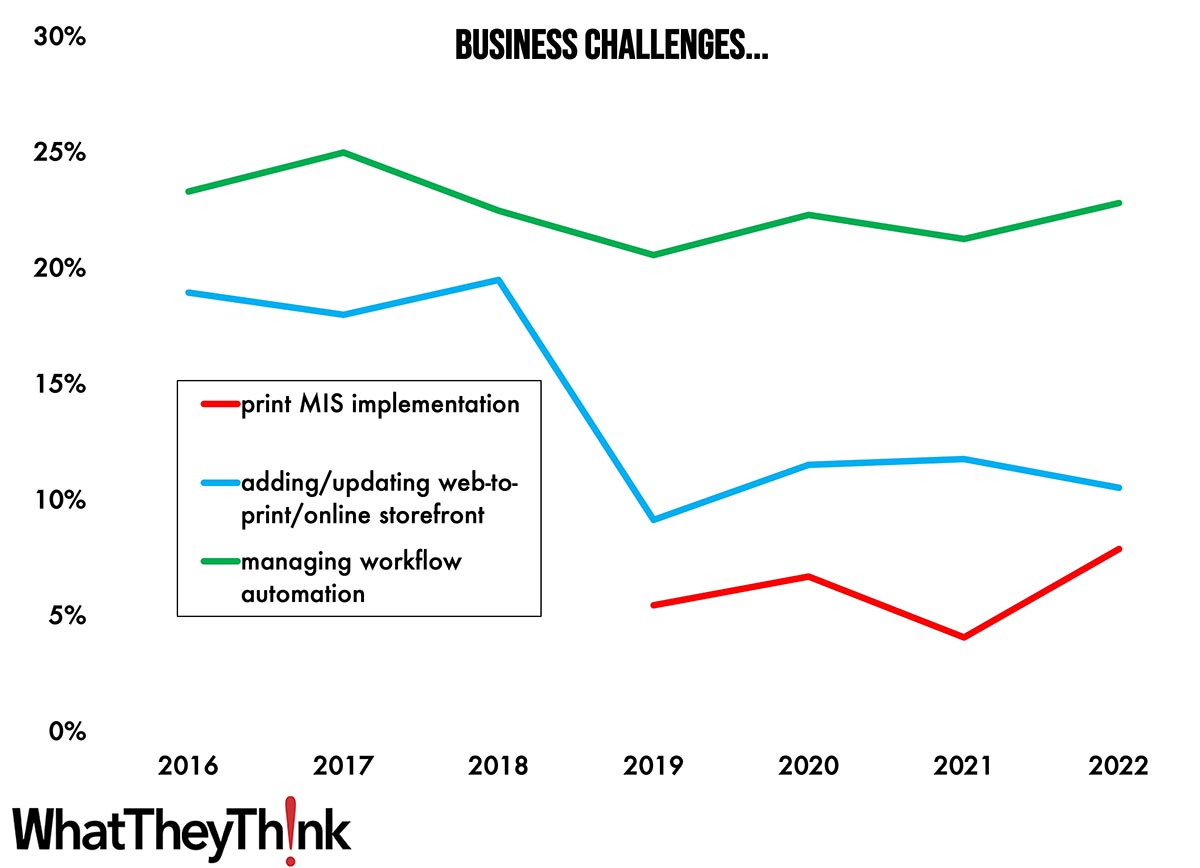
Tales from the Database: Software
Published: February 10, 2023
In our January/February 2023 print edition, we are launching a new series called “Tales from the Database,” drawing on six years’ worth of Print Business Outlook surveys. In every survey, we ask a broad cross-section of print businesses about business conditions, business challenges, new business opportunities, and planned investments. January/February is the software issue, so we rounded up a few software-related challenges, opportunities, and investments to see what the historical data can tell us. Full Analysis
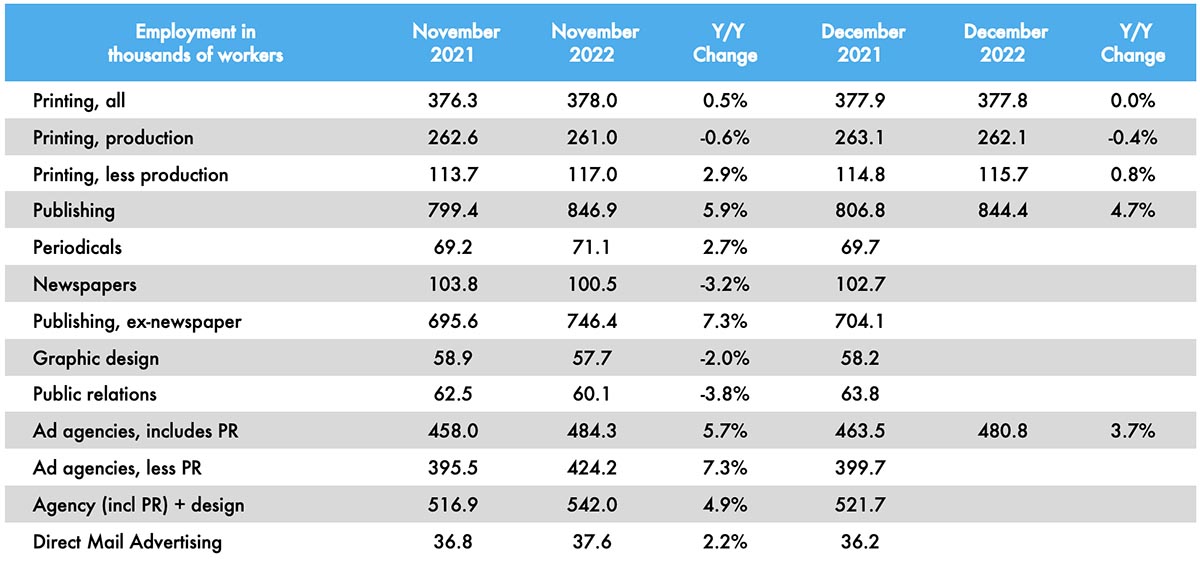
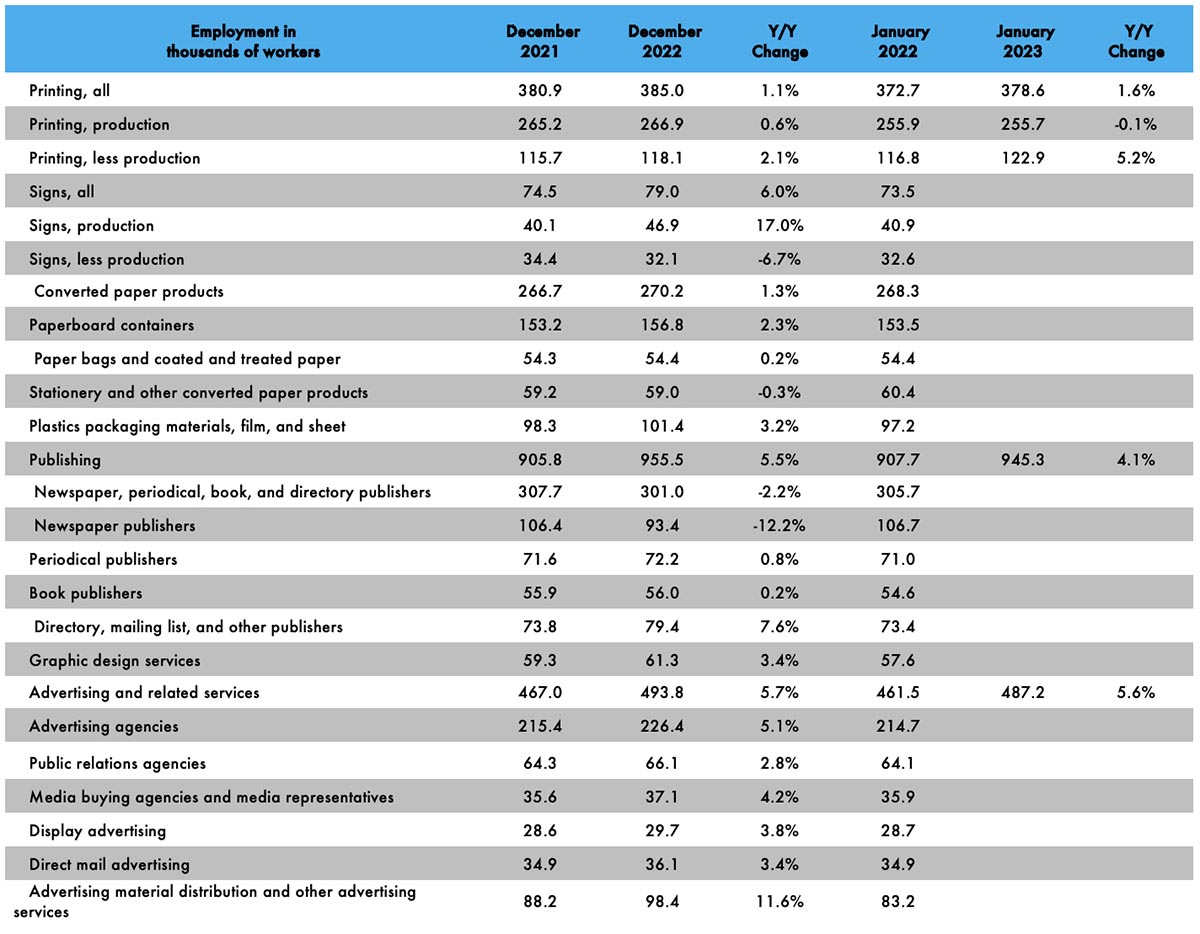
Graphic Arts Employment Flat or Declining in December
Published: February 3, 2023
Overall printing employment was essentially flat in December 2022, being down -0.1% from November, and essentially unchanged from December 2021. Production employment was up +0.4% while non-production employment was down -1.1% from November. Full Analysis
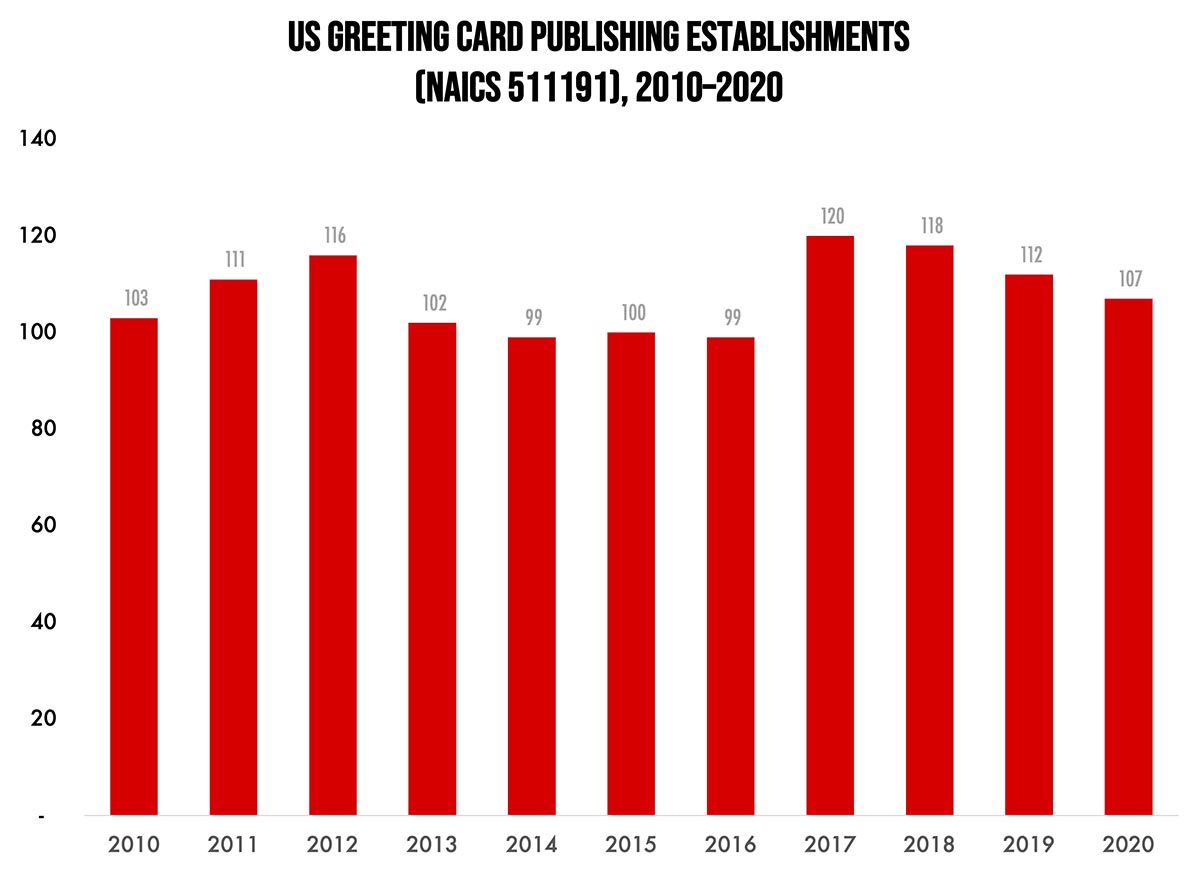
Greeting Card Publishing Establishments—2010–2020
Published: January 27, 2023
According to County Business Patterns, in 2020 there were 107 establishments in NAICS 511191 (Greeting Card Publishing). Although this represents a net increase of 4% since 2010, it has been a category that has ebbed and flowed over the course of the decade, although we’re not talking about a tremendous number of establishments. In macro news, real GDP increased 2.9% annualized in Q4. Full Analysis
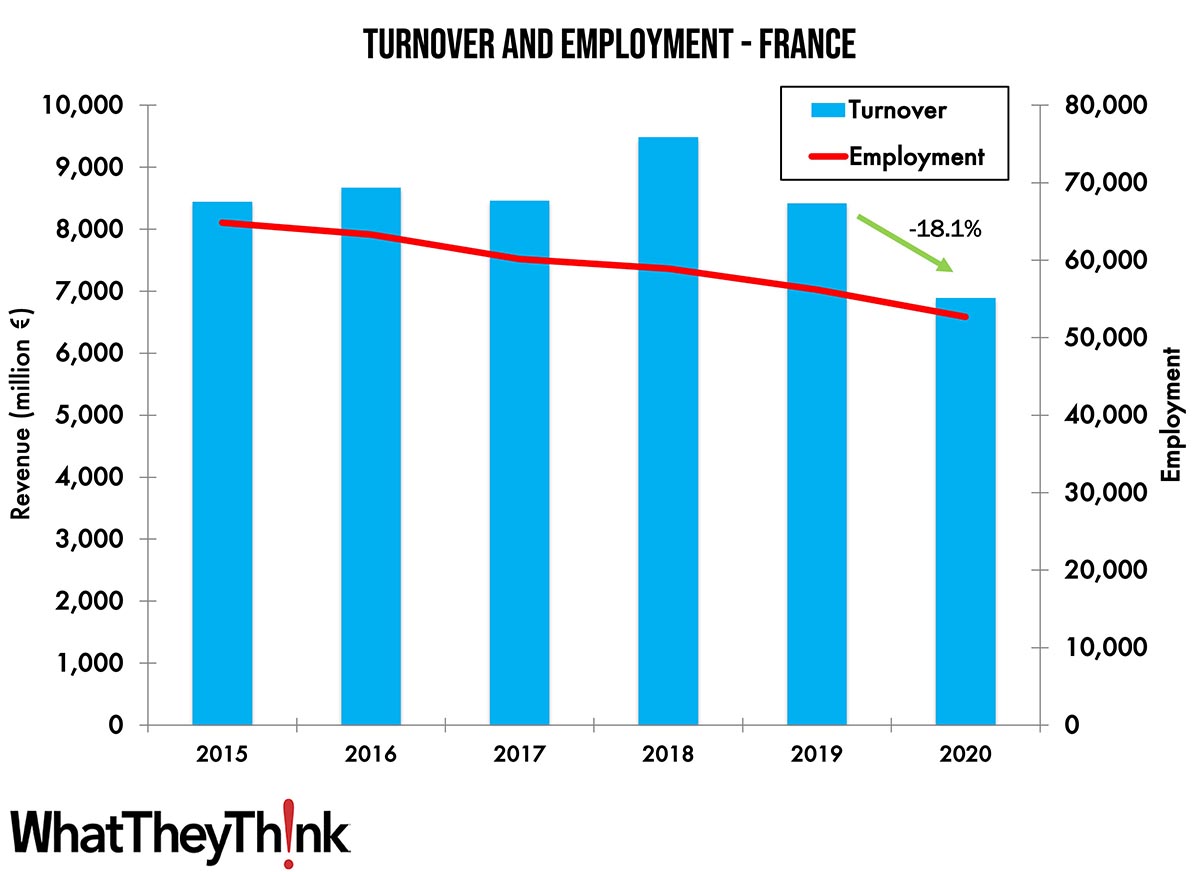
Turnover and Employment in Print in Europe—France
Published: January 24, 2023
This bi-weekly series of short articles aims at shedding a spotlight on the size of the printing industry in Europe per country and how revenues and employment developed in 2020, when the pandemic impacted the businesses. This time we look at France, the fourth-largest printing industry by turnover in Europe. Full Analysis
November 2022 Shipments Drop—But That’s Normal!
Published: January 20, 2023
November 2022 shipments came in at $7.16 billion, down from the year’s high of $7.48 billion in October. This should not be cause for concern, as business always drops in November and December as things slow down for the holidays. Full Analysis
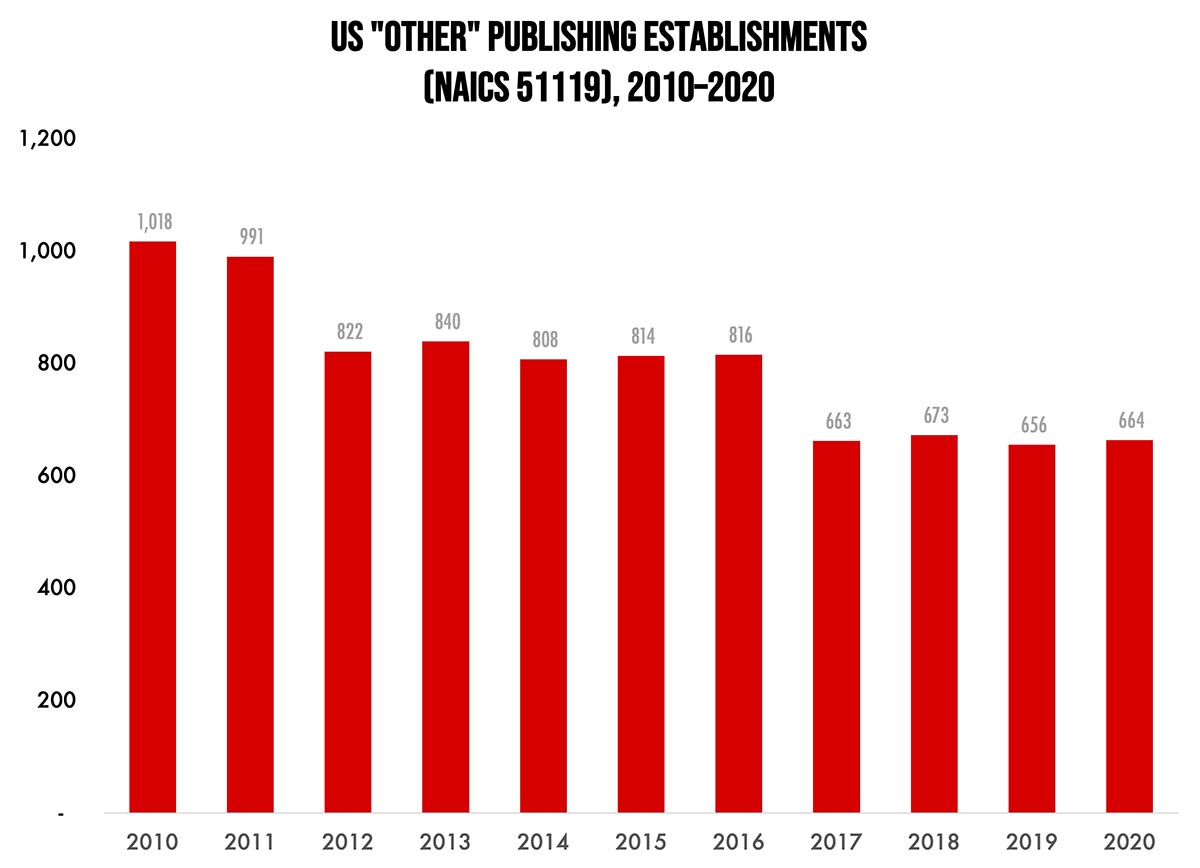
Other Publishing Establishments—2010–2020
Published: January 13, 2023
According to County Business Patterns, in 2020 there were 664 establishments in NAICS 51119 (Other Publishing). This represents a decrease of 35% since 2010. In macro news, what’s behind the employee shortages? Full Analysis
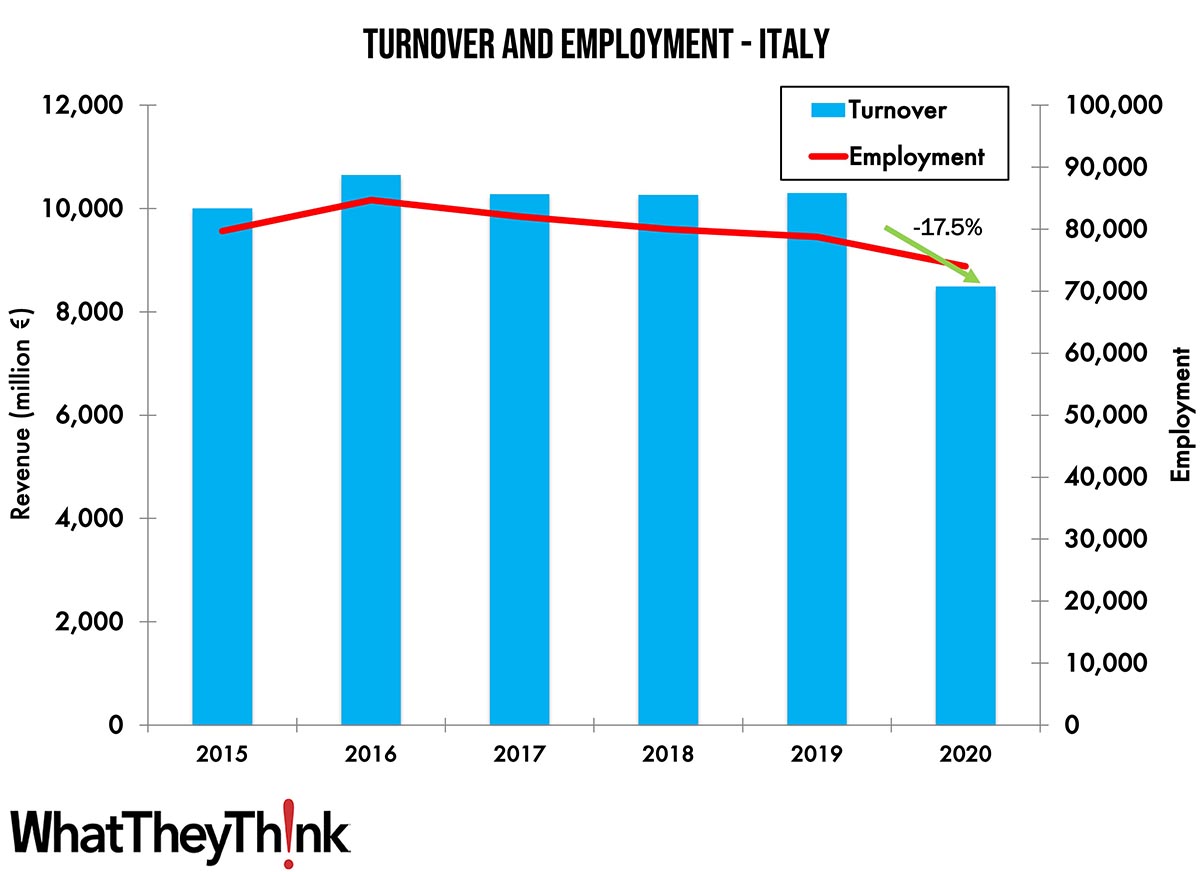
Turnover and Employment in Print in Europe—Italy
Published: January 10, 2023
This bi-weekly series of short articles aims at shedding a spotlight on the size of the printing industry in Europe per country and how revenues and employment developed in 2020, when the pandemic hit the market. This time we look at Italy, the third-largest printing industry by turnover in Europe. Full Analysis
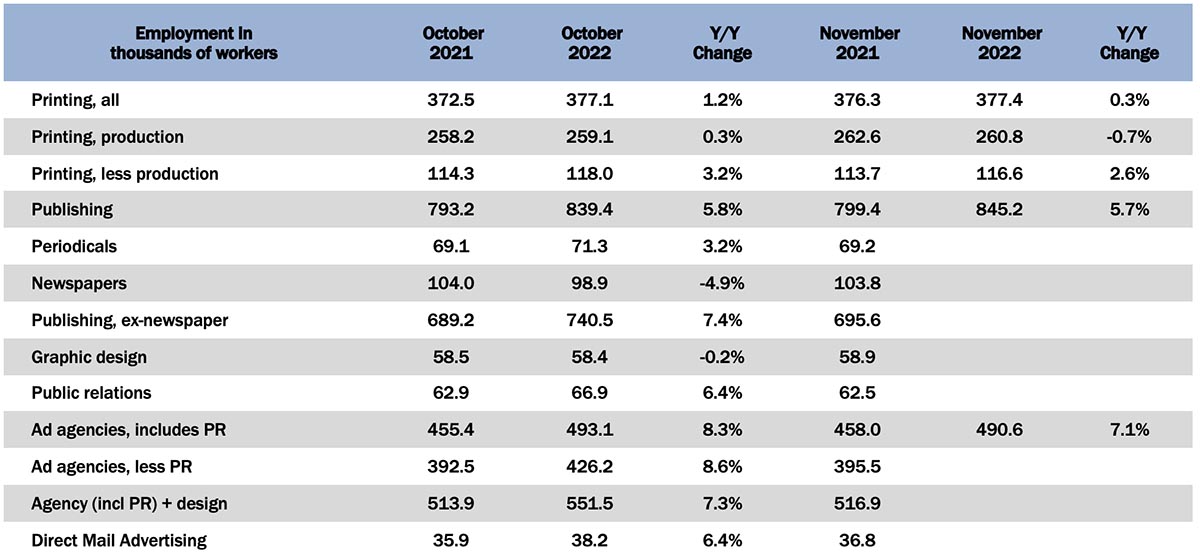
Graphic Arts Employment Essentially Flat in November
Published: January 6, 2023
In November 2022, all printing employment was up +0.1% from October. Production employment was up +0.7% and non-production employment was down -1.2%. Full Analysis
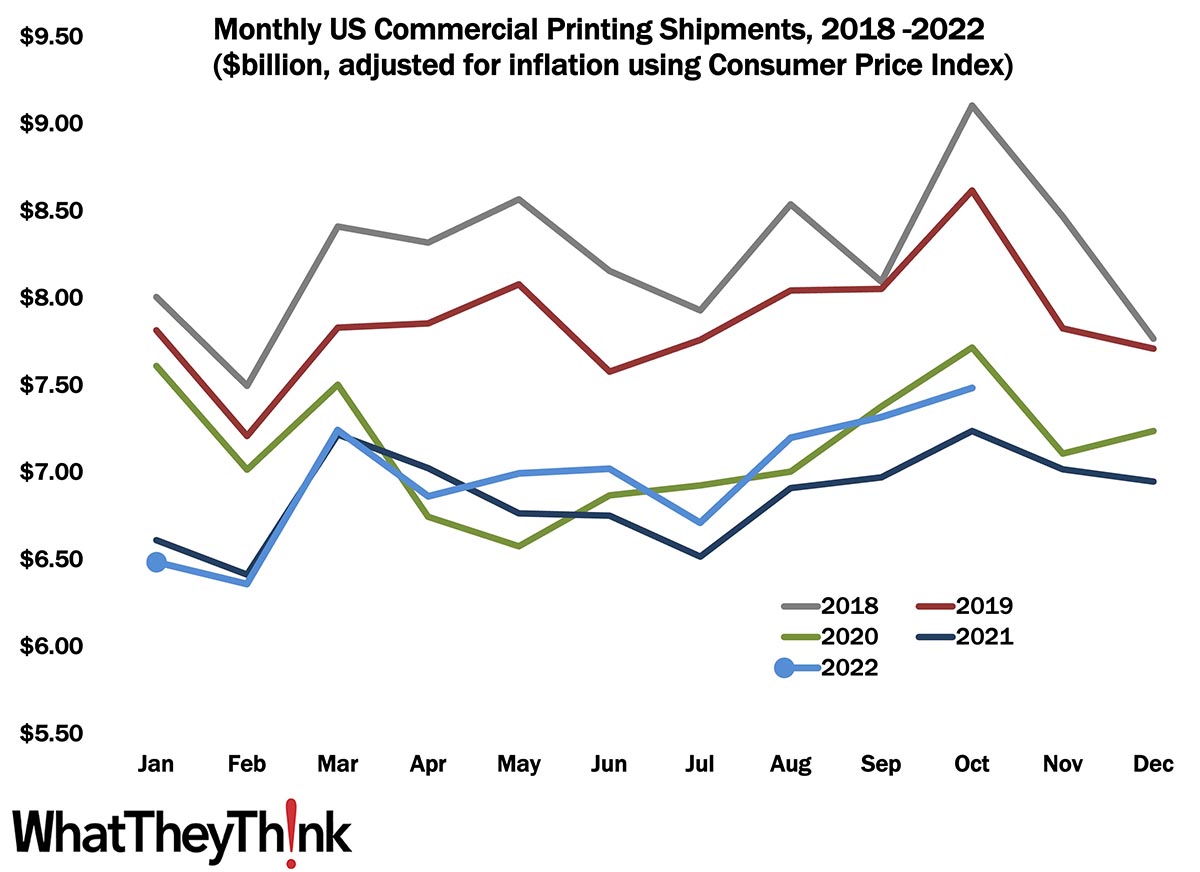
Have a Little Holiday Cheer/October Shipments the Highest All Year
Published: December 16, 2022
October 2022 shipments came in at $7.48 billion, up from September’s $7.32 billion—the best month of the year for the industry. Full Analysis
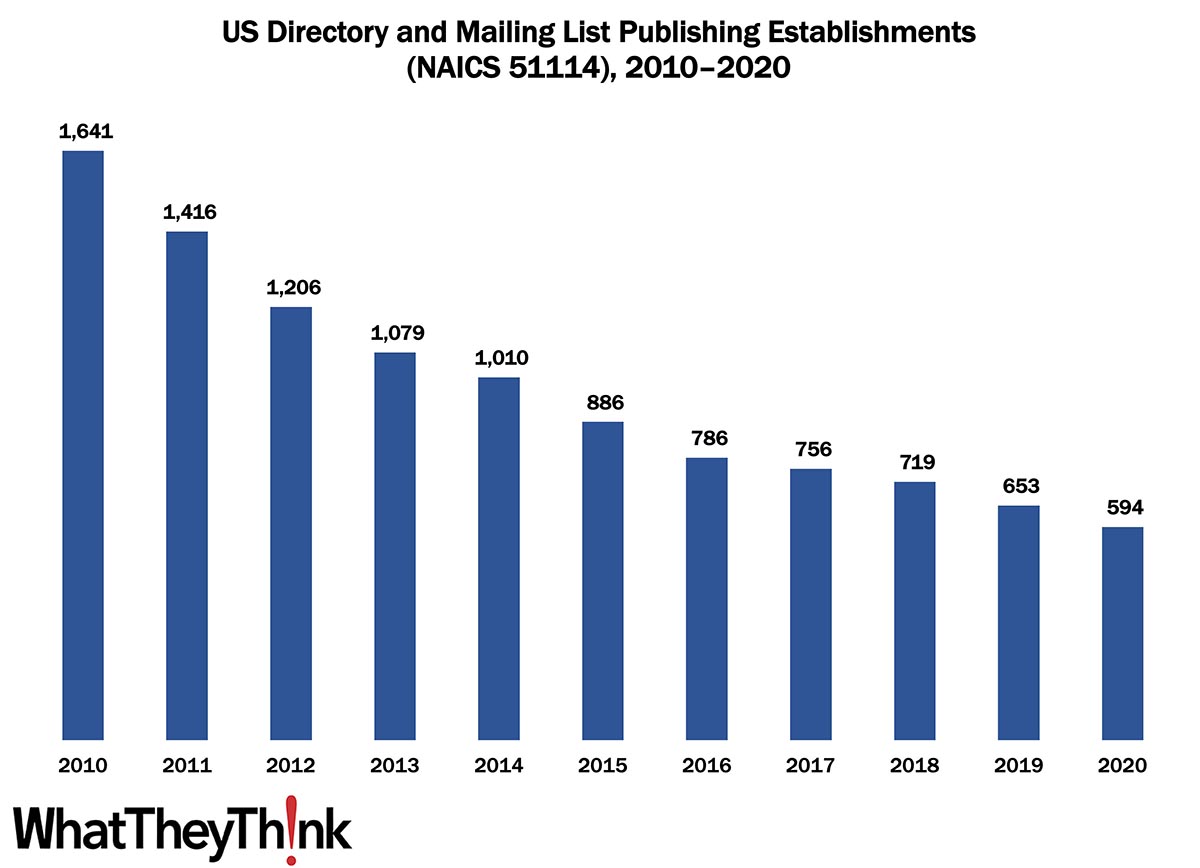
Directory and Mailing List Publishing Establishments—2010–2020
Published: December 9, 2022
According to the latest edition of County Business Patterns, in 2020 there were 594 establishments in NAICS 51114 (Directory and Mailing List Publishers). This represents a decrease of 64% since 2010. In macro news, estimates for Q4 GDP are in the +1.4%–3.4% range. Full Analysis
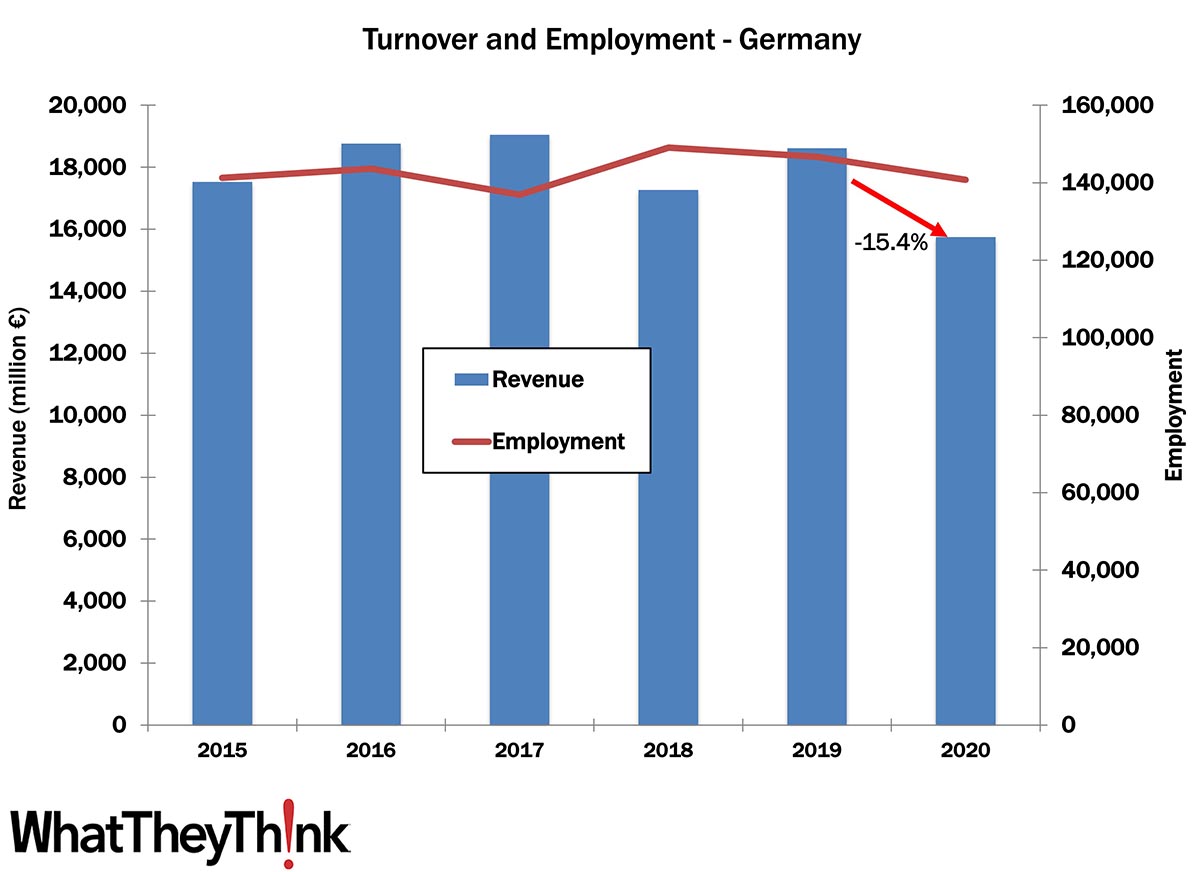
Turnover and Employment in Print in Europe—Germany
Published: December 6, 2022
This bi-weekly series of short articles aims at shedding a spotlight on the size of the printing industry in Europe per country and how revenues and employment developed in 2020, when the pandemic hit the market. Kicking off the series is Germany, the largest printing industry by turnover in Europe. Full Analysis
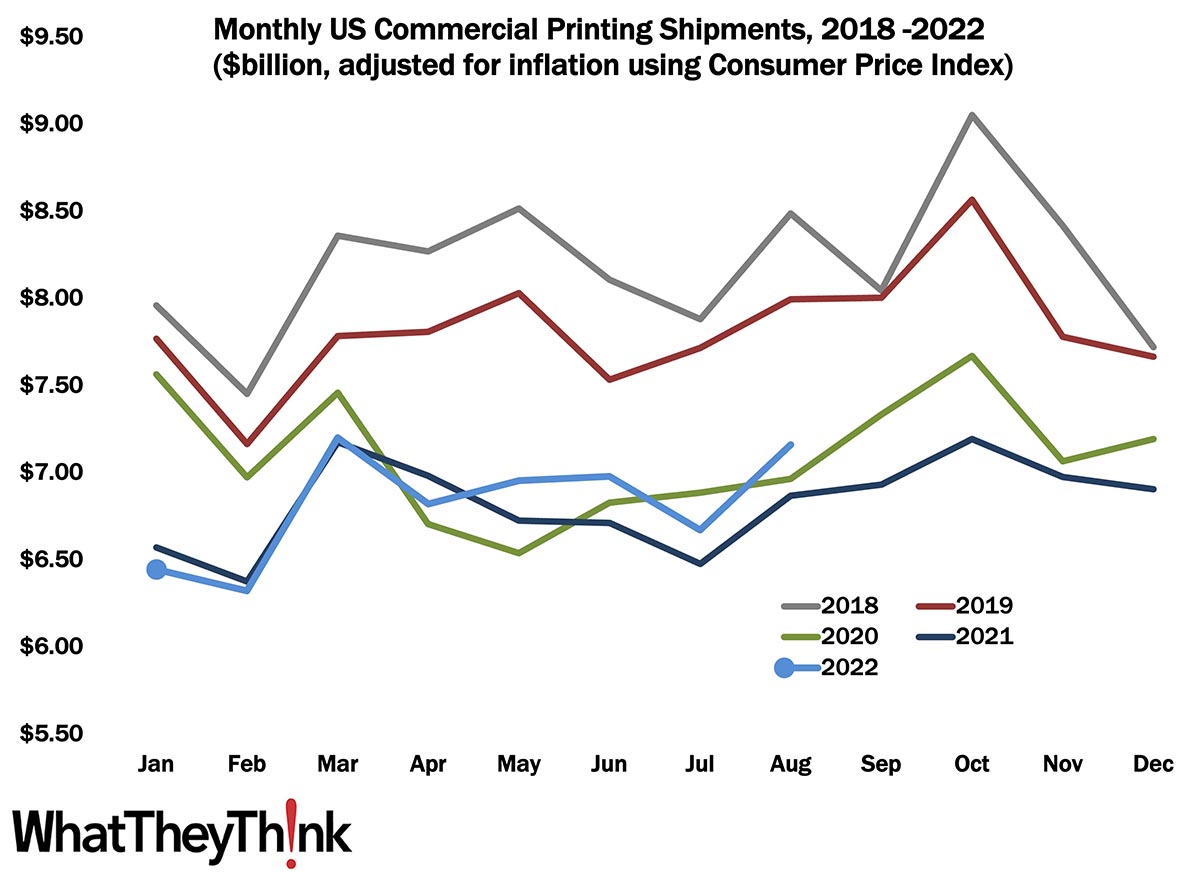
September Printing Shipments—The High Before the Holidays
Published: December 2, 2022
September 2022 shipments came in at $7.20 billion, up a little from August’s $7.17 billion—reflecting a return to the industry’s regular seasonality. Could we be back to normal? Full Analysis
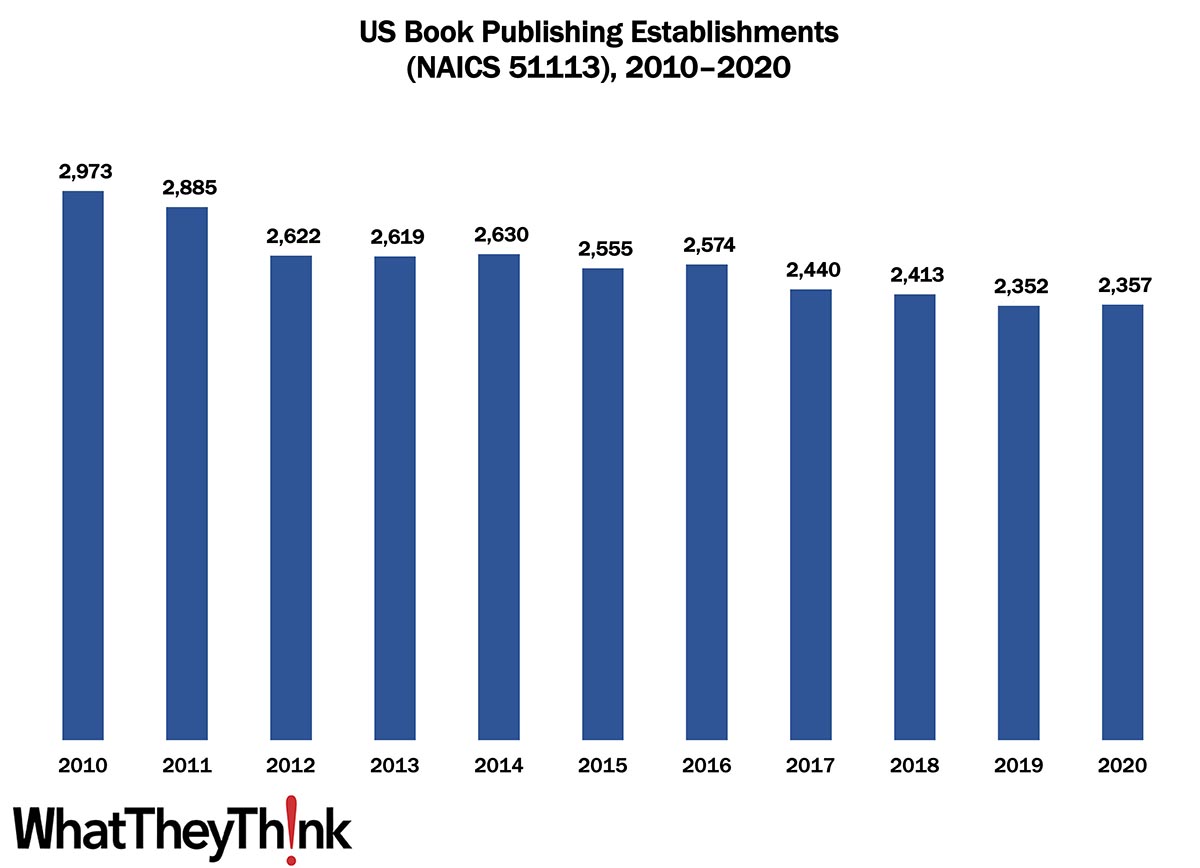
Book Publishing Establishments—2010–2020
Published: November 18, 2022
According to the latest edition of County Business Patterns, in 2020 there were 2,357 establishments in NAICS 51113 (Book Publishing). This represents a decrease of 21% since 2010. In macro news, October retail sales were up. Full Analysis
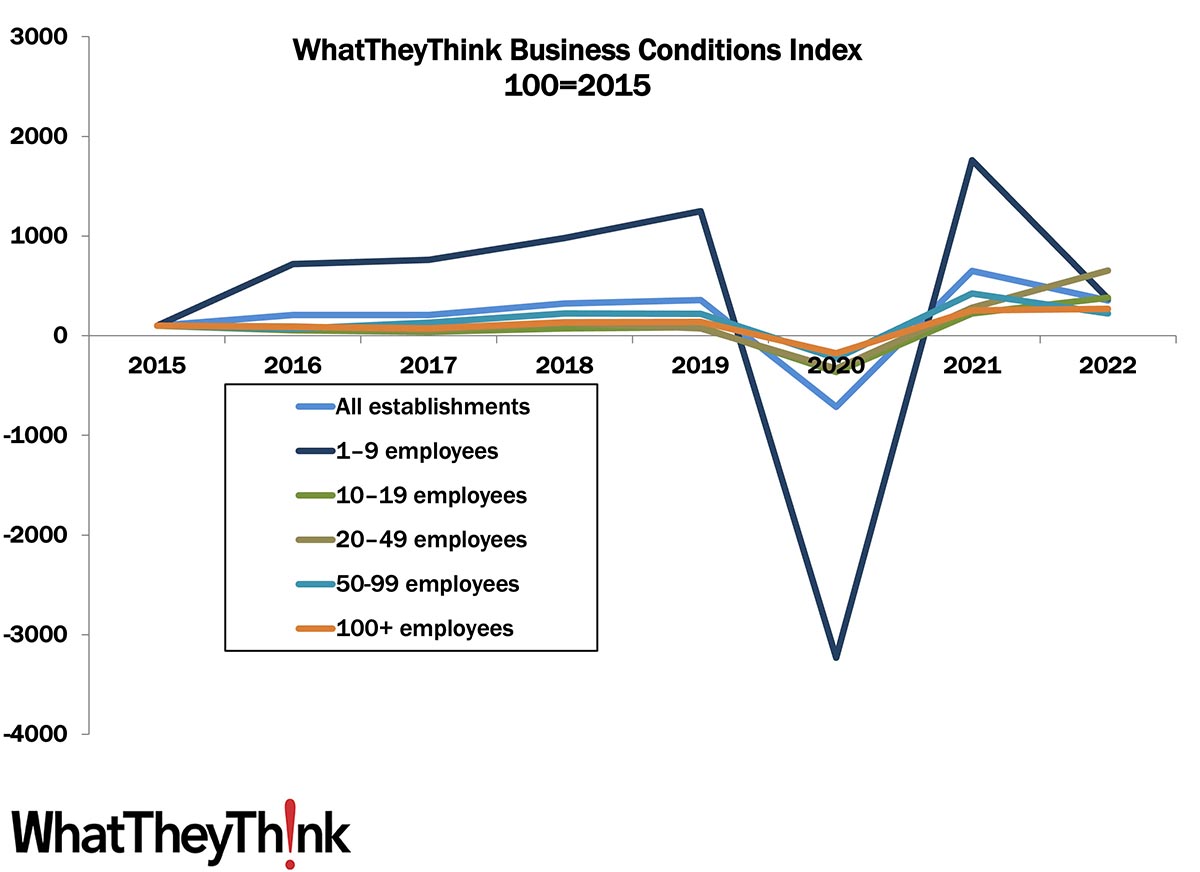
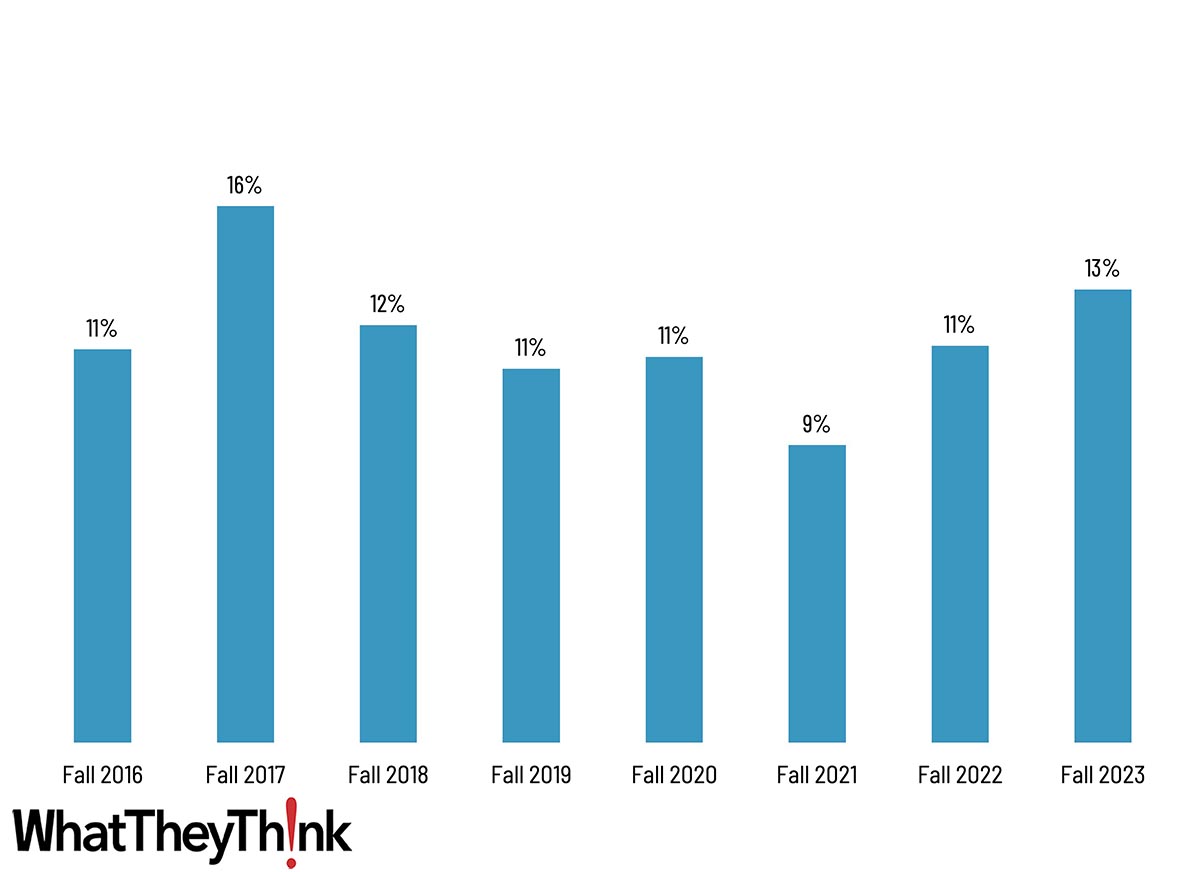
Printing Outlook 2023 Sneak Peek: Business Conditions Slipped in 2022
Published: November 11, 2022
Our preliminary Fall Print Business Survey results are in and our Business Conditions Index dropped slightly from 2021. Last year marked a rebound from the plummeting conditions in 2020, and 2022 likely represents a move toward stability. Full Analysis
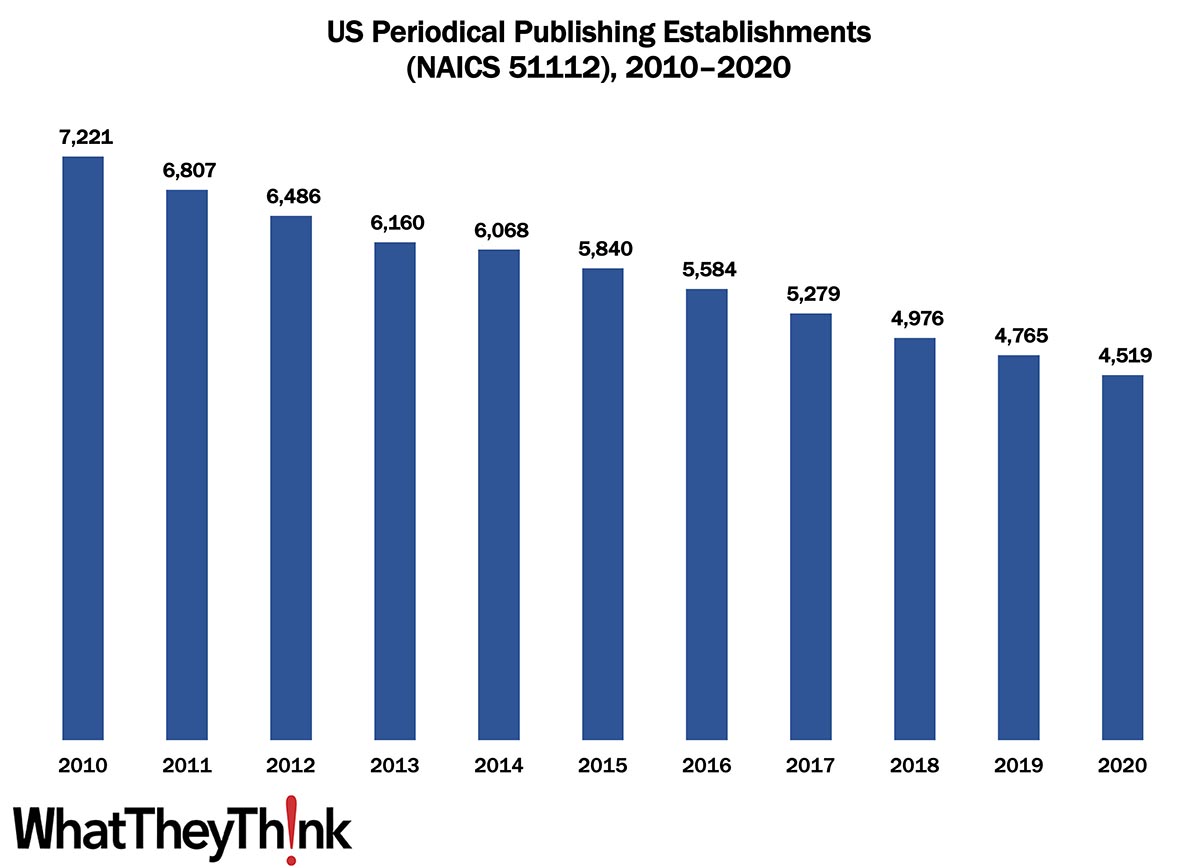
Periodical Publishing Establishments—2010–2020
Published: November 4, 2022
According to the latest edition of County Business Patterns, in 2020 there were 4,519 establishments in NAICS 51112 (Periodical Publishing). This represents a decrease of 37% since 2010. In macro news, actual Q3 GDP was strong. Full Analysis
Graphic Arts Employment Down Slightly in September
Published: October 28, 2022
In September 2022, all printing employment was down -1.3% from August. Production employment was down -1.9% and non-production employment was down -0.1%. Full Analysis
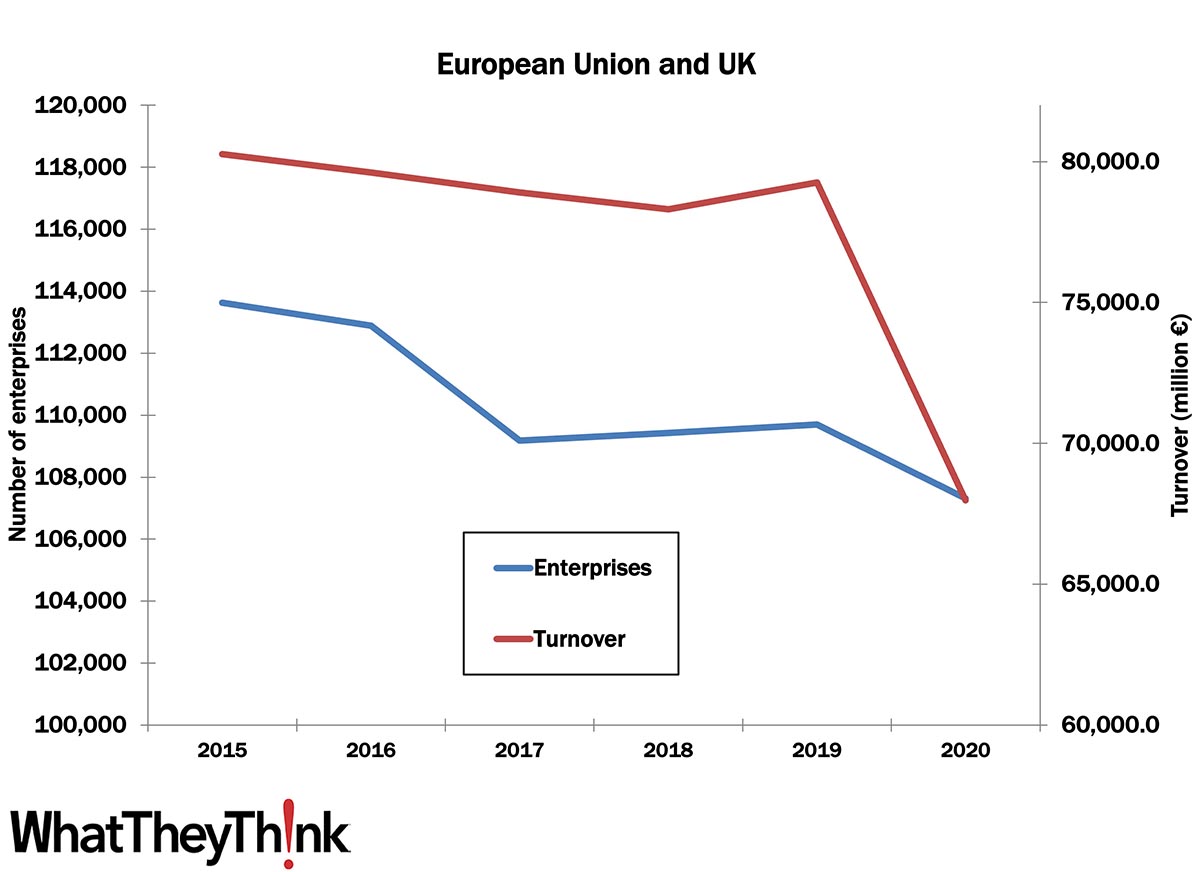
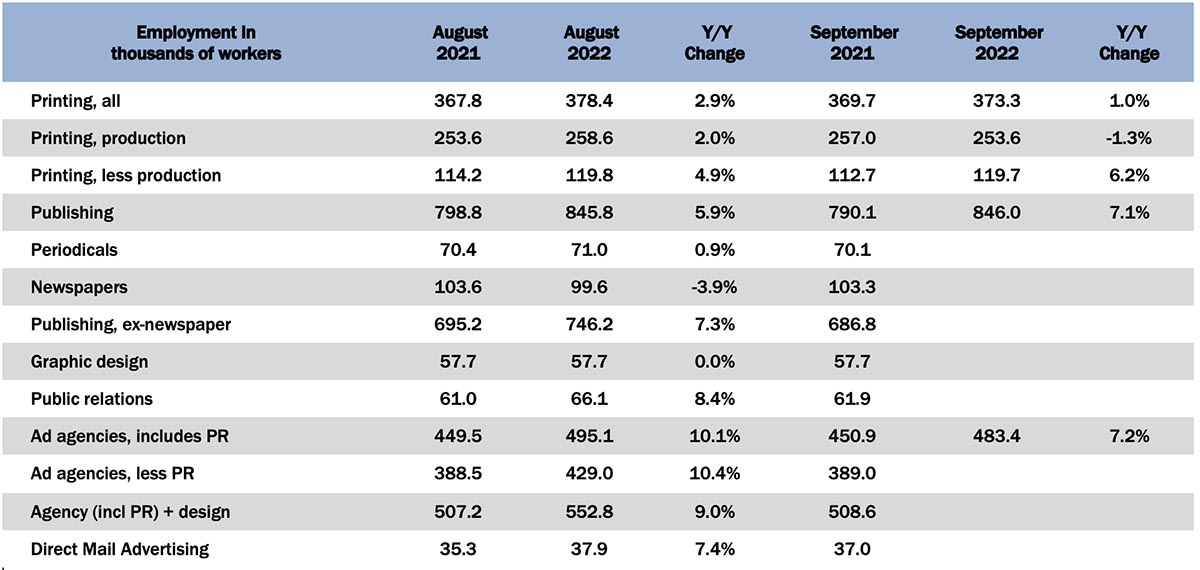
Sizing the European Printing Industry
Published: October 25, 2022
European section editor Ralf Schlözer rounds up the latest data on European and UK printing industry establishments, revenues, and production volumes. Full Analysis
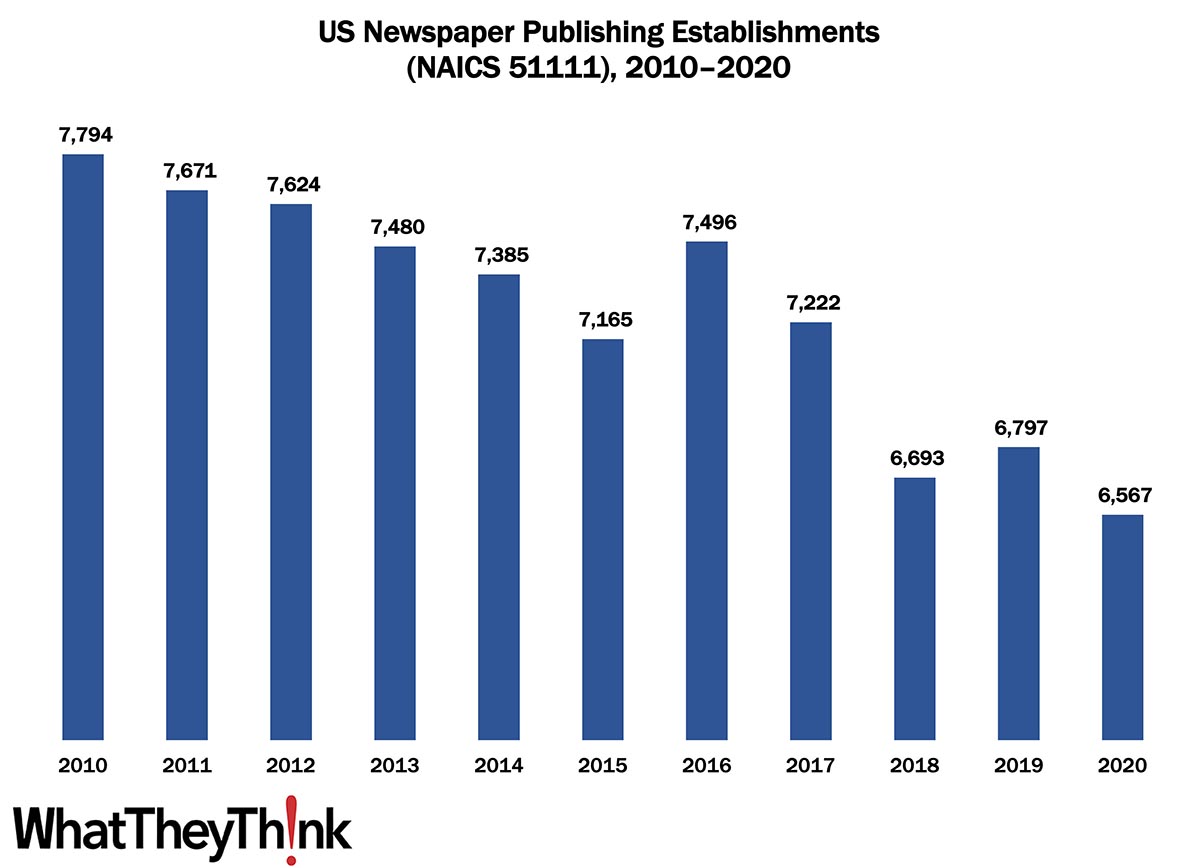
Newspaper Publishing Establishments—2010–2020
Published: October 21, 2022
According to the latest, recently released edition of County Business Patterns, in 2020 there were 6,567 establishments in NAICS 51111 (Newspaper Publishing). This represents a decrease of 16% since 2010. In macro news, early estimates of Q3 GDP getting more bullish. Full Analysis
August August Printing Shipments
Published: October 14, 2022
August 2022 shipments came in at $7.16 billion, up quite a bit from July’s $6.67 billion—august business conditions indeed, and reflecting a return to the industry’s regular seasonality. Full Analysis
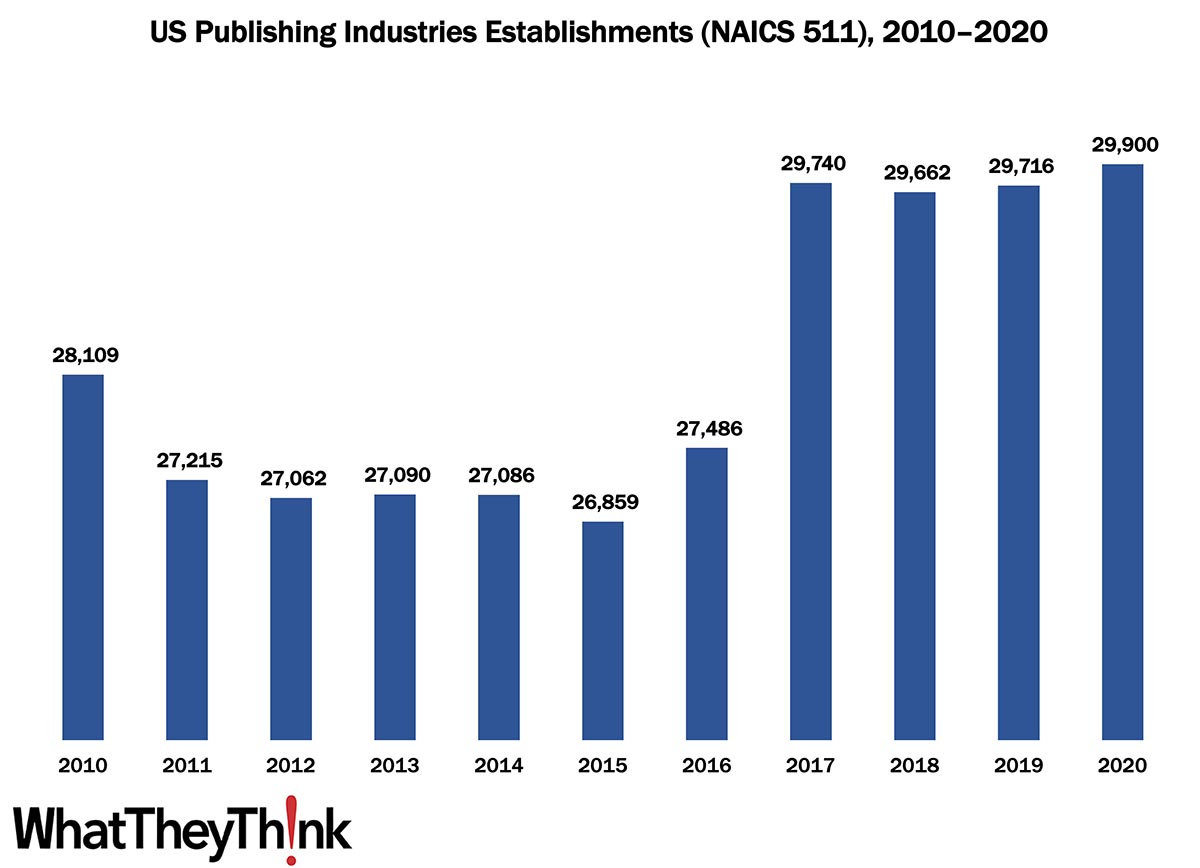
Publishing Establishments—2010–2020
Published: October 7, 2022
According to the latest, recently released edition of County Business Patterns, in 2020 there were 29,900 establishments in NAICS 511 (Publishing Industries [except Internet]). This represents an increase of 6% since 2010 and increase of 9% since 2016. In macro news, job openings were down 1.1 million in August while hires and separations (quits, dismissals, and layoffs) were generally unchanged. Full Analysis
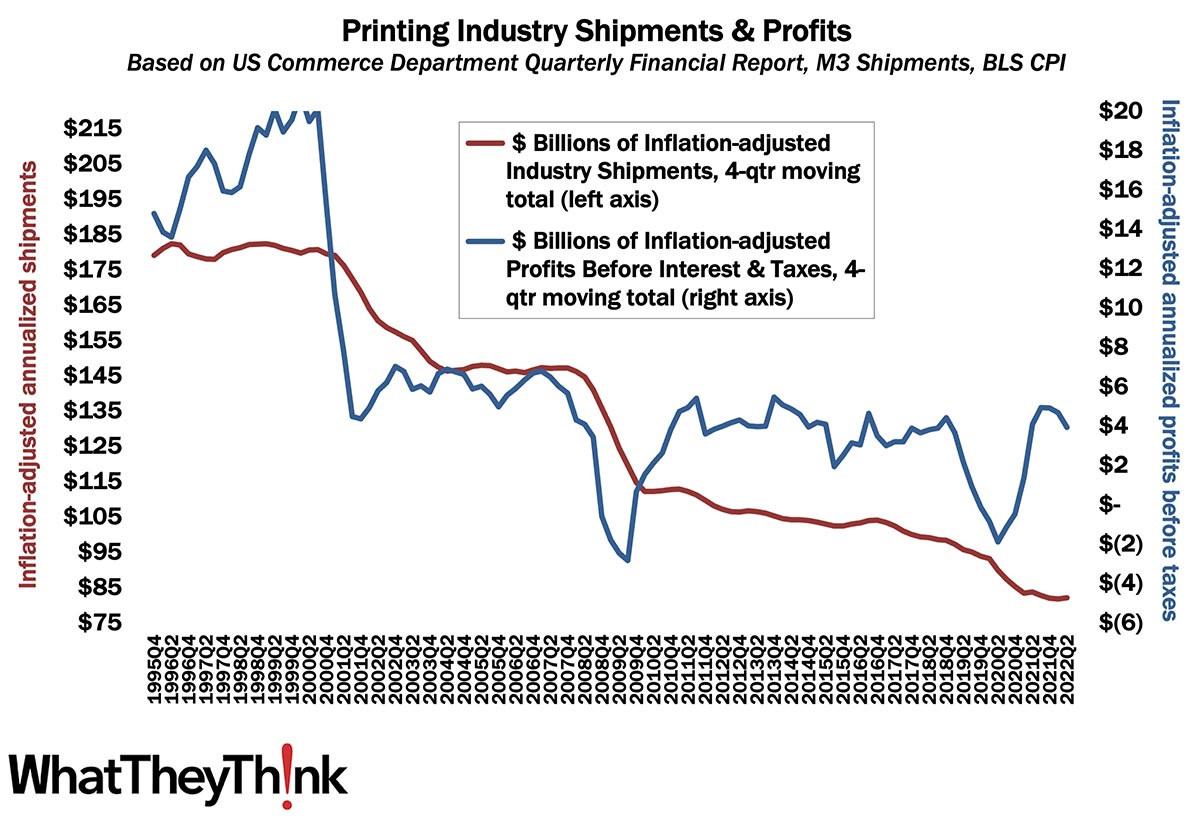
Q2 Printing Profits: An End to the Tale of Two Cities?
Published: September 30, 2022
Printing industry profits plunged during the pandemic peak but rebounded strongly afterward. But after hitting a peak in Q3 of last year, we’re on a downward trend, with annualized profits for Q2 2022 coming in at $3.92 billion, down a tad from $4.68 billion in Q1 2022. Full Analysis
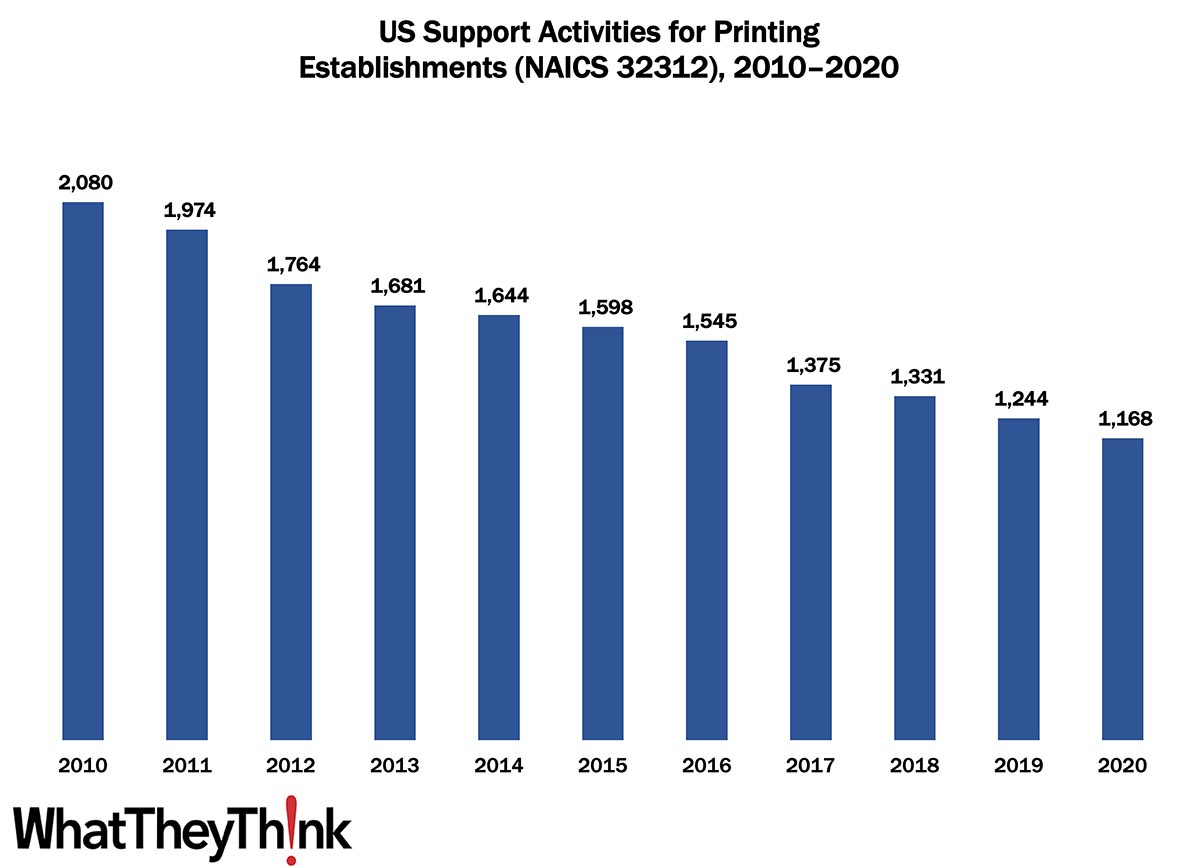
Pre- and Postpress Establishments—2010–2020
Published: September 23, 2022
According to the latest, recently released edition of County Business Patterns, in 2020 there were 1,168 establishments in NAICS 32312 (Support Activities for Printing). This represents a decrease of 44% since 2010. In macro news, AIA’s Architecture Billings Index (ABI) indicates that demand for design services accelerated in August, boding well for commercial real estate construction and thus signage projects. Full Analysis
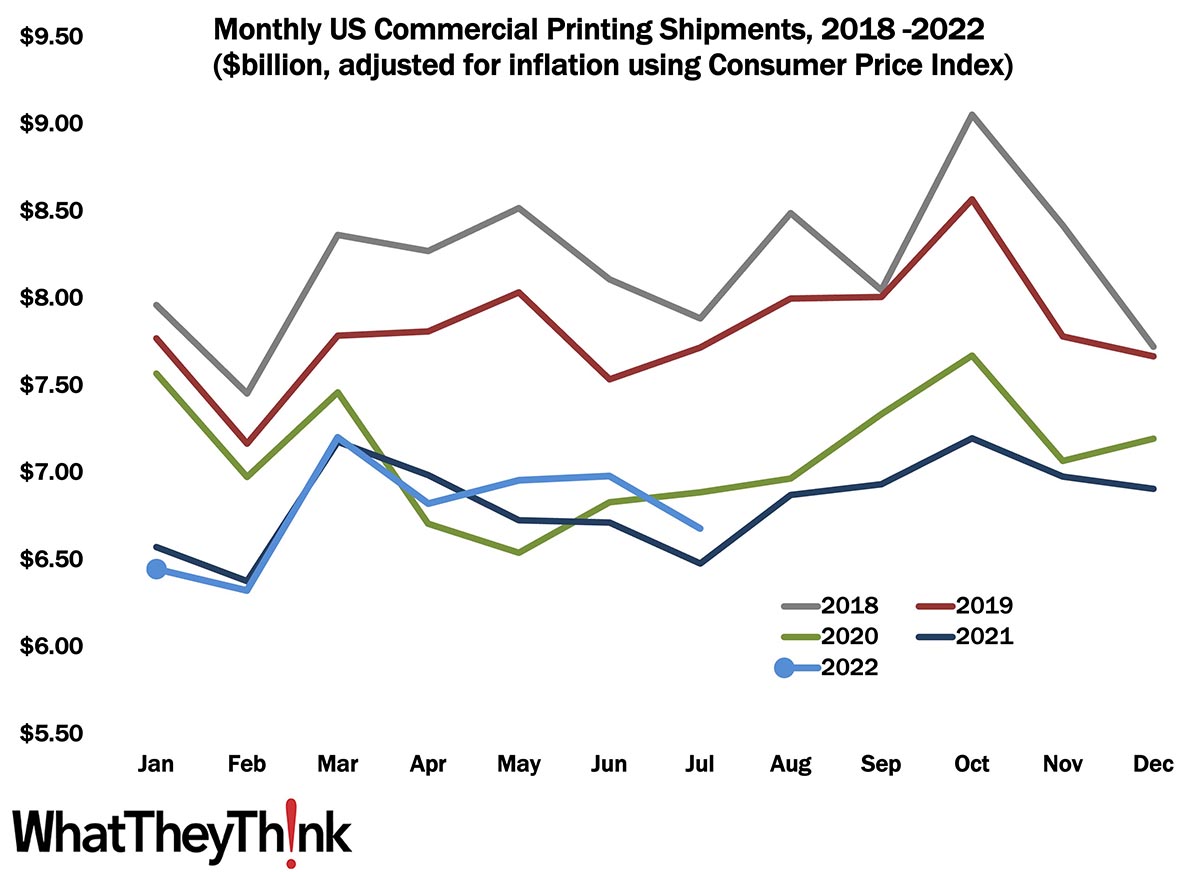
Printing Shipments: July Takes a Tumble
Published: September 16, 2022
July 2022 shipments came in at $6.68 billion, down from June’s $6.98 billion, as the dog days of summer kicked in. Full Analysis
Book Printing Establishments—2010–2020
Published: September 9, 2022
According to the latest, recently released edition of County Business Patterns, in 2020 there were 379 establishments in NAICS 323117 (Books Printing). This represents a decrease of 29% since 2010. In macro news, highlights from the most recent Federal Reserve “Beige Book.” Full Analysis
Graphic Arts Employment Up Slightly in July
Published: September 2, 2022
In July 2022, all printing employment was up +0.7% from June. Production employment was up 0.2% and non-production employment was up 1.8%. Full Analysis
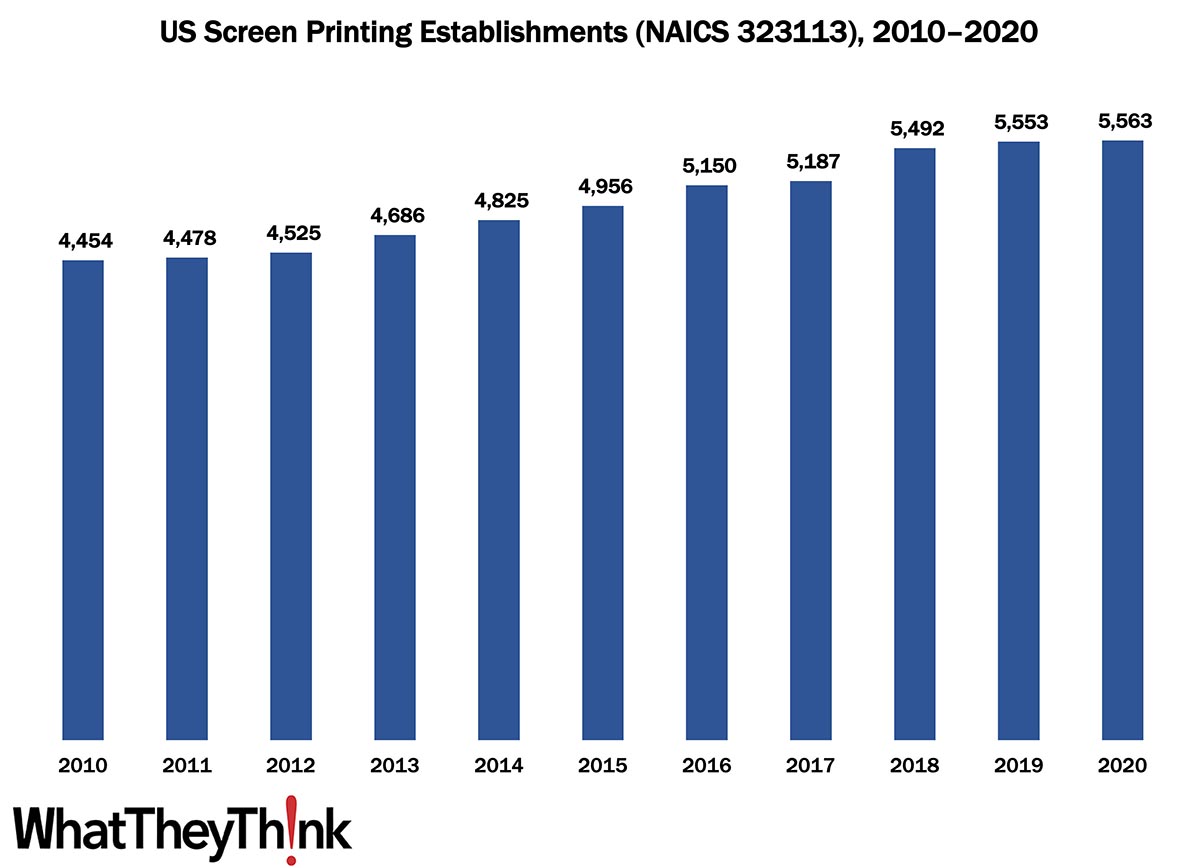
Screen Printing Establishments—2010–2020
Published: August 26, 2022
According to the latest, recently released edition of County Business Patterns, in 2020 there were 5,563 establishments in NAICS 323113 (Commercial Screen Printing). This represents an increase of 25% since 2010. In macro news, 2Q GDP revised up to -0.6%. Full Analysis
Printing Shipments: The Best June Since the Before Times
Published: August 19, 2022
June 2022 shipments came in at $6.98 billion, up a tad from May’s $6.96 billion. This is the best June the industry has had since 2019—although it’s well below that month’s $7.54 billion. Full Analysis
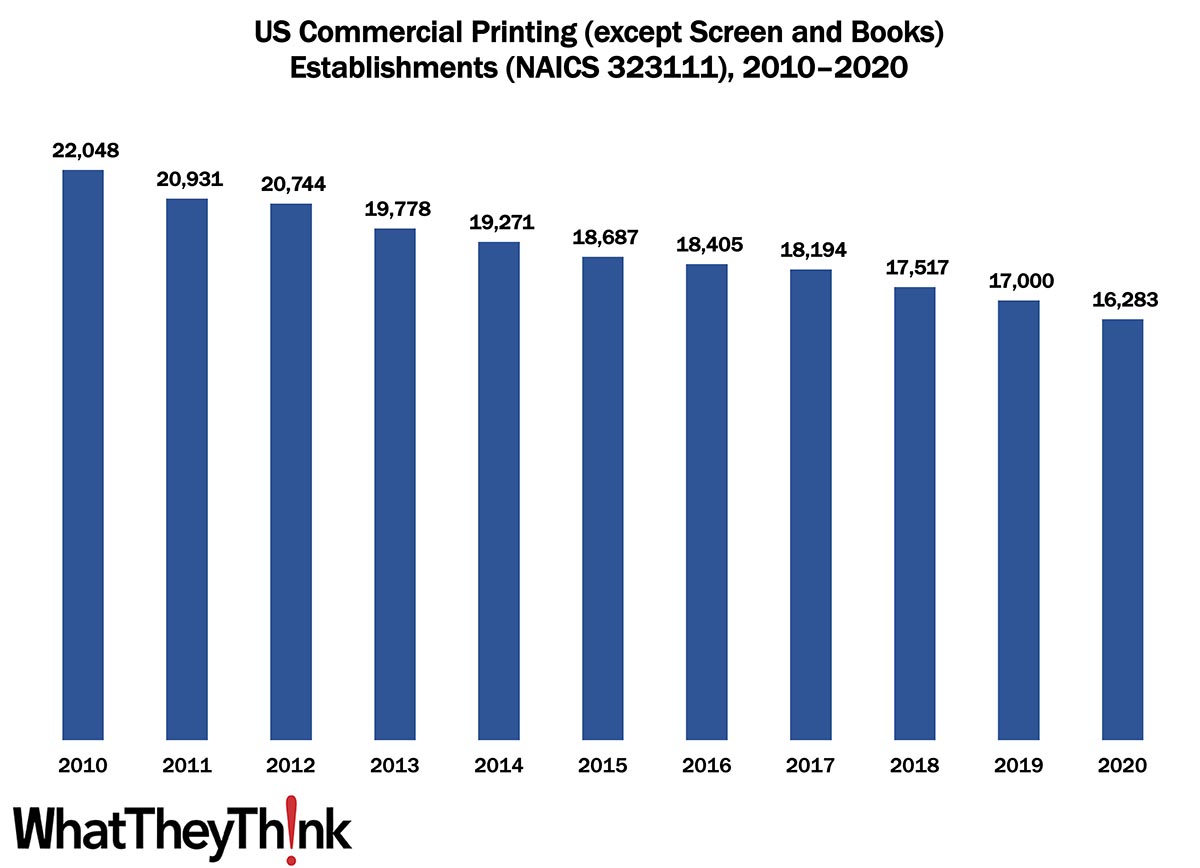
Commercial Printing Establishments—2010–2020
Published: August 12, 2022
According to the latest, recently released edition of County Business Patterns, in 2020 there were 16,283 establishments in NAICS 323111 (Commercial Printing except Screen and Books). This represents a decline of 26% since 2010. In macro news, inflation is flat! Full Analysis
June Graphic Arts Employment—The Production/Non-Production See Saw This Month Favors Non-Production Workers
Published: August 5, 2022
In June 2022, all printing employment was up +0.2% from May. This time, it was production employment that was down (-0.8%) and non-production employment that was up (+2.3%). Full Analysis
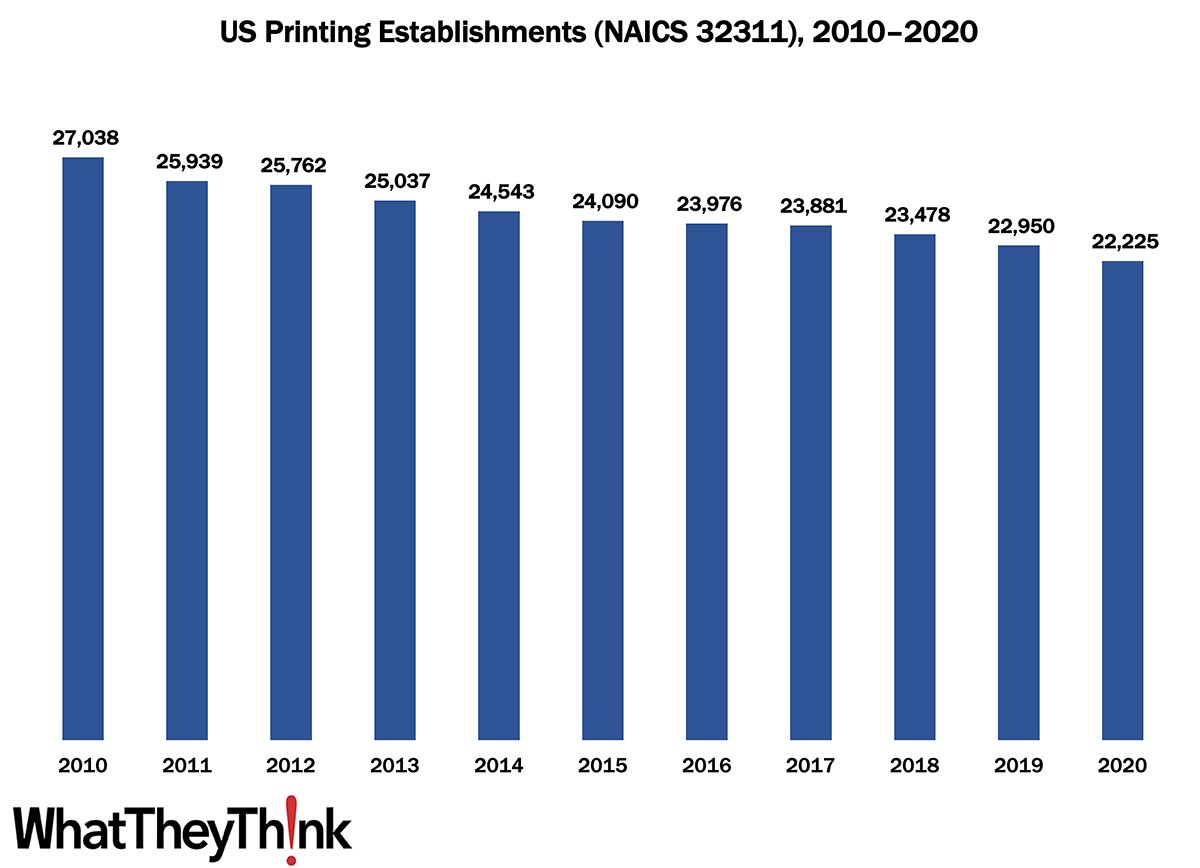
Printing Establishments—2010–2020
Published: July 29, 2022
According to the latest, just-released edition of County Business Patterns, in 2020 there were 22,225 establishments in NAICS 32311 (Printing). This represents a decline of 18% since 2010. In macro news, Q2 GDP declined -0.9%. Full Analysis
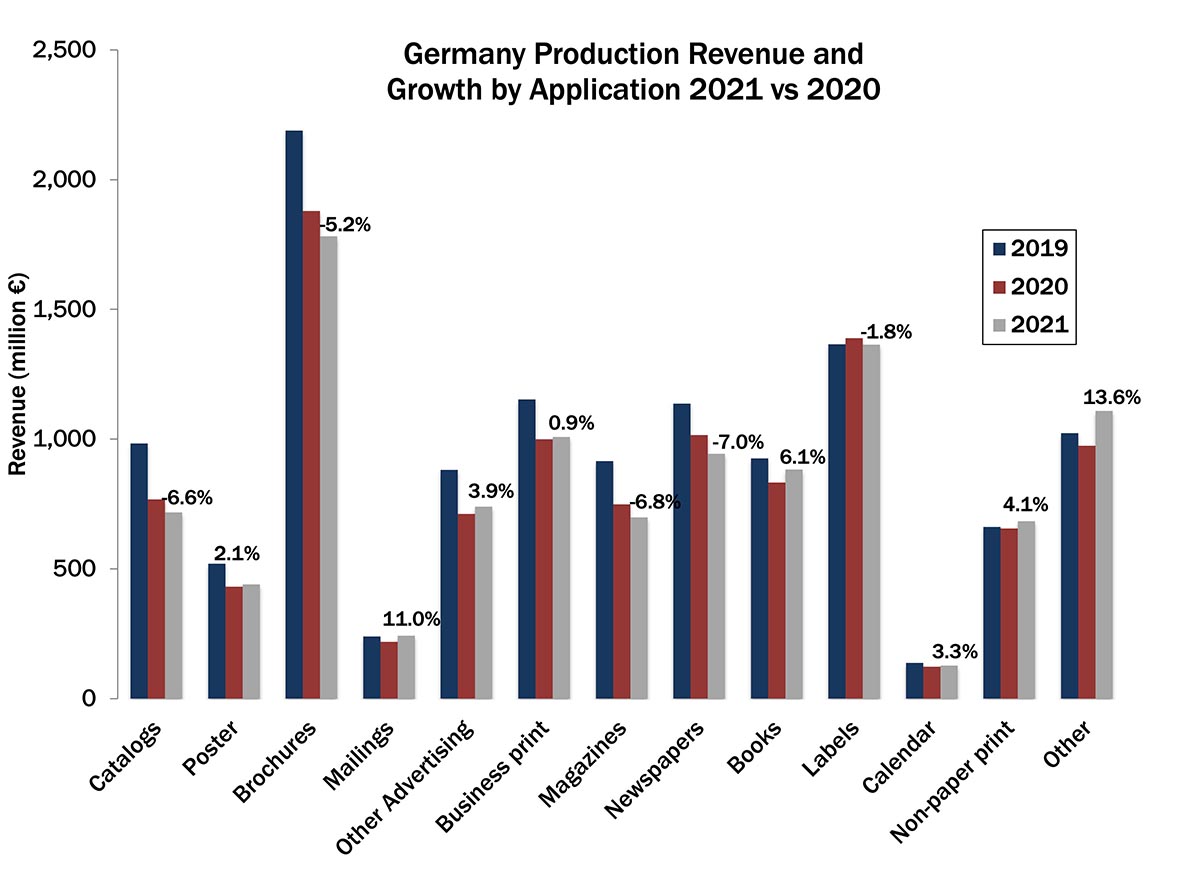
Post-Pandemic Print Applications in Germany—No Drop, No Growth
Published: July 26, 2022
The German printing industry association (BVDM) recently published its 2021 print industry statistics, which includes an overview of print application revenues. Ralf Schlözer takes a look at print revenue growth in Germany and the impact the pandemic and post-pandemic recovery had on individual print applications. Full Analysis
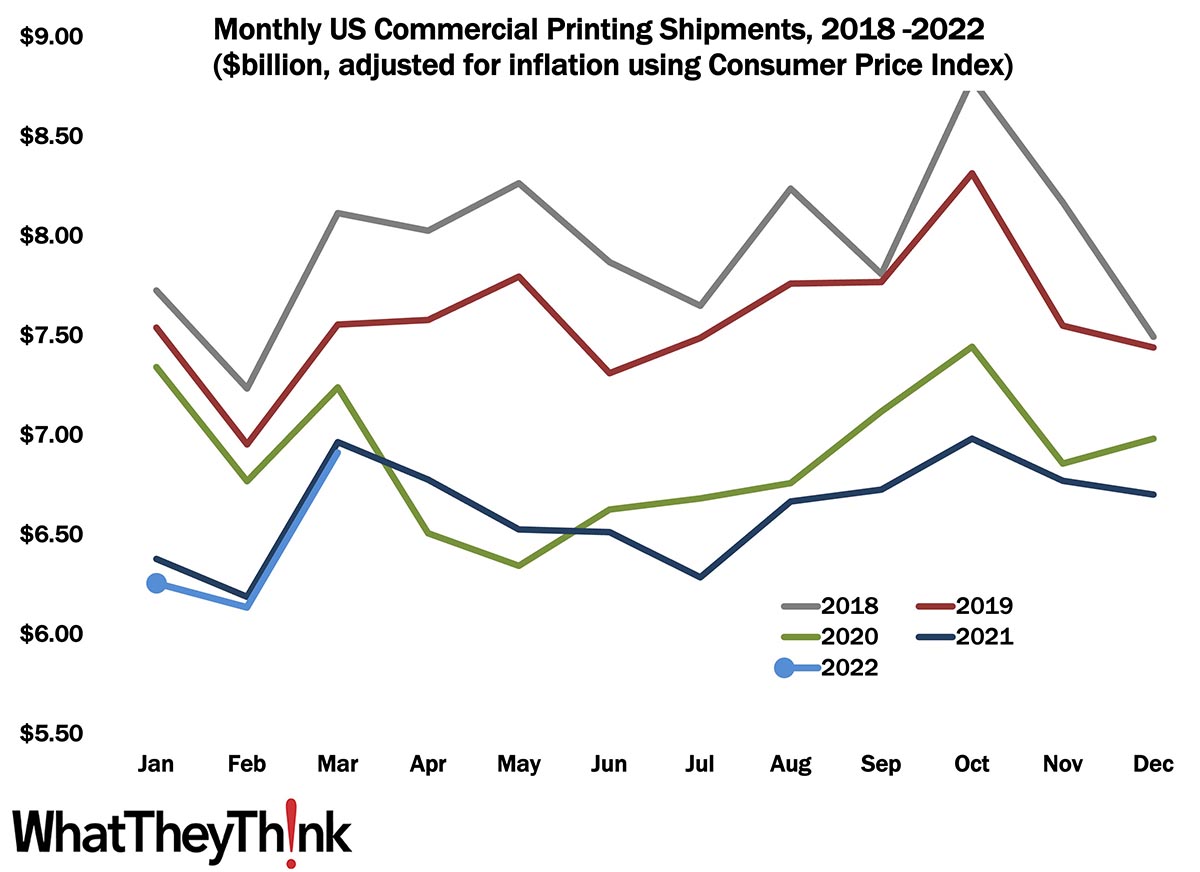
Printing Shipments: The Best May Since the Before Times
Published: July 22, 2022
May 2022 shipments came in at $6.77 billion, up from April’s $6.73 billion. This is the best May the industry has had since 2019—although it’s well below that month’s $7.92 billion. Full Analysis
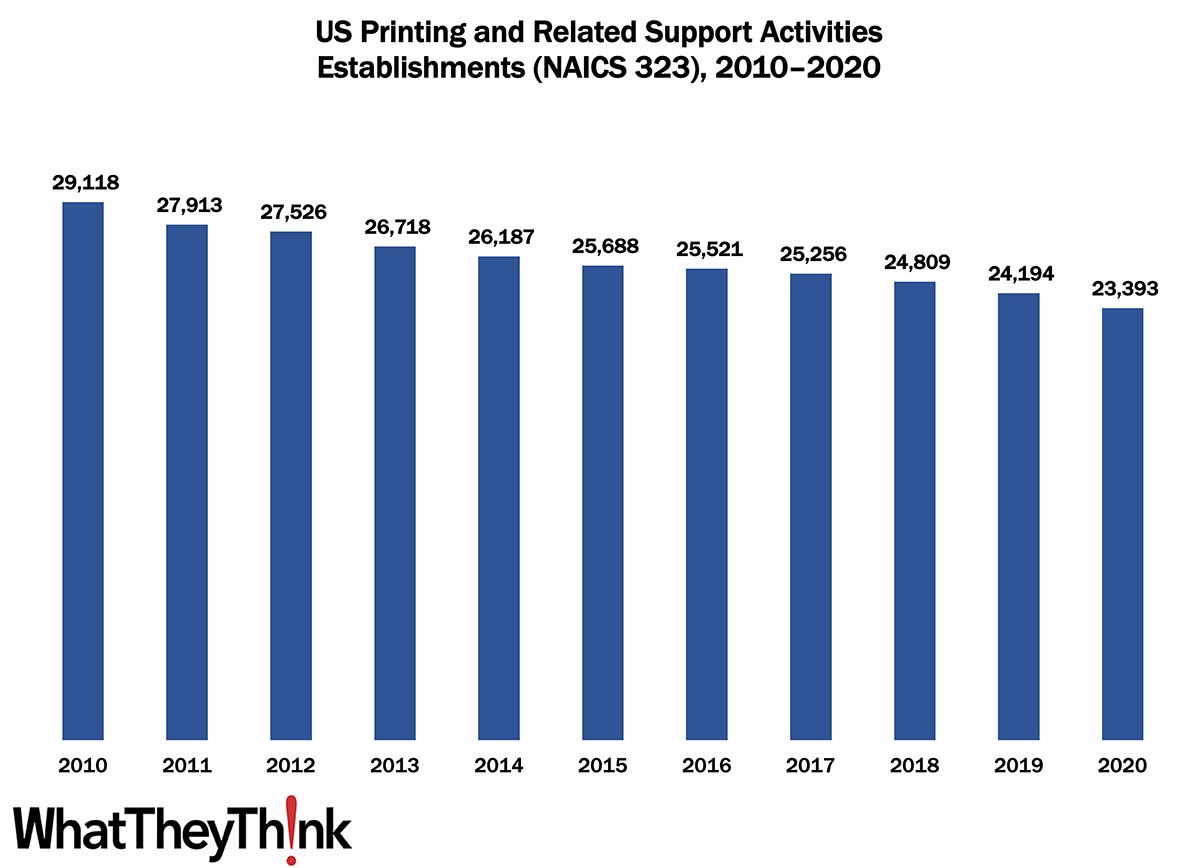
Printing Establishments—2010–2020
Published: July 15, 2022
According to the latest, just-released edition of County Business Patterns, in 2020 there were 23,393 establishments in NAICS 323 (Printing and Related Support Activities). This represents a decline of 20% since 2010. In macro news, Q2 GDP estimates are bearish—but that may not be cause for concern. Full Analysis
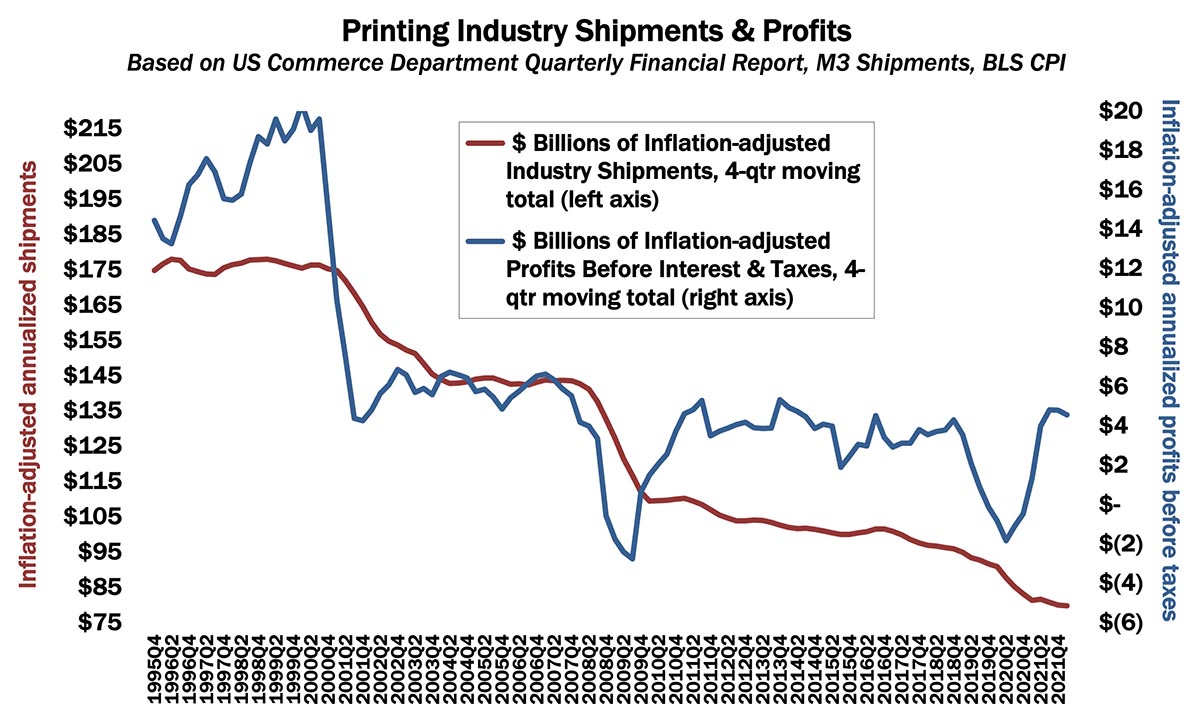
Printing Profits: Back to Pre-Pandemic Levels
Published: July 1, 2022
Despite COVID, printing industry profits have been pretty good, with annualized profits for Q1 2022 coming in at $4.55 billion, down from $4.79 billion in Q4 2021. Full Analysis
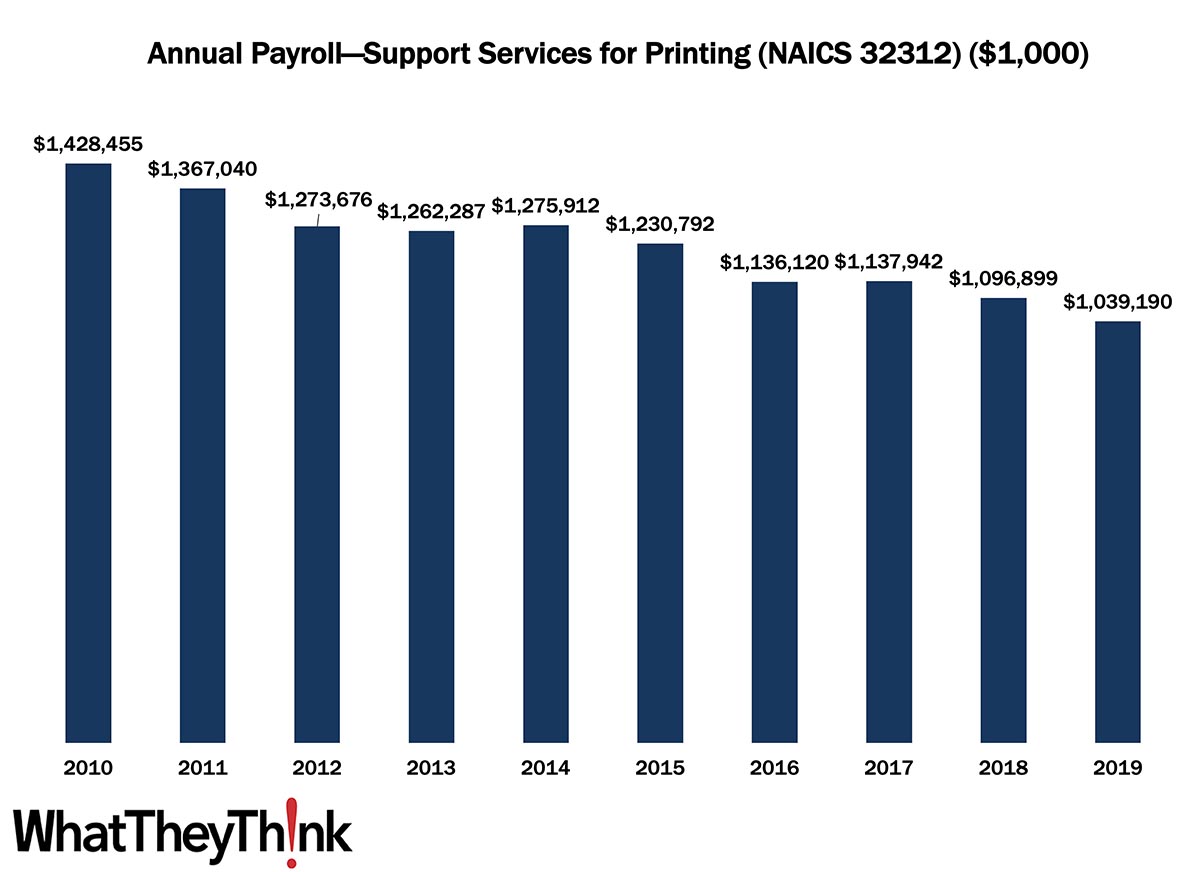
Support Activities for Printing Annual Payroll—2010–2019
Published: June 24, 2022
According to County Business Patterns, in 2010, US establishments in NAICS 32312 had an annual payroll of $1.4 billion. Payrolls declined steadily over the course of the 2010s, closing out the decade at $1.0 billion in 2019. However adjusting for inflation, payrolls declined by -38% over the course of the decade. In macro news: AIA’s Architecture Billings Index (ABI) indicates that demand for design services remains strong, boding well for commercial real estate construction and thus signage projects. Full Analysis
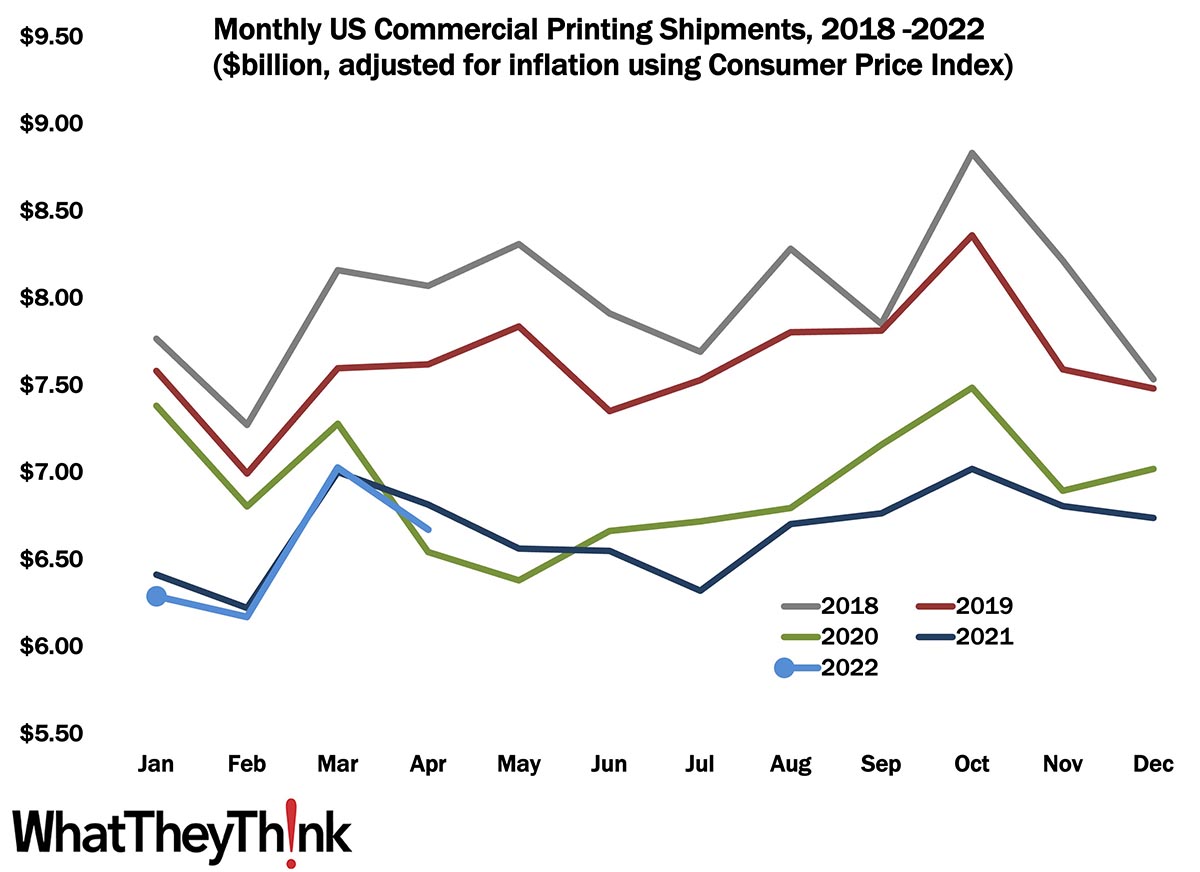
April Shipments: Returning to Regular Seasonality
Published: June 17, 2022
April 2022 shipments came in at $6.67 billion, down from March’s $7.03 billion. The general trend in all but two of the last seven years has been for April shipments to decline from March’s. That’s not really good news but suggests we’re at least getting back to normal. Full Analysis
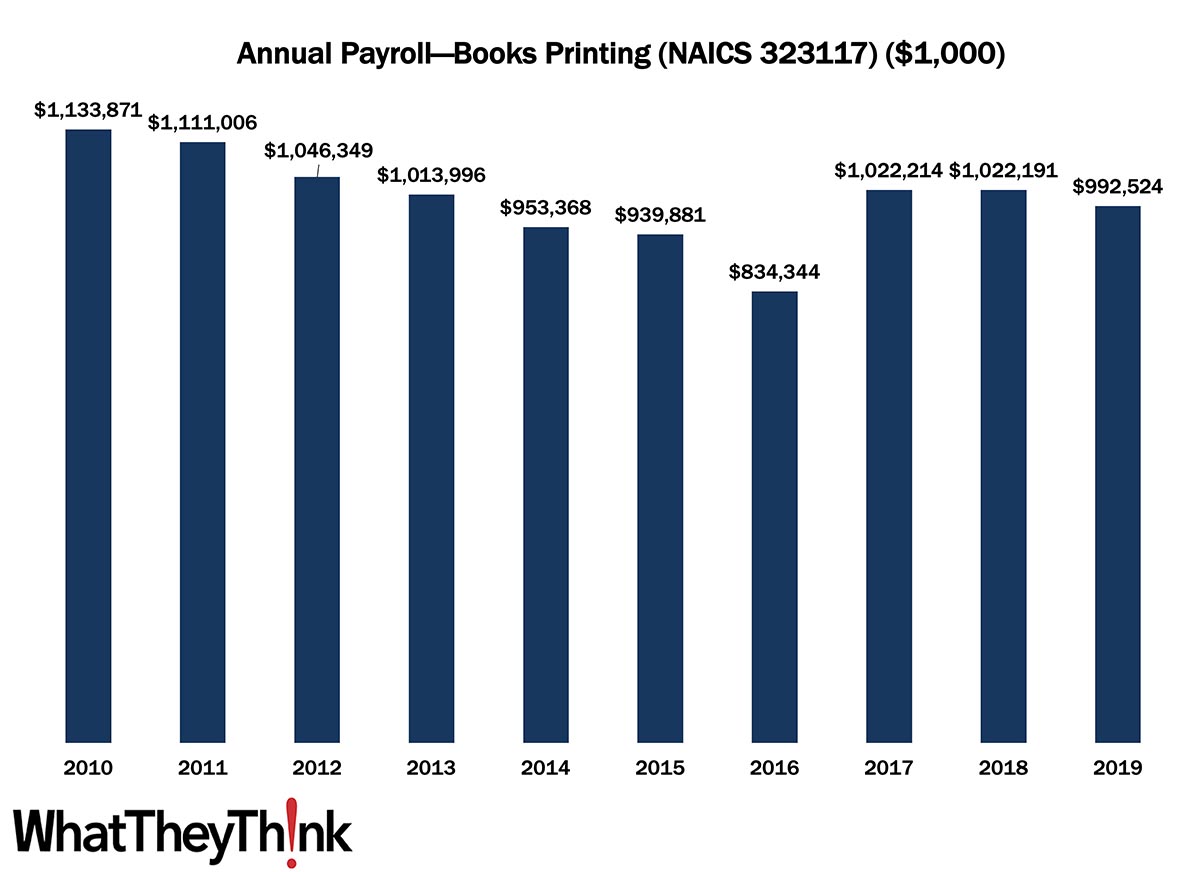
Book Printing Annual Payroll—2010–2019
Published: June 10, 2022
According to County Business Patterns, in 2010, US establishments in NAICS 323117 had an annual payroll of $1.1 billion. Payrolls declined over the first half of the 2010s, at least on a current dollar basis, but started to rise again, closing out the decade at $993 million in 2019. However adjusting for inflation, payrolls declined by -25% over the course of the decade. In macro news: what’s going on with the real estate market? Full Analysis
April Graphic Arts Employment—Print Production Up from March, Non-Production Down Slightly
Published: June 3, 2022
In March 2022, all printing employment was up +0.6% from March. This time, it was production employment that was up (+1.6%) and non-production employment that was down (-0.9%). Full Analysis
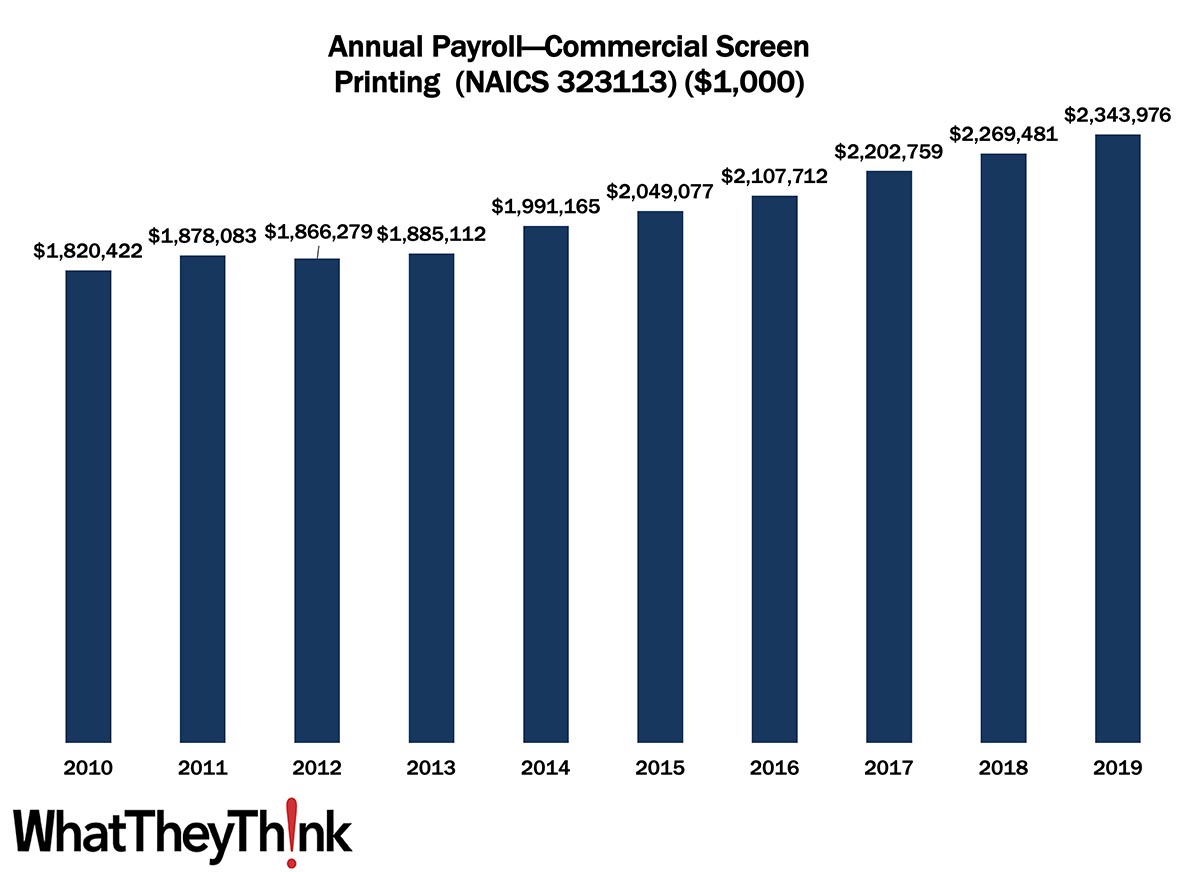
Commercial Screen Printing Annual Payroll—2010–2019
Published: May 27, 2022
According to County Business Patterns, in 2010, US establishments in NAICS 323113 had an annual payroll of $1.8 billion. Payrolls were generally unaffected by the Great Recession and rose over the course of the 2010s, at least on a current dollar basis, finishing out the decade at $2.3 billion in 2019. However adjusting for inflation, payrolls declined by -10% over the course of the decade. In macro news: Q1 GDP revised down. Full Analysis
March Shipments: It’s Déjà Vu All Over Again
Published: May 20, 2022
March 2022 shipments came in at $6.91 billion, up from February’s $6.14 billion. So far, it looks like 2022 is closely mirroring 2021—which isn’t necessarily a bad thing. Full Analysis
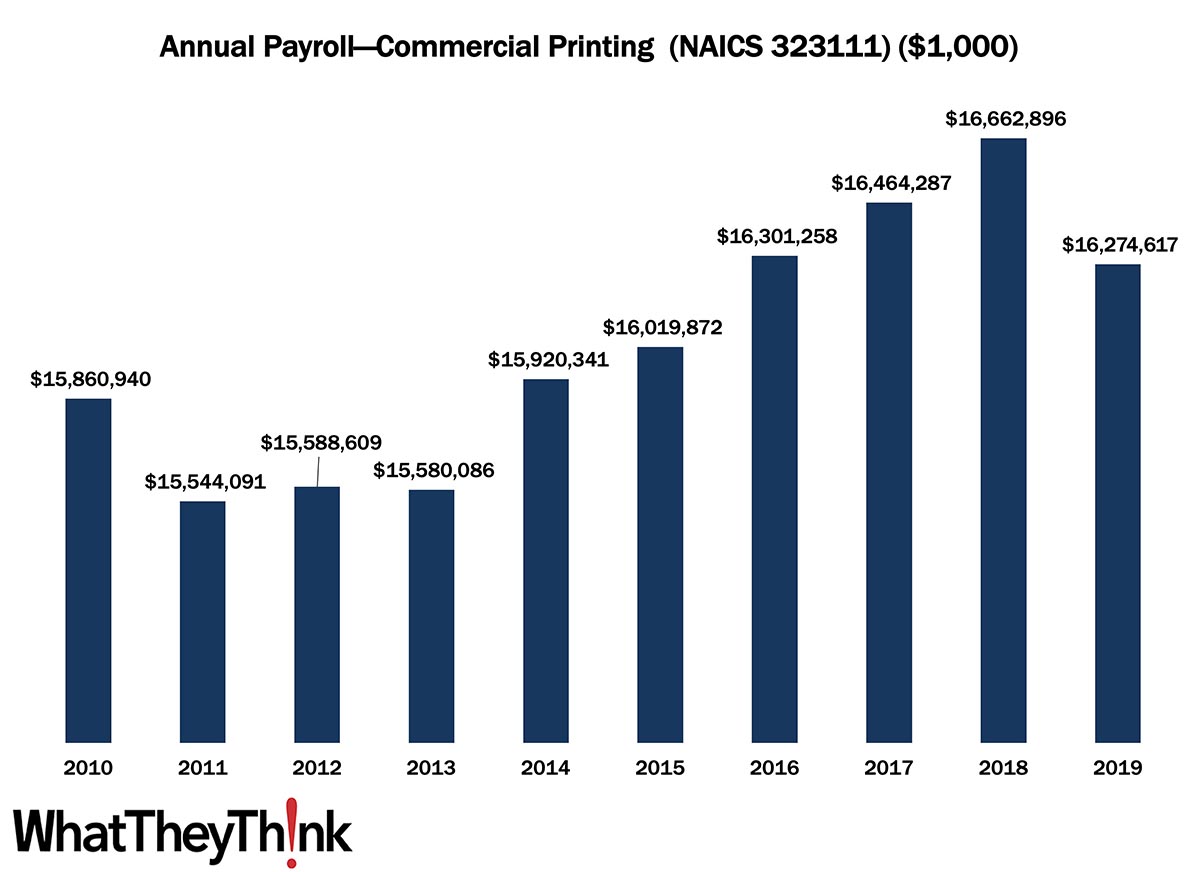
Commercial Printing Annual Payroll—2010–2019
Published: May 13, 2022
According to County Business Patterns, in 2010, US establishments in NAICS 323111 had an annual payroll of $15.9 billion. Payrolls dipped during and in the aftermath of the Great Recession and then rose, at least on a current dollar basis, over the latter half of the decade before dropping in 2019, finishing out the decade at $16.3 billion in 2019. However adjusting for inflation, payrolls declined by -12% over the course of the decade. In macro news: inflation is starting to slow ever so slightly. Full Analysis
March Graphic Arts Employment—Print Production Drops from February, Non-Production Up a Bit
Published: May 6, 2022
In March 2022, all printing employment was up +0.2% from February. Non-production printing employment was up +2.7%, but production employment was down -0.9%. Full Analysis
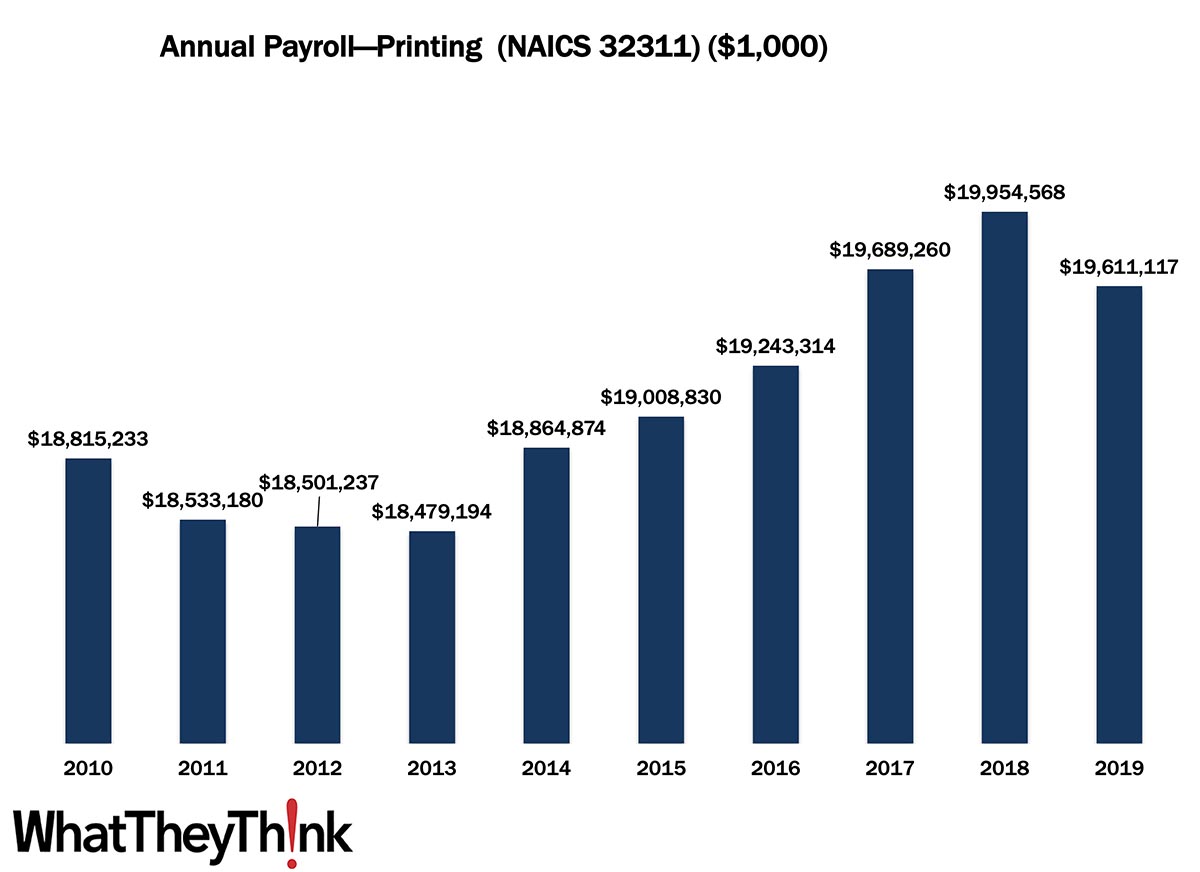
Printing Annual Payroll—2010–2019
Published: April 29, 2022
According to County Business Patterns, in 2010, US establishments in NAICS 32311 had an annual payroll of $18.8 billion. Payrolls dipped during and in the aftermath of the Great Recession and then rose, at least on a current dollar basis, over the latter half of the decade, coming in at $19.6 billion in 2019. However adjusting for inflation, payrolls declined by -11% over the course of the decade. In macro news: GDP decreased by 1.4% in Q1 2022. Full Analysis
February Shipments: OK, About What We Expected
Published: April 22, 2022
February 2022 shipments came in at $6.53 billion, down from January’s $6.67 billion. As we remarked last month we’re starting the year better than we did 2021 and reverting back to our normal seasonality trends. Full Analysis
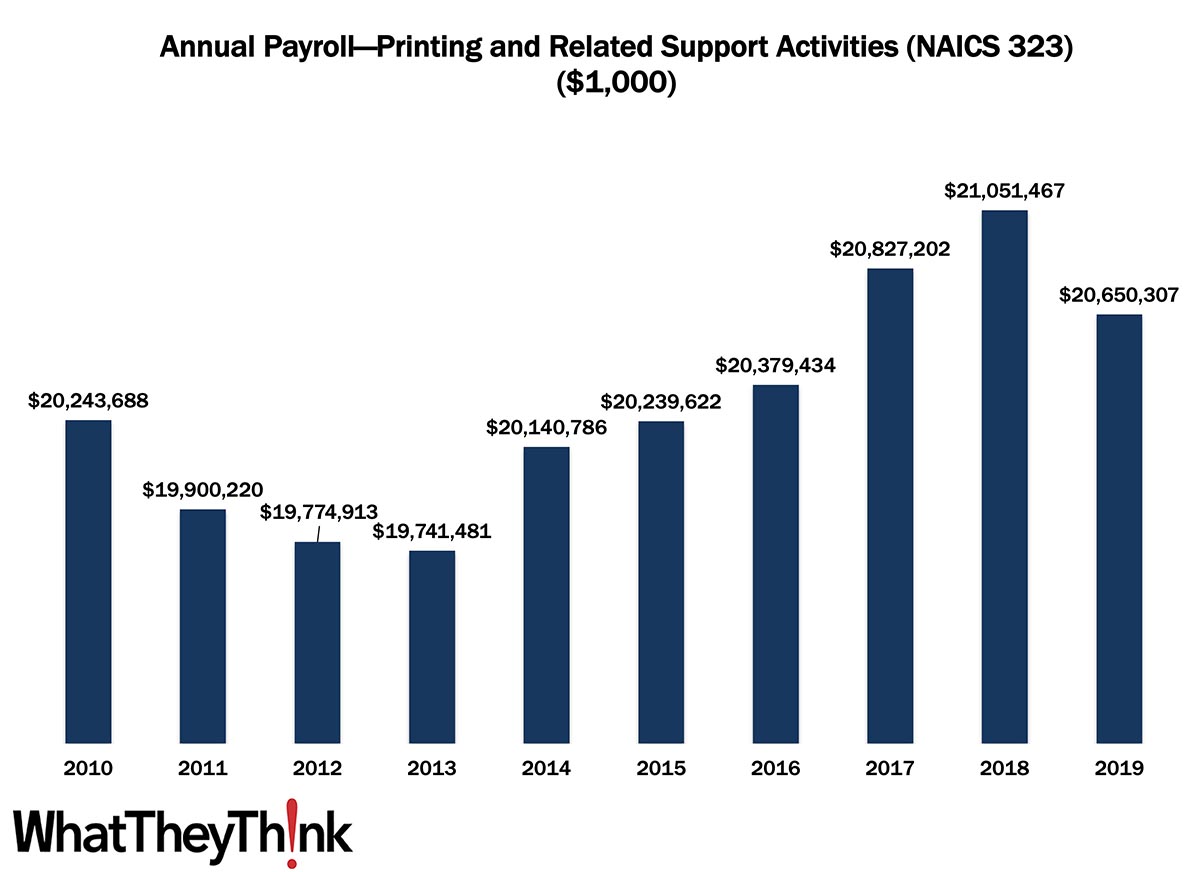
Printing Industry Annual Payroll—2010–2019
Published: April 8, 2022
According to County Business Patterns, in 2010, US establishments in NAICS 323 had an annual payroll of $20.2 billion. Payrolls dipped during and in the aftermath of the Great Recession. They rose, at least on a current dollar basis, over the latter half of the decade, coming in at $20.7 billion in 2019. However adjusting for inflation, payrolls declined by -13% over the course of the decade. In macro news: forecasters are not expecting a happy Q1 GDP report. Full Analysis
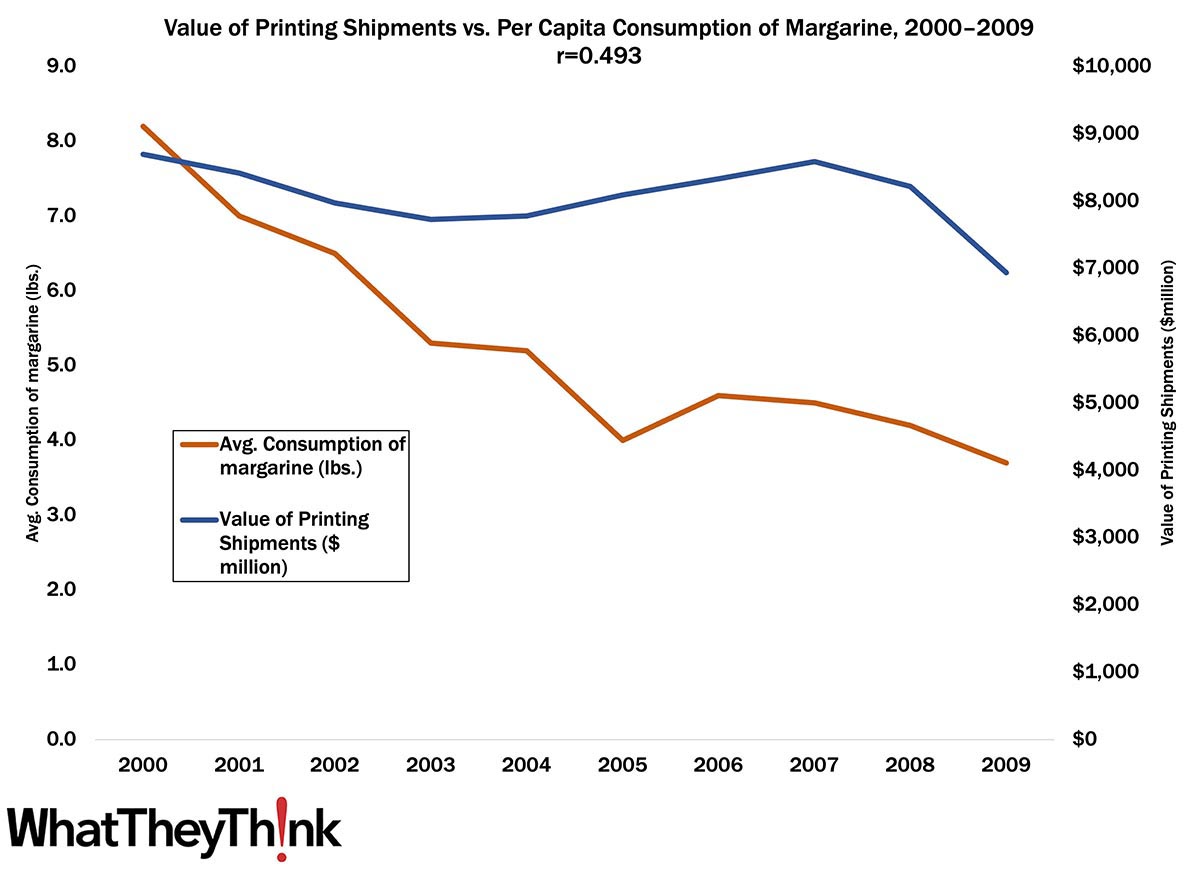
Now it Can be Told: Why Printing Shipments Declined! (April Fools 2022 Edition)
Published: April 1, 2022
In this exclusive report, we found a modest positive relationship between the decline in average consumption of margarine and the value of printing shipments. Full Analysis
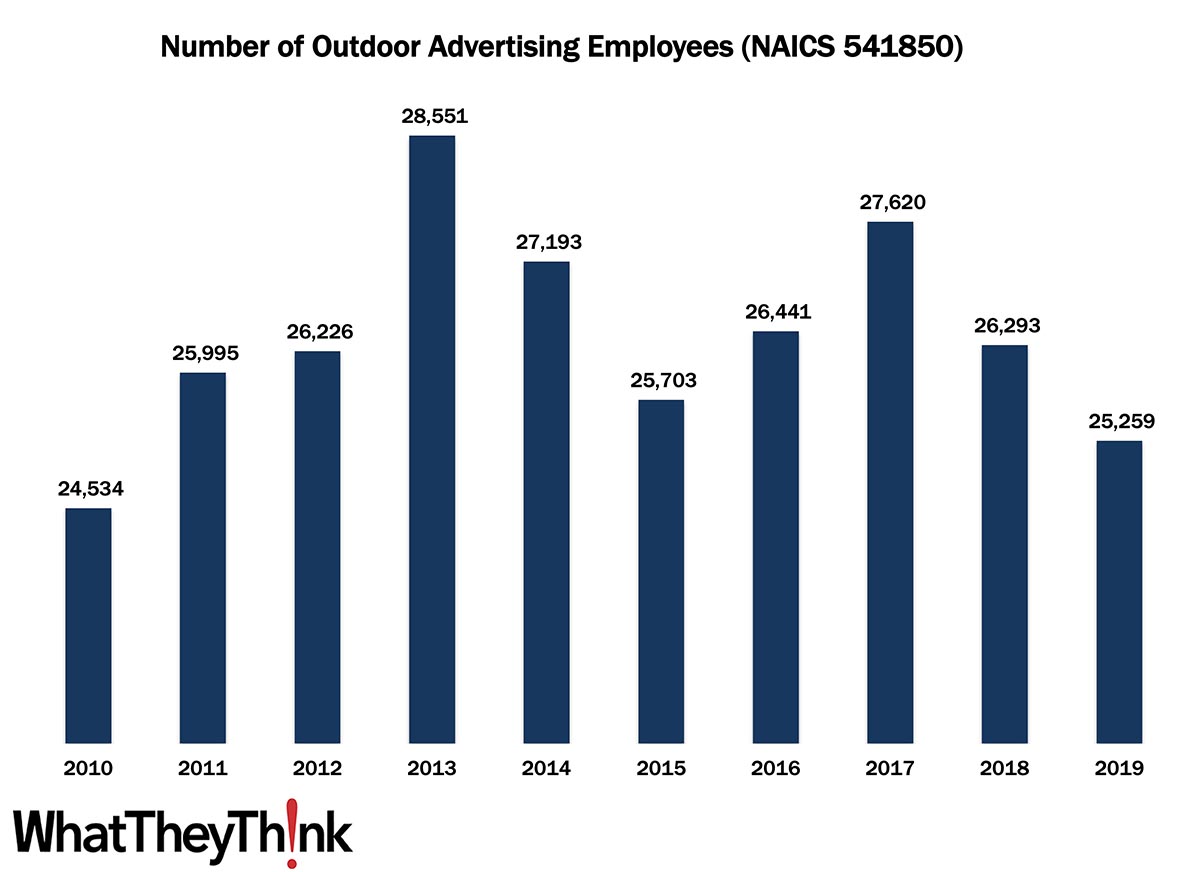
Outdoor Advertising Employees—2010–2019
Published: March 25, 2022
According to County Business Patterns, in 2010, there were 24,534 employees in NAICS 541850 (Outdoor Advertising). This NAICS actually grew post-Great Recession, with a slight decline mid-decade before climbing back up to 27,620 establishments in 2017. 2018 and 2019 saw a drop in employees. In macro news: AIA’s Architecture Billings Index (ABI) indicates that demand for design services continues to grow, boding well for commercial real estate construction and thus signage projects. Full Analysis
January Shipments: Let’s Get This Year Right
Published: March 18, 2022
January 2022 shipments came in at $6.64 billion, down from December’s $7.09 billion. We’re starting the year better than we did 2021 and reverting back to our normal seasonality trends. Full Analysis
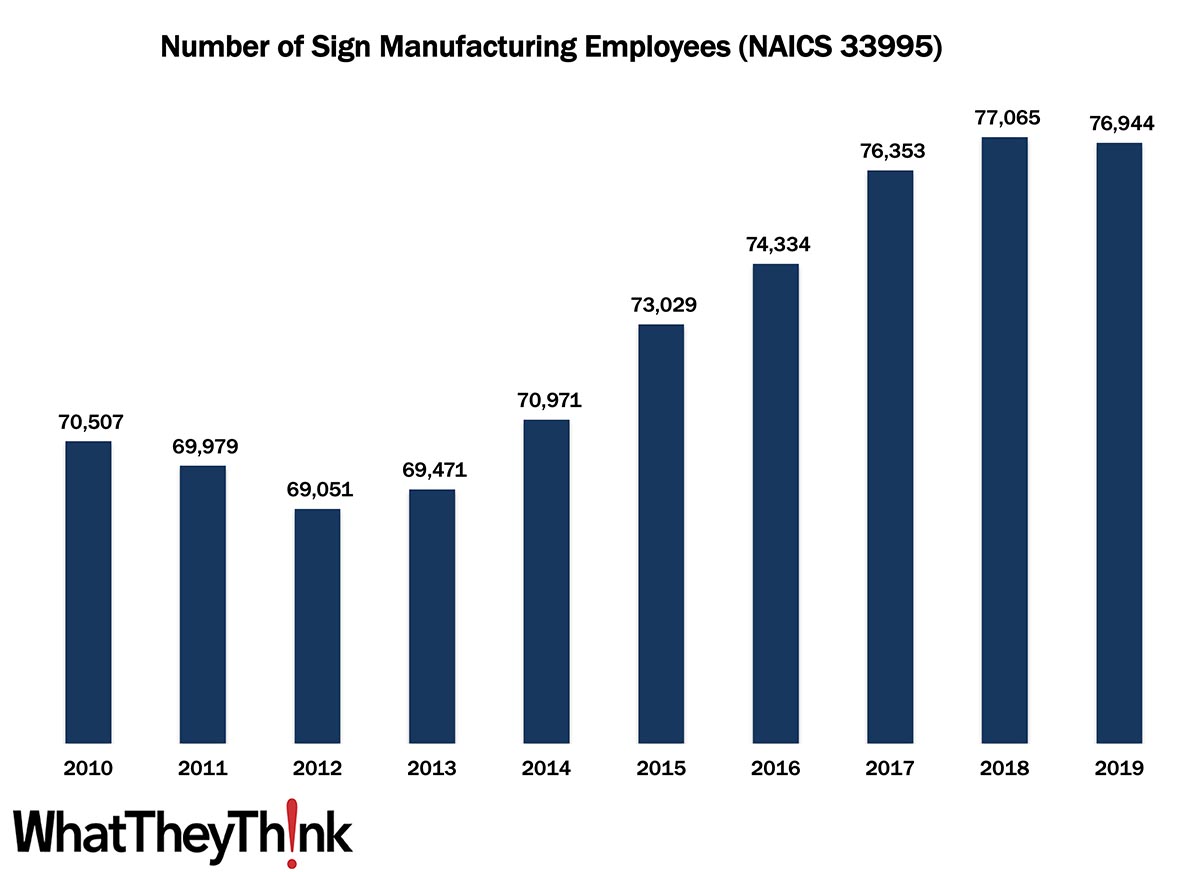
Sign Manufacturing Employees—2010–2019
Published: March 11, 2022
According to County Business Patterns, in 2010, there were 70,507 employees in NAICS 33995 (Sign Manufacturing). This NAICS category tumbled in the wake of the Great Recession, ultimately climbing to 76,944 employees in 2019. In macro news: Inflation continues to continue to climb. Full Analysis
January Graphic Arts Employment—Print Production Drops from December, Non-Production Up Slightly
Published: March 4, 2022
In January 2022, all printing employment was down -2.6% from December, with production employment down -4.1%. Non-production printing employment offset that a bit by being up a modest +0.9%. Full Analysis
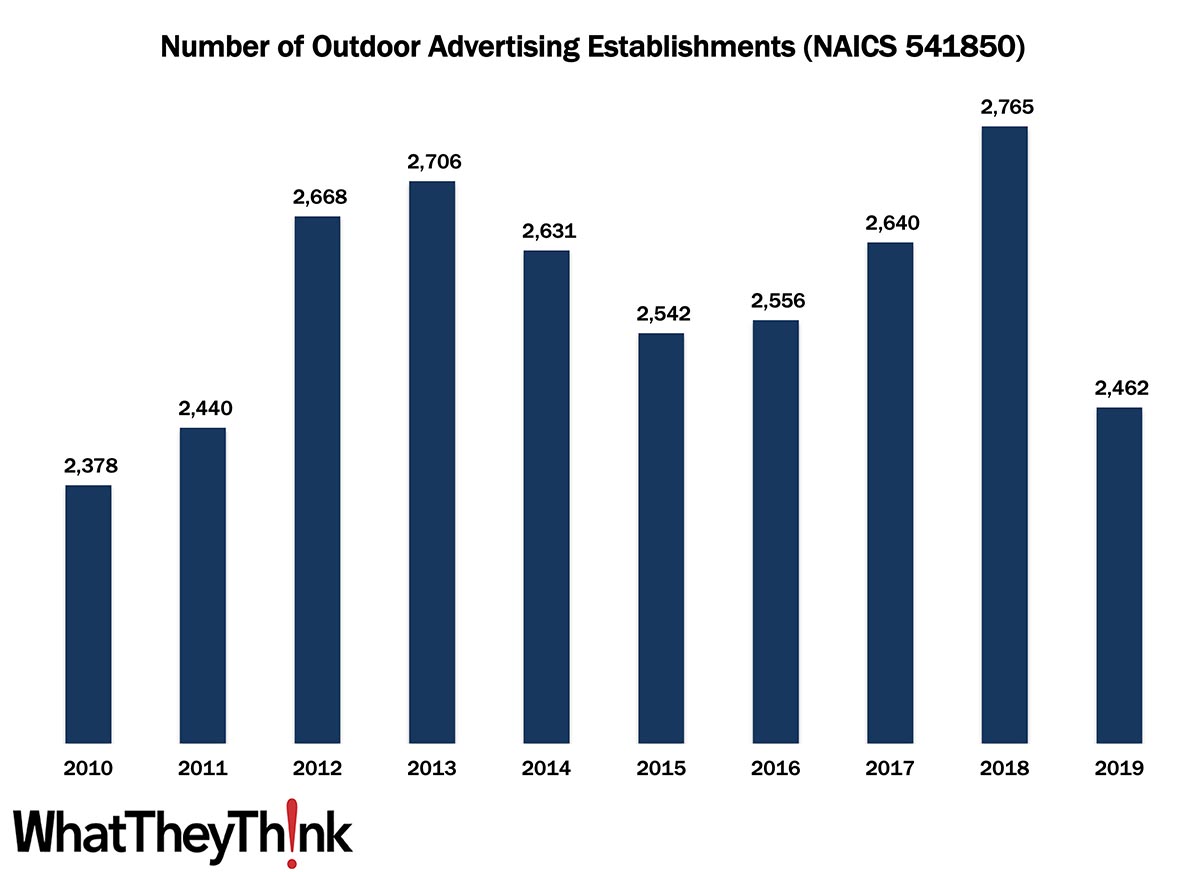
Outdoor Advertising Establishments—2010–2019
Published: February 25, 2022
According to County Business Patterns, in 2010, there were 2,378 establishments in NAICS 541850 (Outdoor Advertising). This NAICS actually grew post-Great Recession, with a slight decline mid-decade before climbing back up to 2,765 establishments in 2018. 2019 saw a massive drop in establishments. In macro news: Q4 2021 GDP revised up to 7.0%. Full Analysis
December Shipments: No Christmas Miracle
Published: February 18, 2022
As 2021 drew to a close, December printing shipments came in at $7.00 billion, down from $7.10 billion in November, keeping with the usual seasonality of a slow December. For 2021 overall, we came in at $82.87 billion for the year, just below 2020’s $83.73 billion. Full Analysis
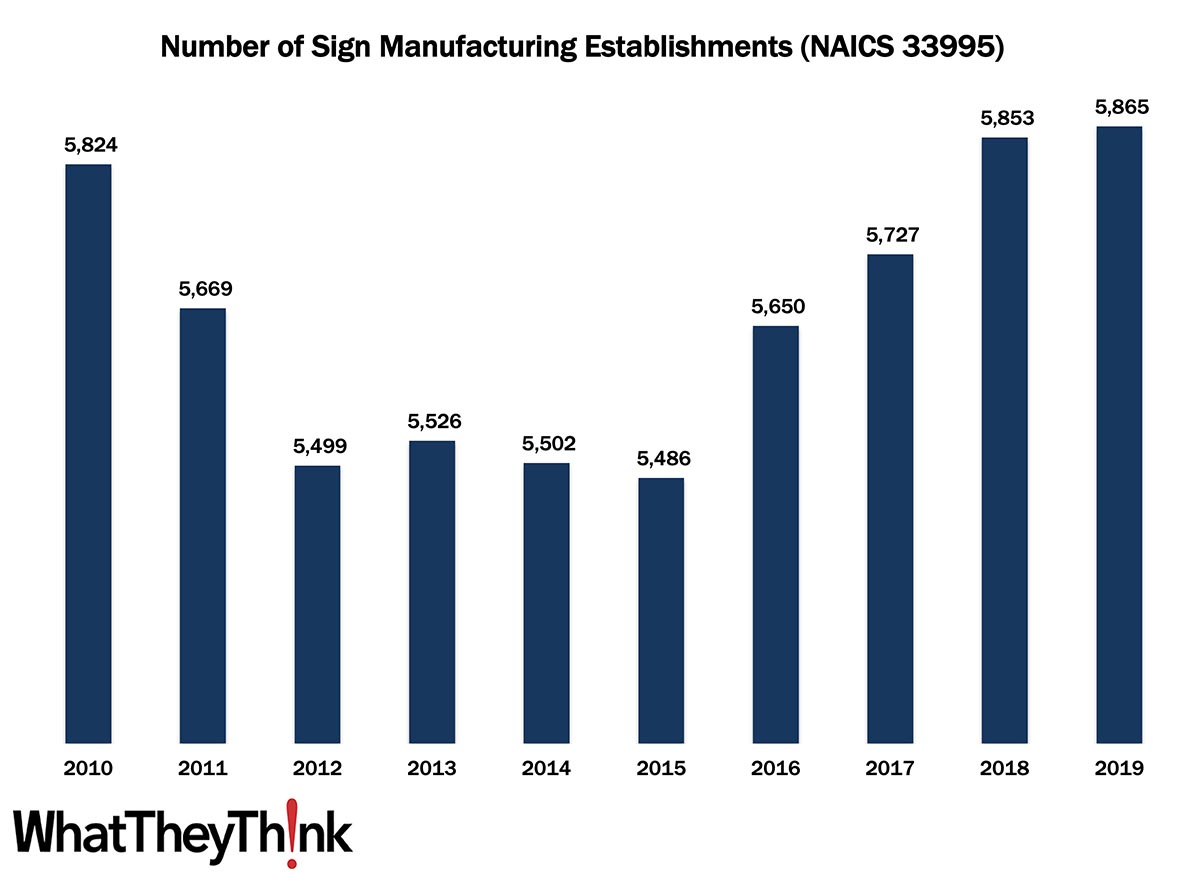
Sign Manufacturing Establishments—2010–2019
Published: February 11, 2022
According to County Business Patterns, in 2010, there were 5,824 establishments in NAICS 33995 (Sign Manufacturing). This NAICS category tumbled in the wake of the Great Recession, ultimately climbing back up to 5,865 establishments in 2019. In macro news: Inflation continues to climb. Full Analysis
Post-Pandemic Profits on the Upturn
Published: February 4, 2022
Shipments have been slowly climbing back from the pandemic recession of 2020, but profits have been on a sharp upturn. However there still remains a bit of a profitability gap between the two major asset class distinctions. Full Analysis
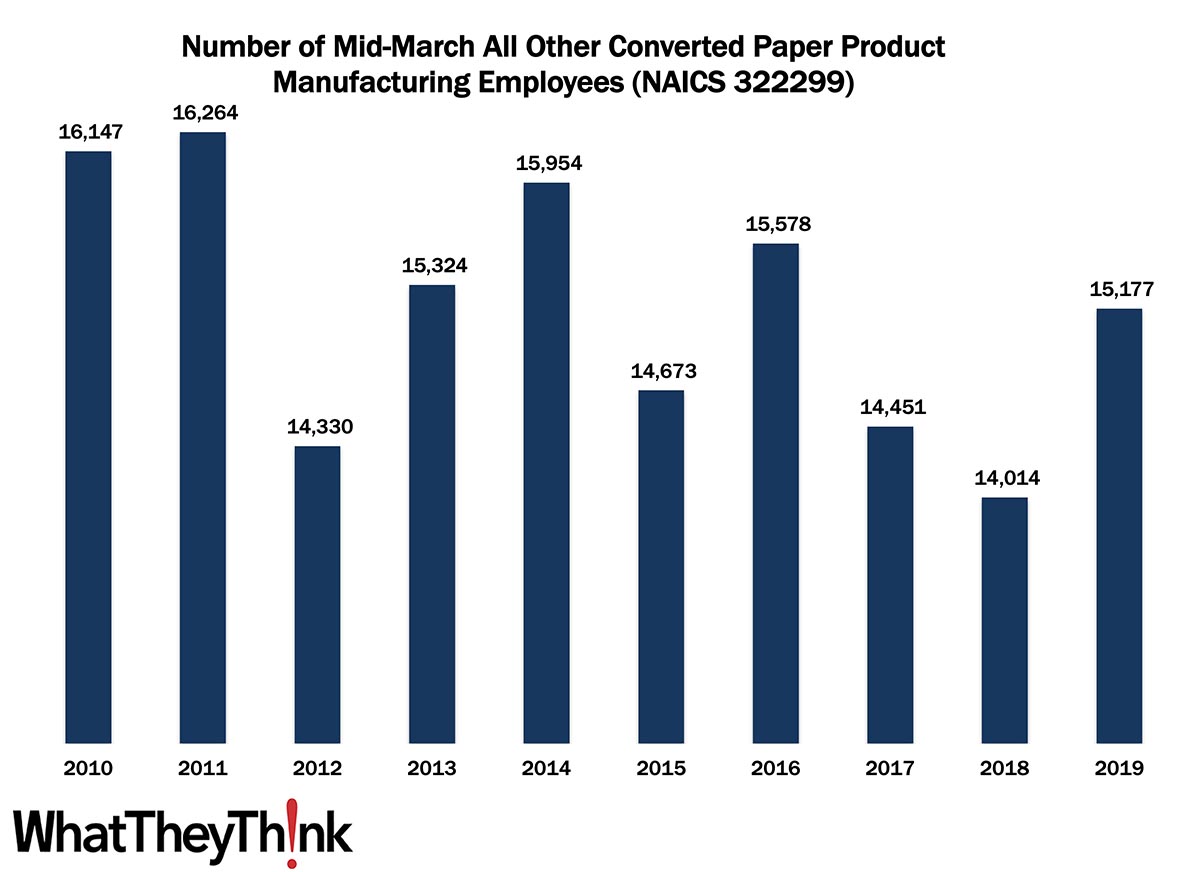
All Other Converted Paper Product Manufacturing Employment—2010–2019
Published: January 28, 2022
According to County Business Patterns, in 2010, there were 16,147 employees in 322299 (All Other Converted Paper Product Manufacturing establishments). This NAICS category bounced up and down over the course of the 2010s, ending with 15,177 employees in 2019. In macro news: Yesterday was Q4 GDP Day! Full Analysis
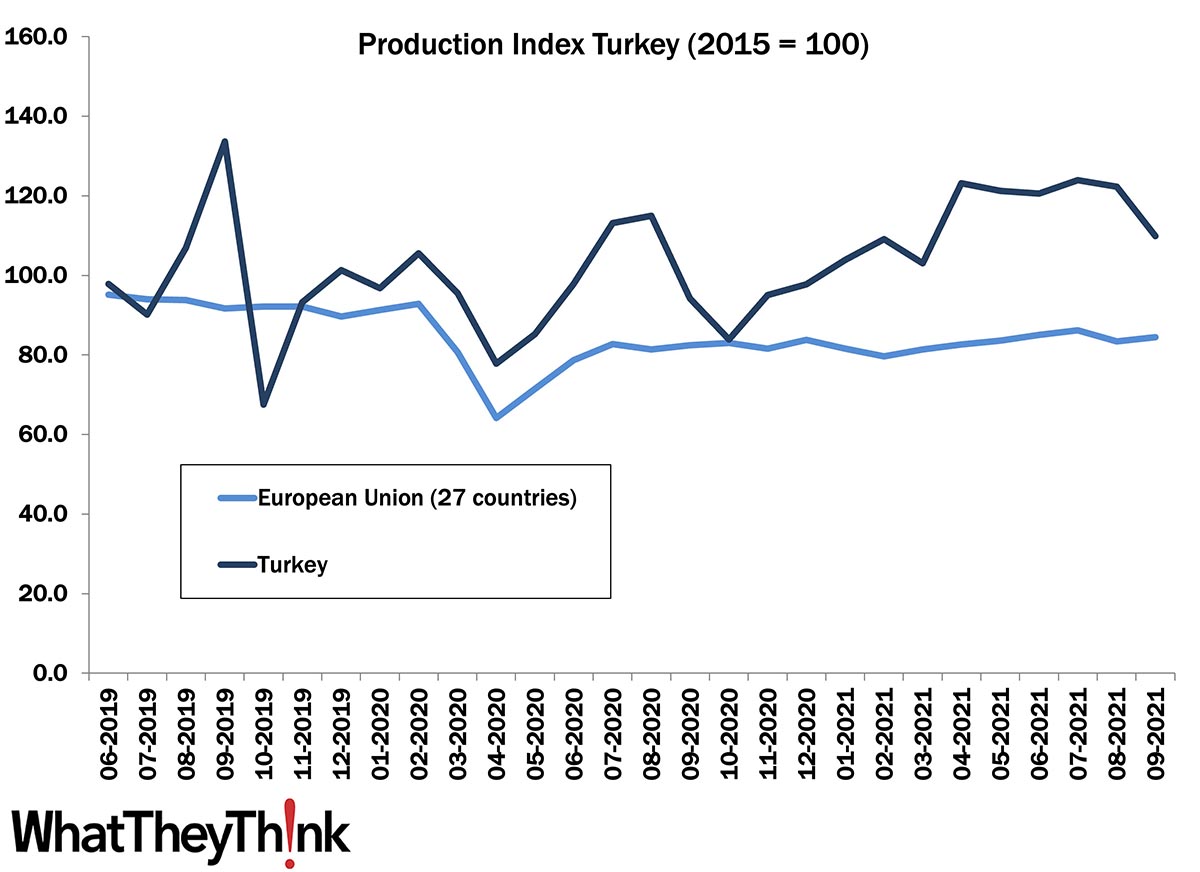
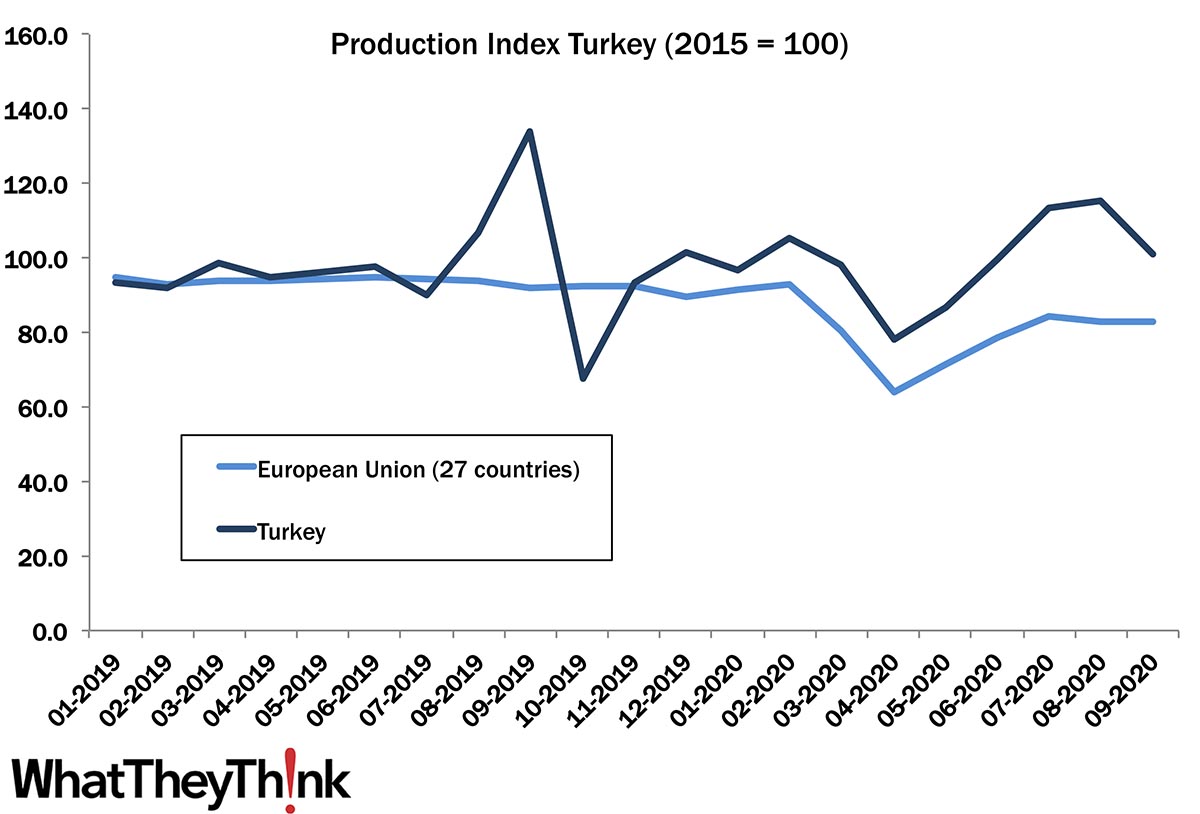
European Print Industry Snapshot: Turkey
Published: January 25, 2022
In this bimonthly series, WhatTheyThink is presenting the state of the printing industry in different European countries based on the latest monthly production numbers. This week, we take an updated look at the printing industry in Turkey. Full Analysis
November Shipments: Reversion to the Mean
Published: January 21, 2022
November 2021 printing shipments came in at $6.99 billion, down from $7.29 billion in October, and the first month that shipments dropped since early summer. Year to date, January-to-November shipments are $75.56 billion, only a bit off 2020’s January-to-November number of $76.36. If we have a really good December, 2021 could come in slightly above 2020. Full Analysis
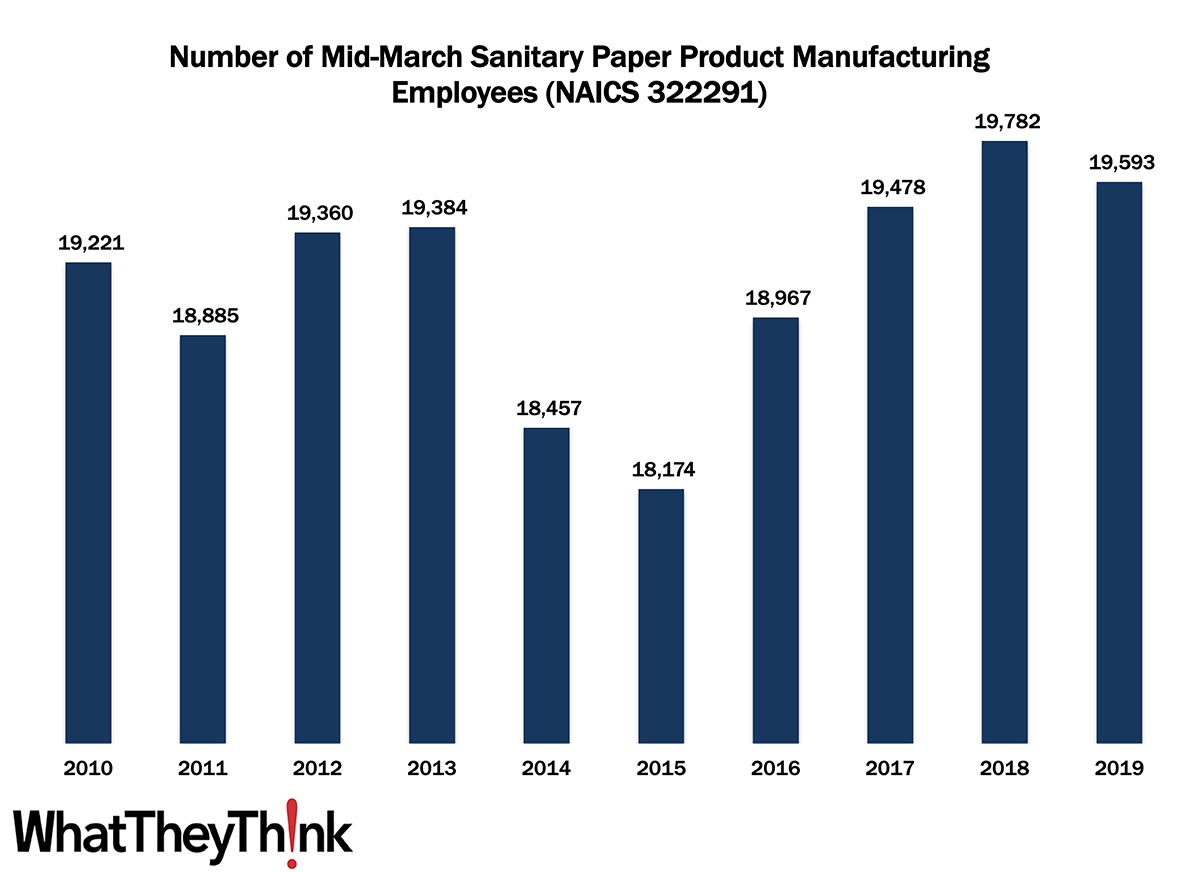
Sanitary Paper Product Manufacturing Employment—2010–2019
Published: January 14, 2022
According to County Business Patterns, in 2010, there were 19,221 employees in NAICS 322291 (Sanitary Paper Product Manufacturing establishments). This NAICS category bounced up and down over the course of the 2010s, ending with 19,593 employees in 2019. In macro news: CPI increased 0.5% in December. Full Analysis
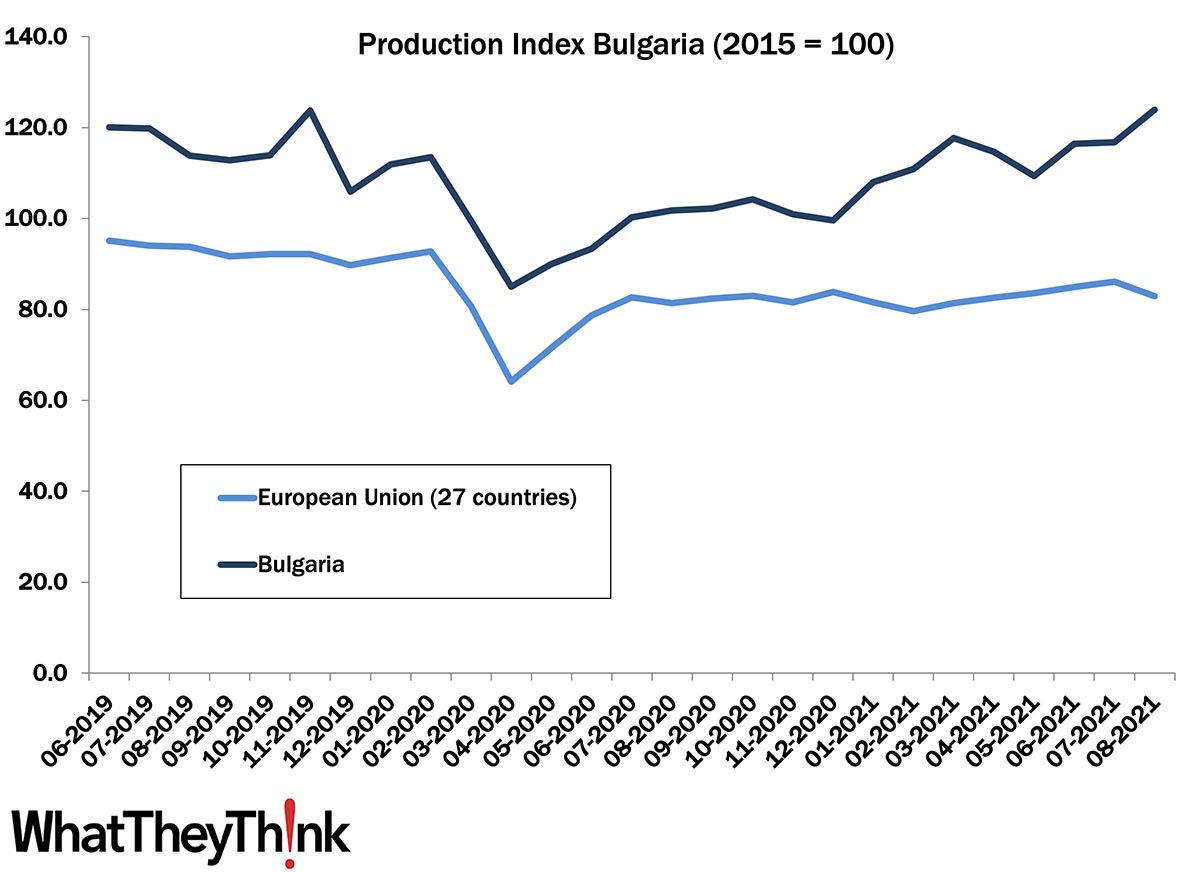
European Print Industry Snapshot: Bulgaria
Published: January 11, 2022
In this bimonthly series, WhatTheyThink is presenting the state of the printing industry in different European countries based on the latest monthly production numbers. This week, we take an updated look at the printing industry in Bulgaria. Full Analysis
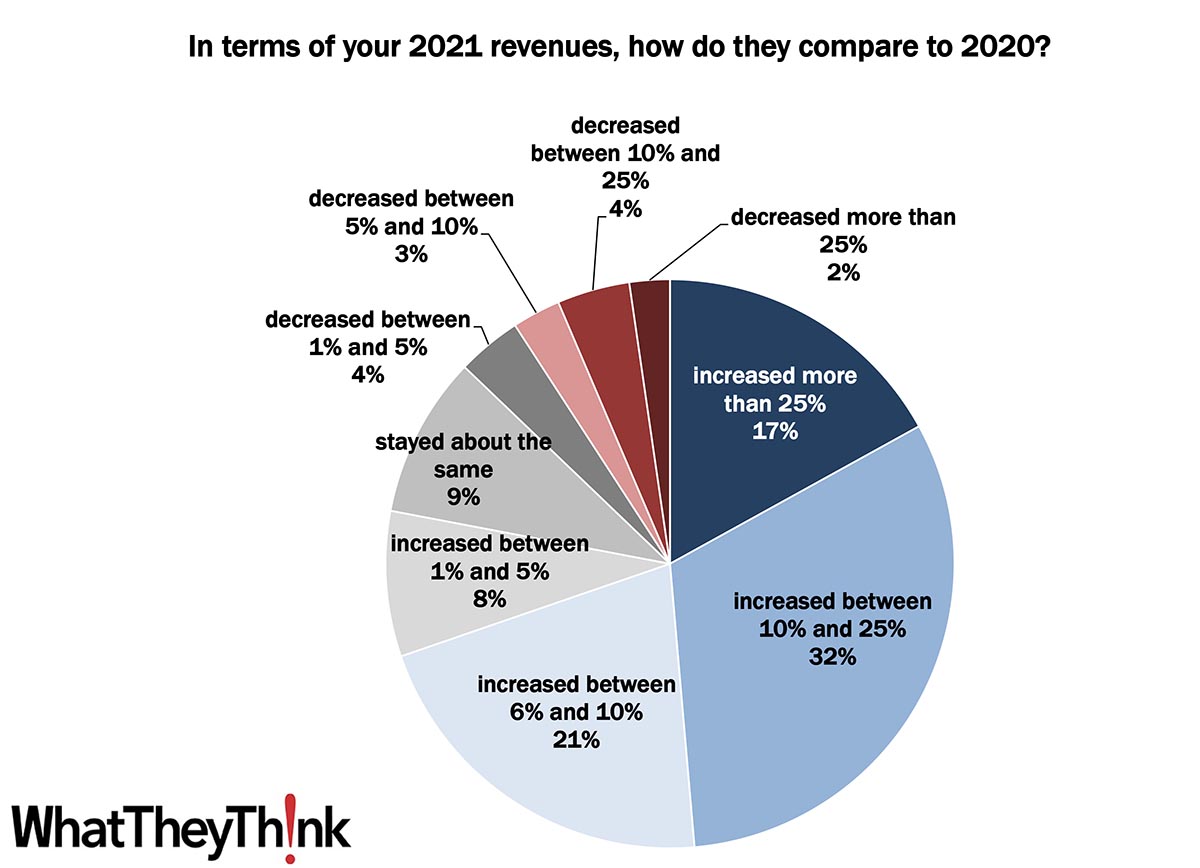
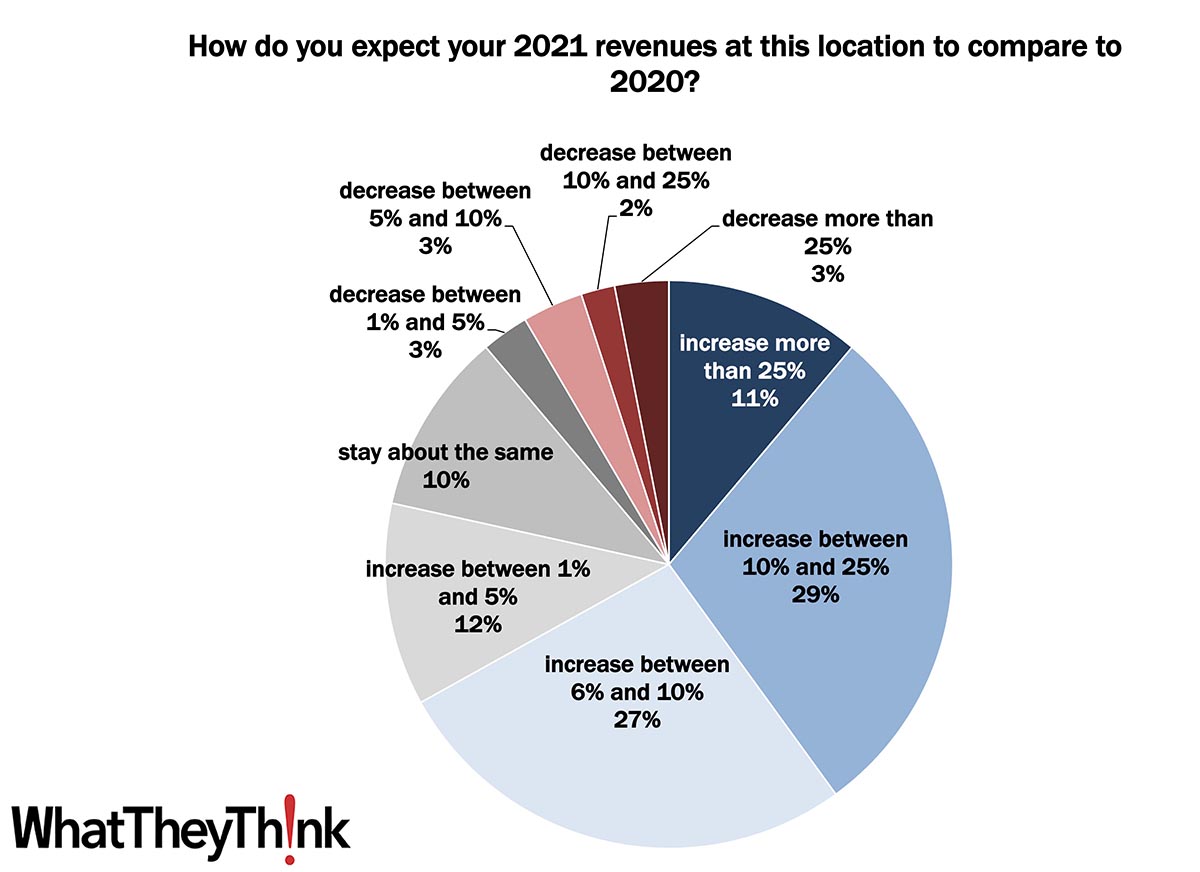
Preliminary 2021 Business Conditions: Help Ruin This Chart!
Published: January 7, 2022
We are sifting through the preliminary data from our 2021 Print Outlook Survey, and so far we have found that 17% of print businesses reported that revenues in 2021 increased more than 25% over 2020, and a further one-third (32%) saw revenues up 10–25%. But our survey is still open, so here is your chance to wreck this chart. Full Analysis
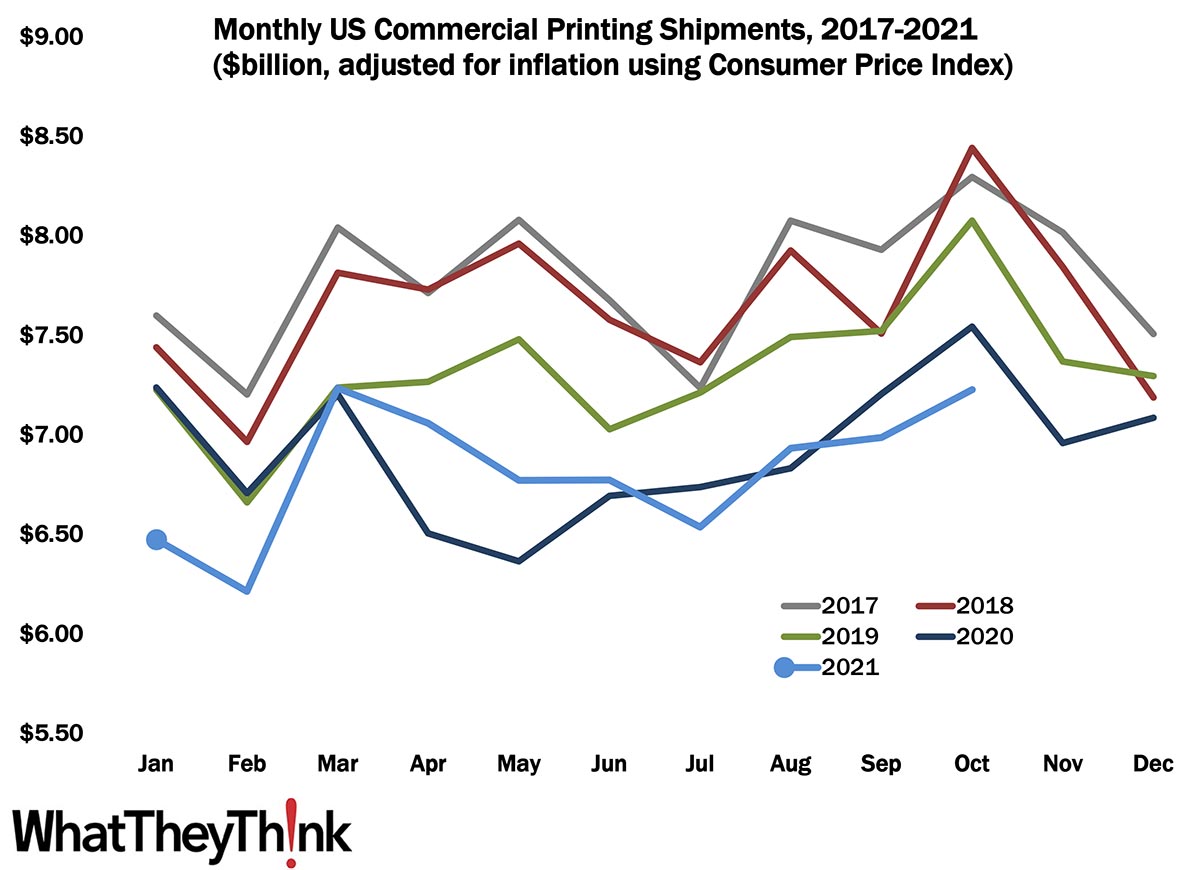
October Shipments: Still On the Rise
Published: December 17, 2021
October 2021 printing shipments came in at $7.23 billion, up from September’s $6.99 billion. This is the third month in a row in which shipments increased. Year to date, January-to-October shipments are $68.21 billion, a bit off 2020’s January-to-October number of $69.03. Unless November and December are higher than expected, 2021 will come in slightly below 2020. Full Analysis
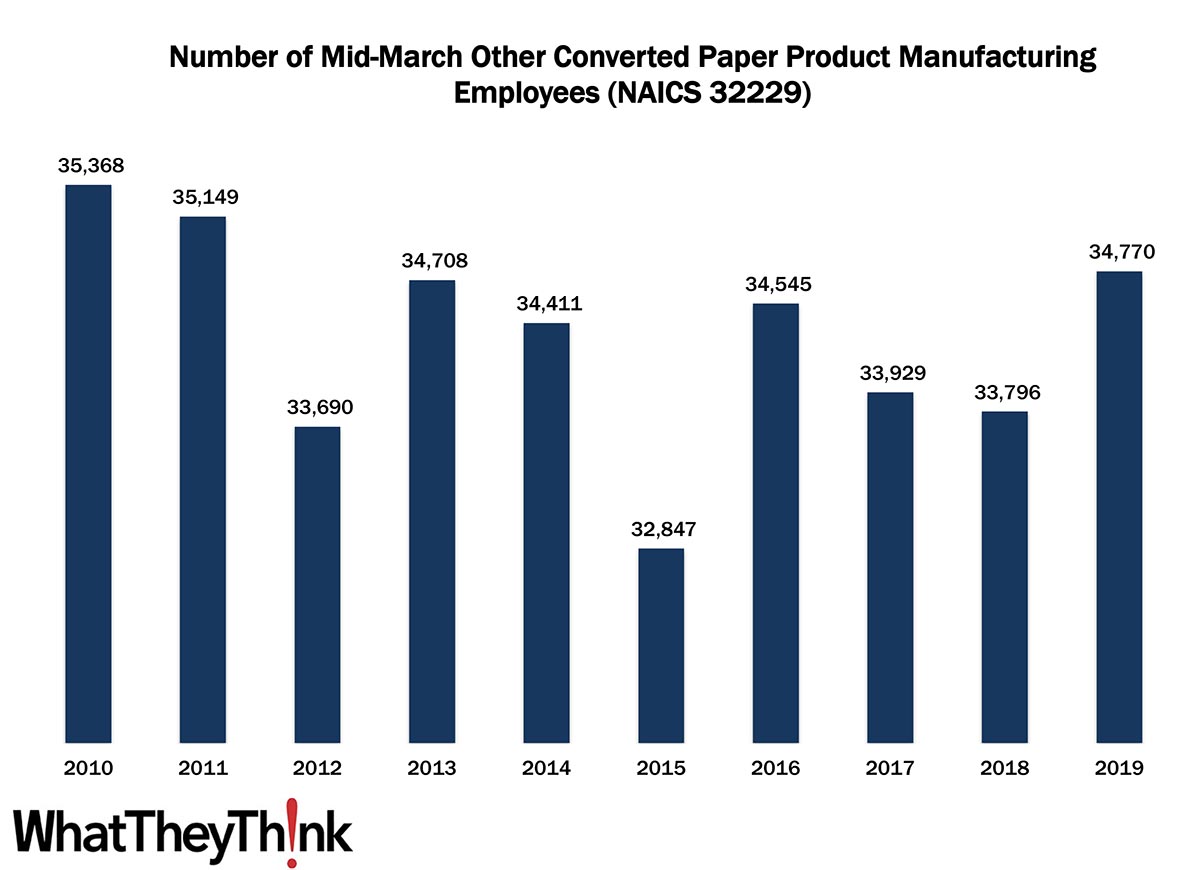
Other Converted Paper Product Manufacturing Employment—2010–2019
Published: December 10, 2021
According to County Business Patterns, in 2010, there were 35,368 employees in NAICS 32229 (Other Converted Paper Product Manufacturing establishments). This NAICS category bounced up and down over the course of the 2010s, ending with 34,770 employees in 2019. In macro news: Beige Alert! Full Analysis
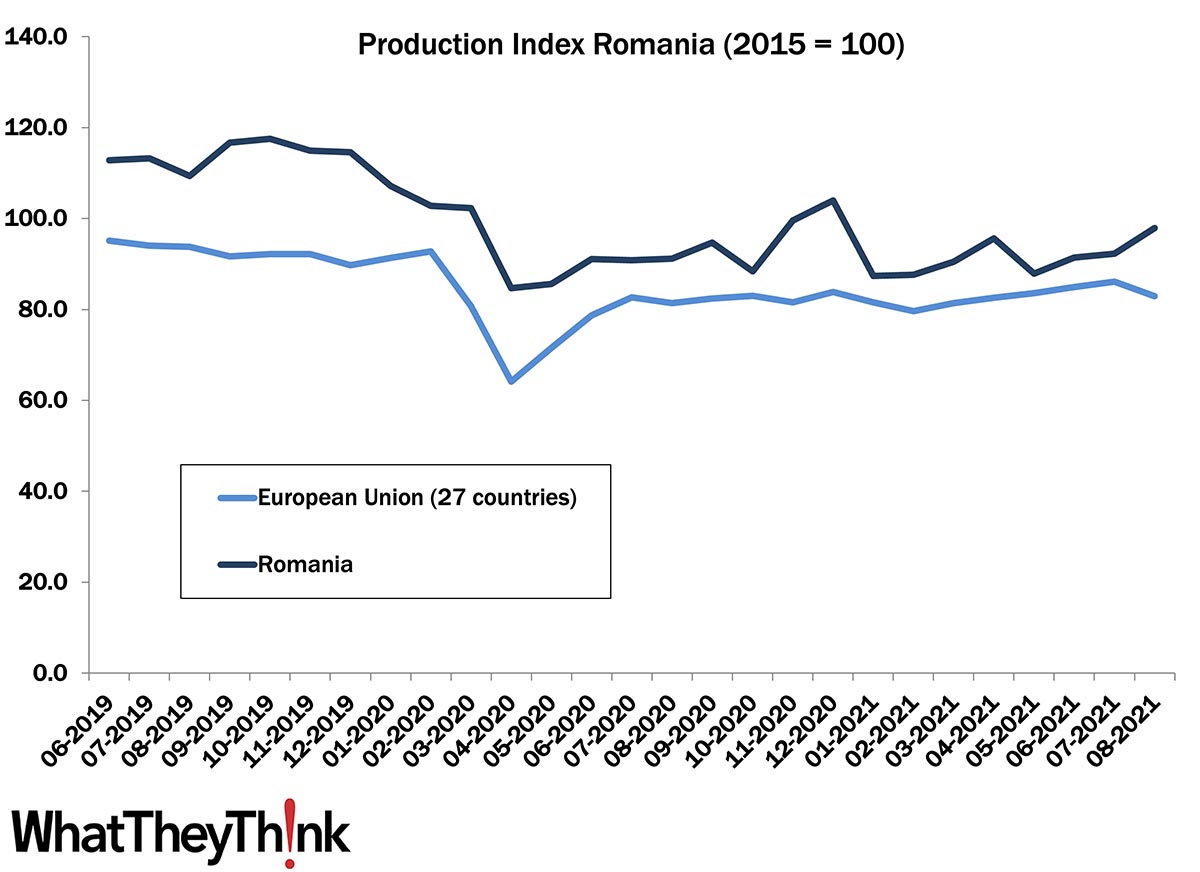
European Print Industry Snapshot: Romania
Published: December 7, 2021
In this bimonthly series, WhatTheyThink is presenting the state of the printing industry in different European countries based on the latest monthly production numbers. This week, we take an updated look at the printing industry in Romania. Full Analysis
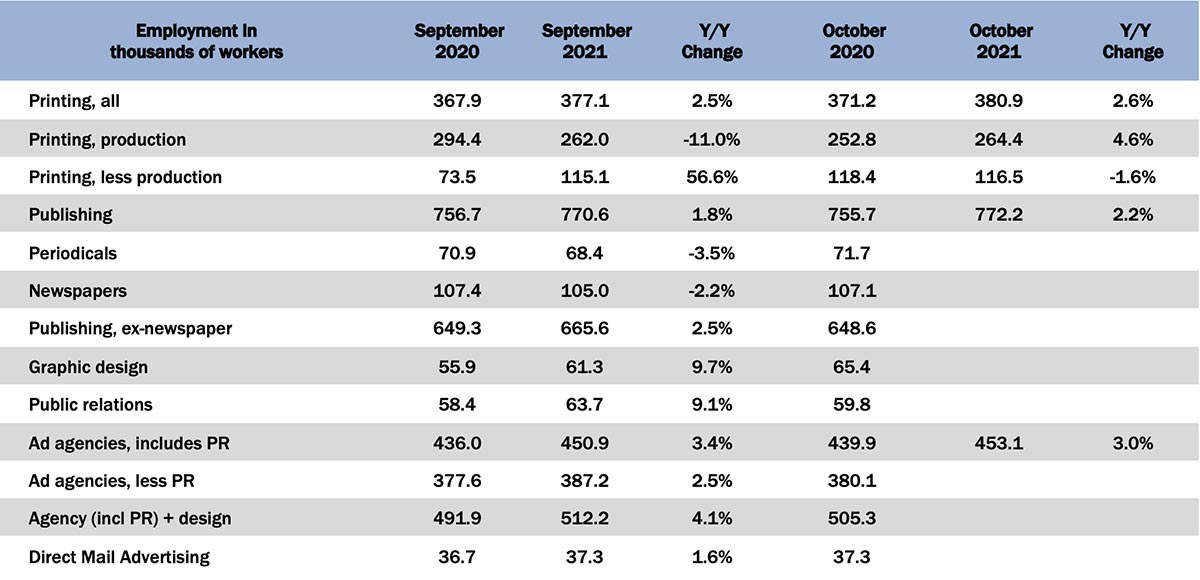
October Graphic Arts Employment—Print Production Up, Non-Production Also Up
Published: December 3, 2021
In October 2021, all printing employment was up +1.0% from September, with production employment up +0.9%, and non-production printing employment up +1.2%. Full Analysis
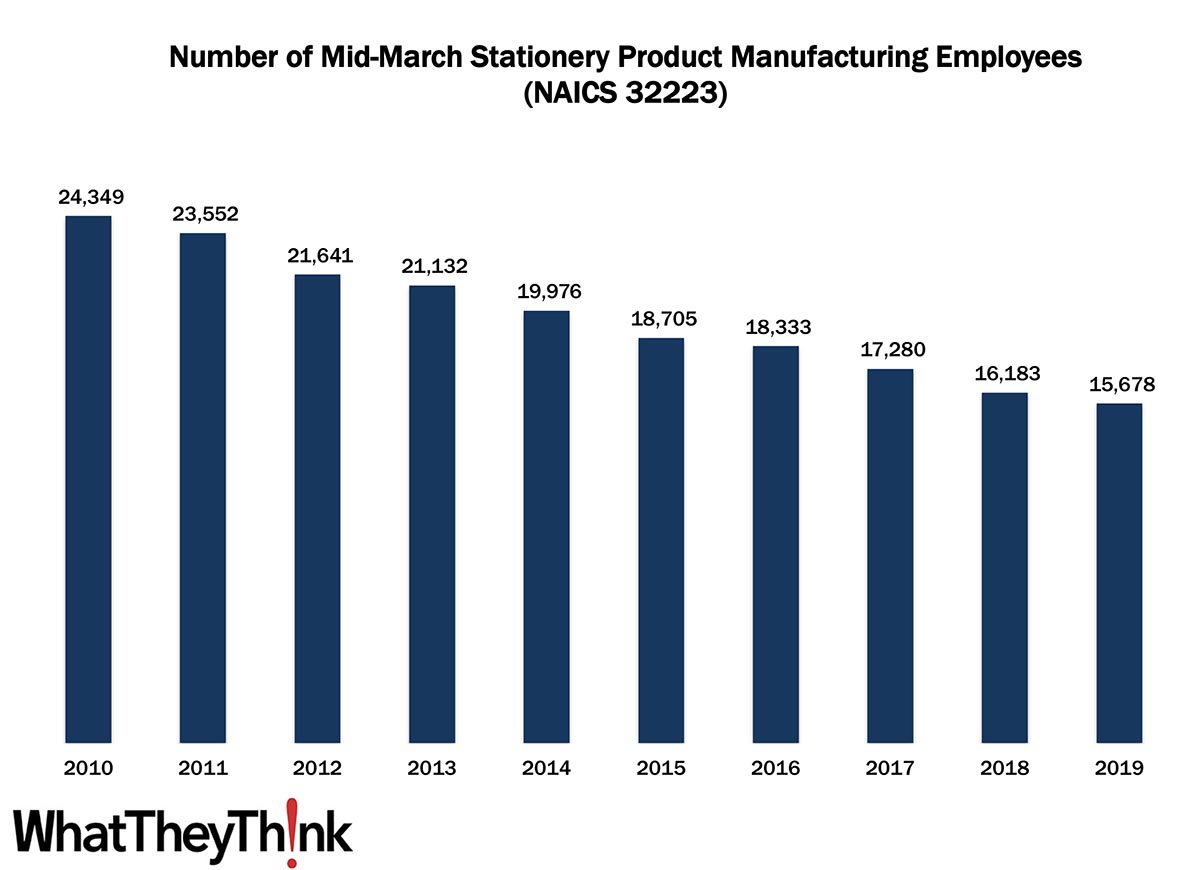
Stationery Product Manufacturing Employment—2010–2019
Published: November 19, 2021
According to County Business Patterns, in 2010, there were 24,349 employees in NAICS 32223 (Stationery Product Manufacturing establishments). This NAICS category declined slowly over the rest of the decade, ending with 15,678 employees in 2019. Also: following up a BoSacks tweet about newspaper circulation. Full Analysis
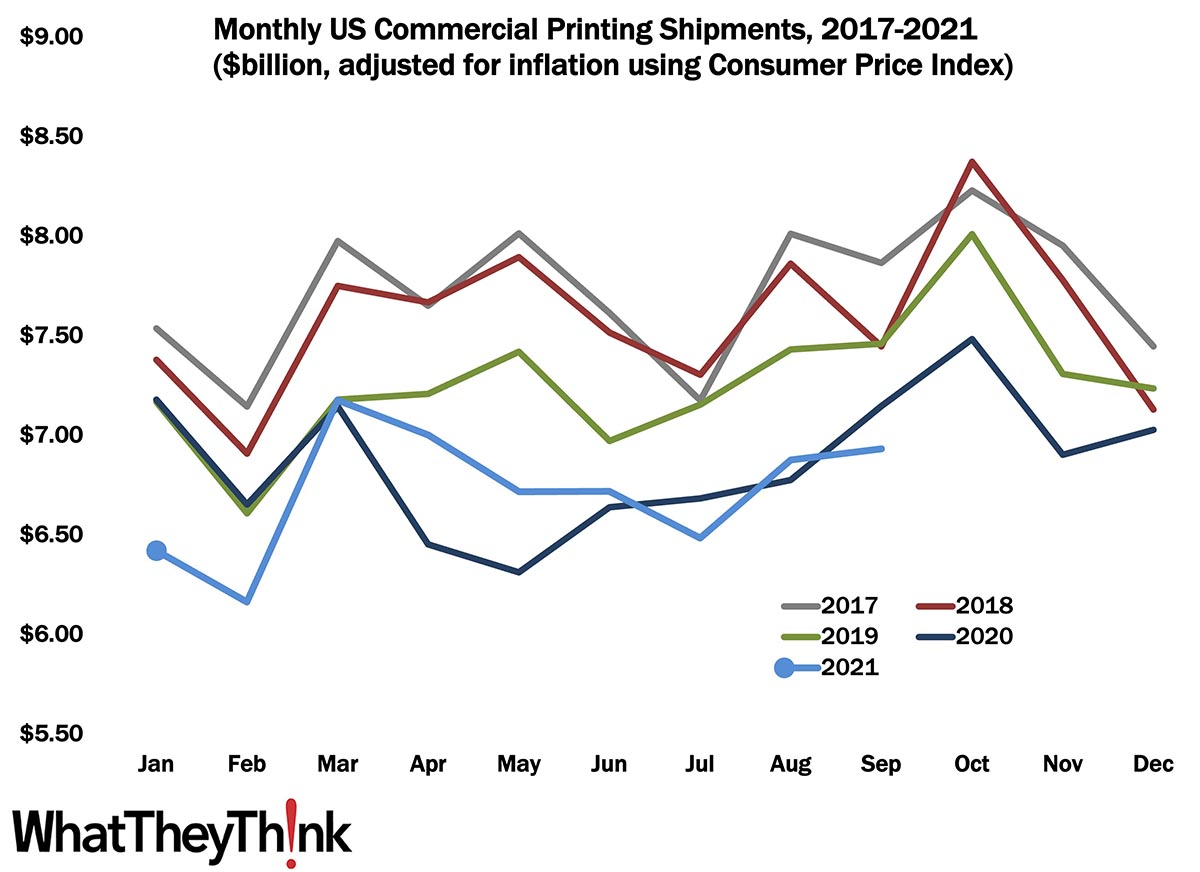
September Shipments: We Got Good News and We Got Bad News
Published: November 12, 2021
September 2021 printing shipments came in at $6.93 billion, up from August’s $6.87 billion. It’s not a massive increase, but we’ll take it. Year to date, January-to-September shipments are $60.48 billion, a bit off 2020’s January-to-September number of $60.97. Can we close the gap in Q4? Full Analysis
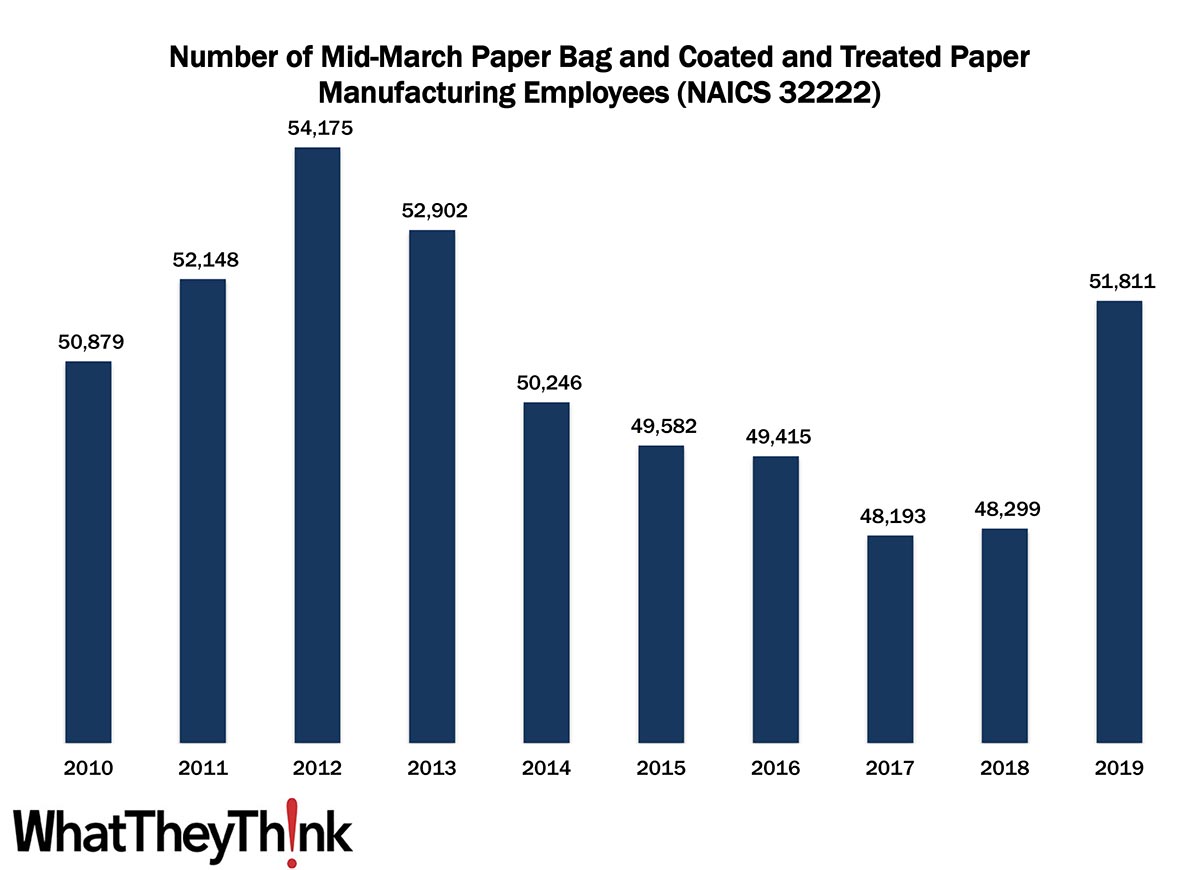
Paper Bag and Coated and Treated Paper Manufacturing Employment—2010–2019
Published: November 5, 2021
According to County Business Patterns, in 2010, there were 50,879 employees in NAICS 32222 (Paper Bag and Coated and Treated Paper Manufacturing establishments). This NAICS category peaked two years later at 54,175, declined slowly over the rest of the decade before shooting back up to 51,811 employees in 2019. In macro news, Q3 GDP growth is up 2.0%. Full Analysis
September Graphic Arts Employment—Print Production Up, Non-Production Down
Published: October 29, 2021
In September 2021, all printing employment was up +0.8% from August, production employment up +1.1%, and non-production printing employment up +0.3%. Full Analysis
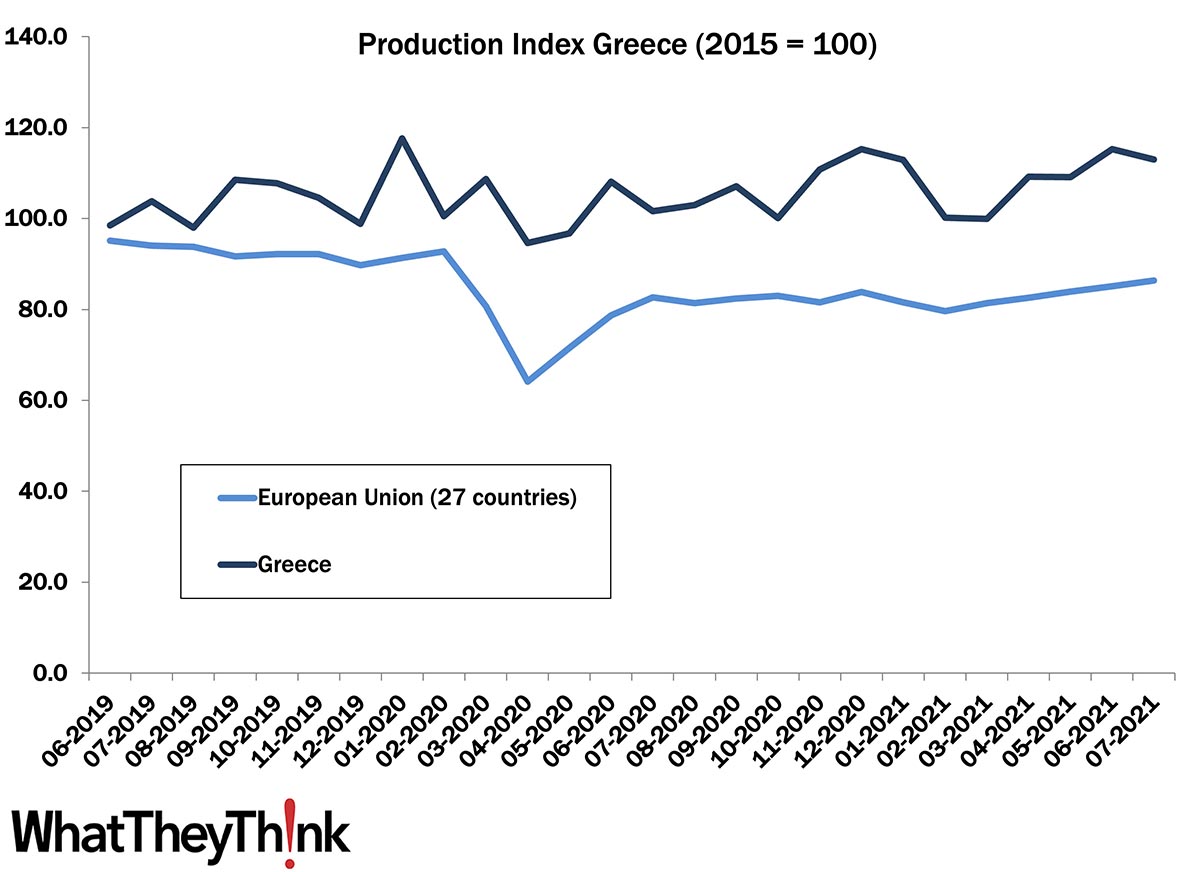
European Print Industry Snapshot: Greece
Published: October 26, 2021
In this bimonthly series, WhatTheyThink is presenting the state of the printing industry in different European countries based on the latest monthly production numbers. This week, we take an updated look at the printing industry in Greece. Full Analysis
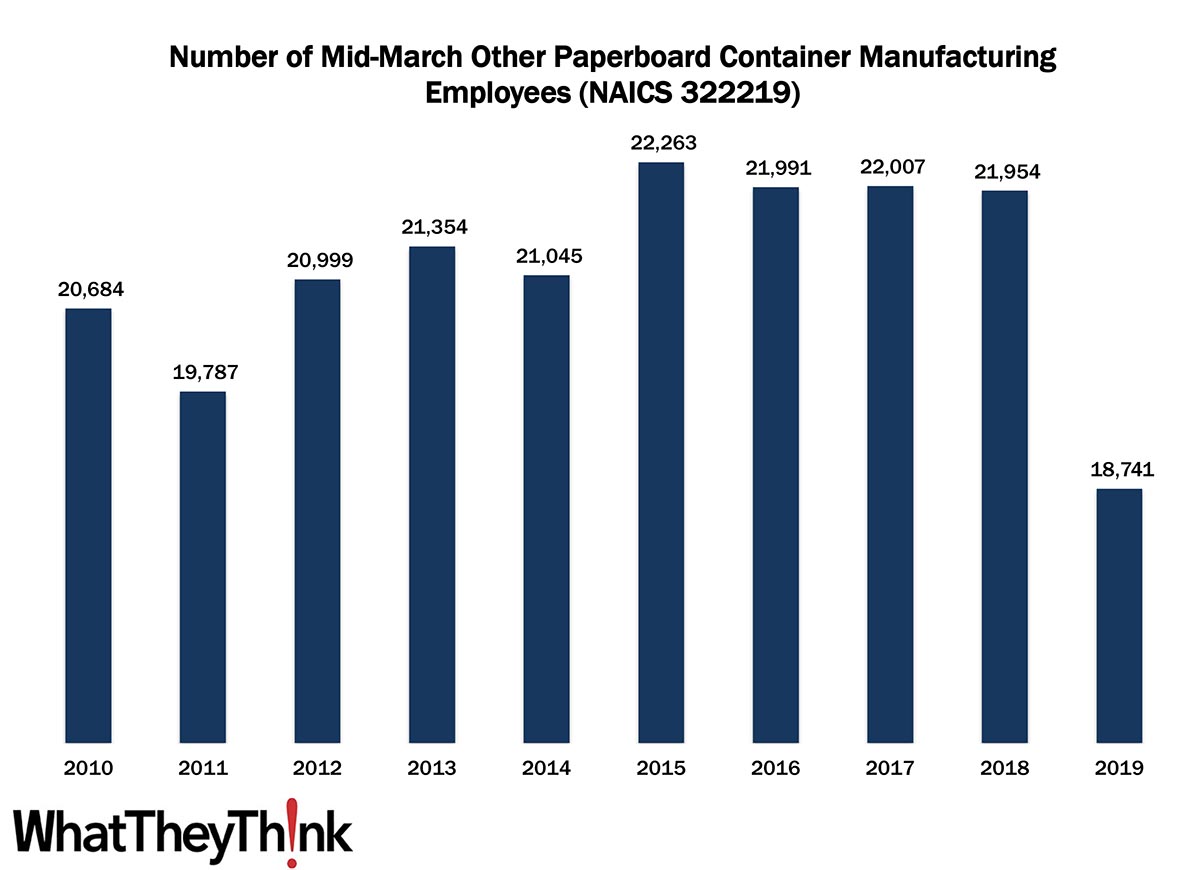
Other Paperboard Container Manufacturing Employment—2010–2019
Published: October 22, 2021
According to County Business Patterns, in 2019, there were 18,741 employees in NAICS 322219 (Other Paperboard Container Manufacturing establishments), a drop from 21,954 employees a year earlier, and the lowest ebb for this NAICS category. In macro news, new business formation goes “bezonkers.” Full Analysis
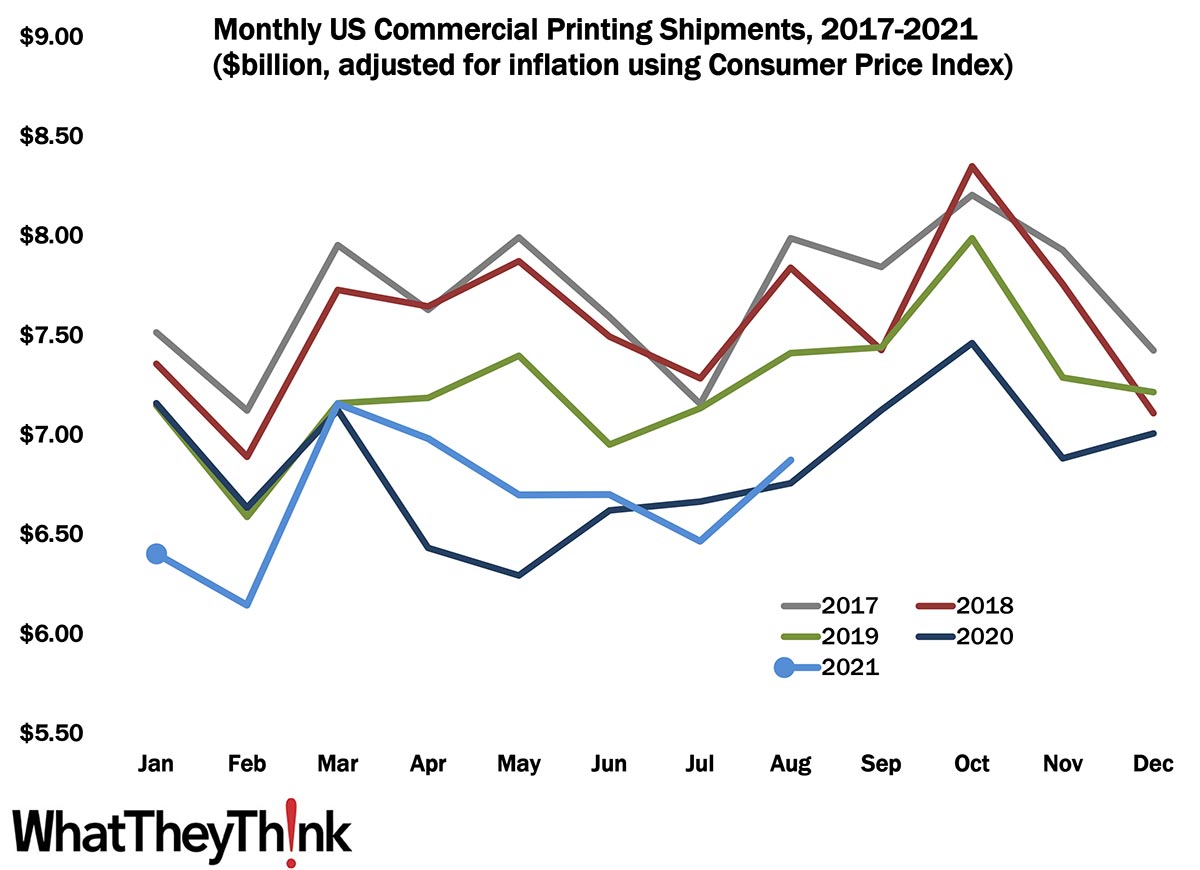
August Shipments: Summer Ends on a High Note
Published: October 15, 2021
August 2021 printing shipments came in at $6.87 billion, up from July’s $6.47 billion. Year to date, January-to-August shipments are $53.42 billion, not far off 2020’s January-to-August number of $53.68. Full Analysis
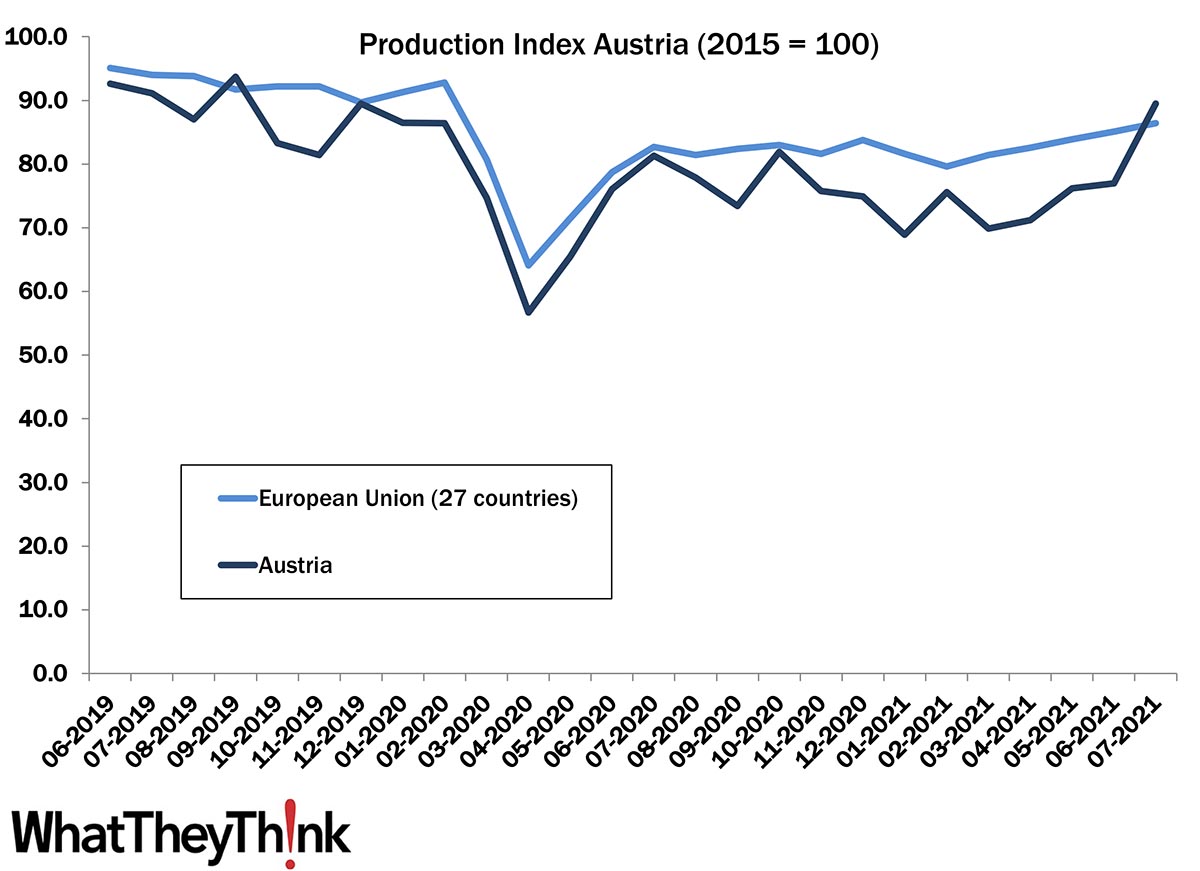
European Print Industry Snapshot: Austria
Published: October 12, 2021
In this bimonthly series, WhatTheyThink is presenting the state of the printing industry in different European countries based on the latest monthly production numbers. This week, we take an updated look at the printing industry in Austria. Full Analysis
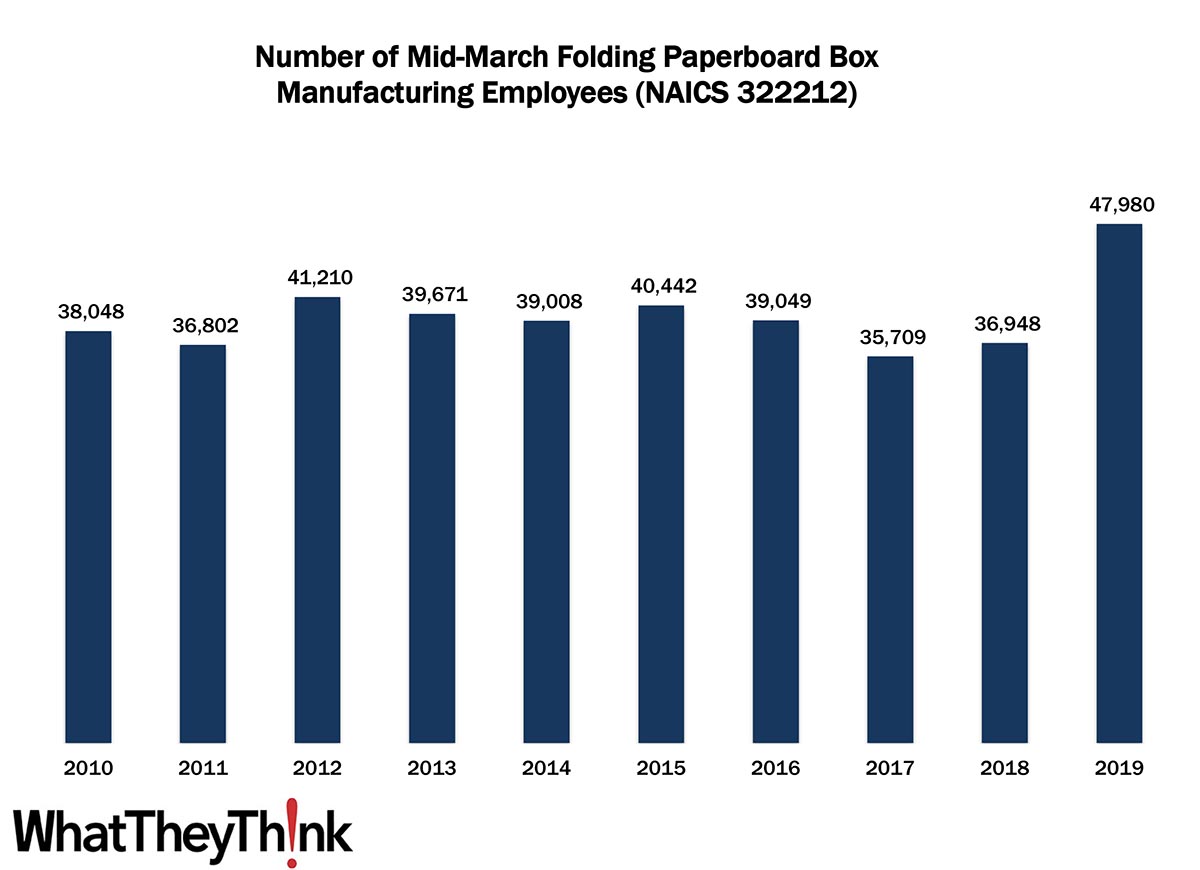
Folding Paperboard Box Manufacturing Employment—2010–2019
Published: October 8, 2021
According to County Business Patterns, in 2010, there were 30,048 employees in NAICS 322212 (Folding Paperboard Box Manufacturing establishments). Employment in this category stayed fairly steady throughout the decade, then spiked in 2019 to 47,980 employees. In macro news, sales of light vehicle sales plummeted in September 2021, even as profits reached record highs. Full Analysis
August Graphic Arts Employment—Staying on the Plateau
Published: October 1, 2021
In August 2021, all printing employment was up +0.4% from July, production employment up +0.4%, and non-production printing employment also up +0.4%. Full Analysis
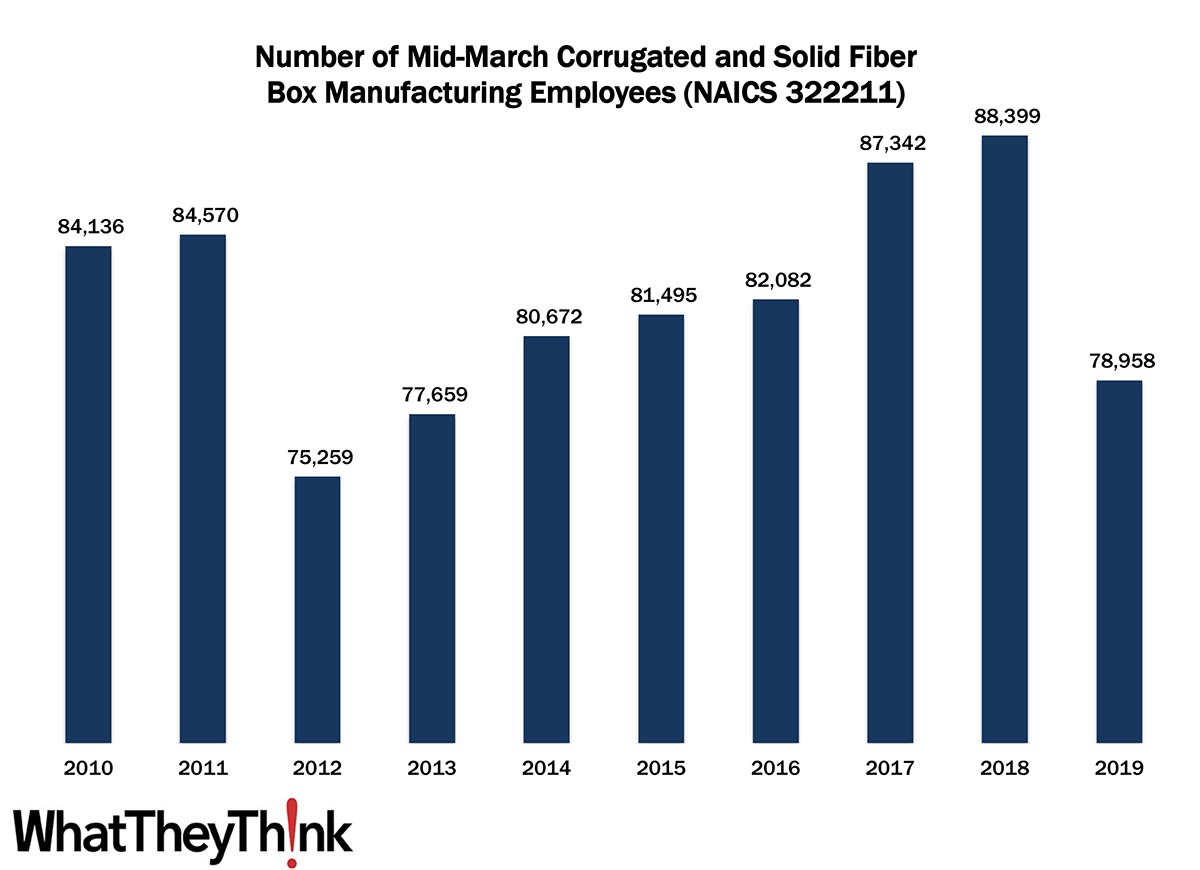
Corrugated and Solid Fiber Box Manufacturing Employment—2010–2019
Published: September 24, 2021
According to County Business Patterns, in 2010, there were 84,136 employees in NAICS 32221 (Corrugated and Solid Fiber Box Manufacturing establishments). Employment in this category dropped abruptly in 2012, then continued to rise over the course of the decade, peaking in 2018 at 88,399 before dropping again in 2019. In macro news, three estimates of Q3 GDP. Full Analysis
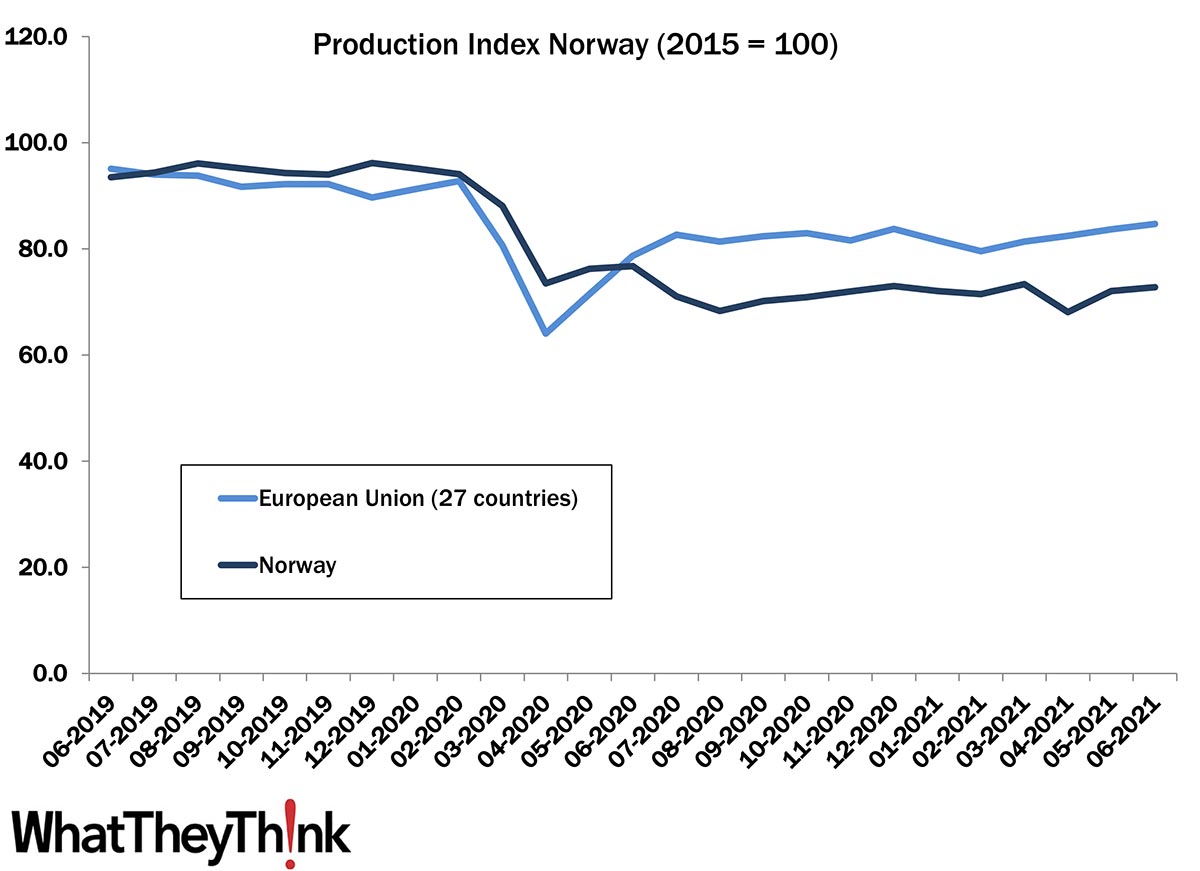
European Print Industry Snapshot: Norway
Published: September 21, 2021
In this bimonthly series, WhatTheyThink is presenting the state of the printing industry in different European countries based on the latest monthly production numbers. This week, we take a look at the printing industry in Norway. Full Analysis
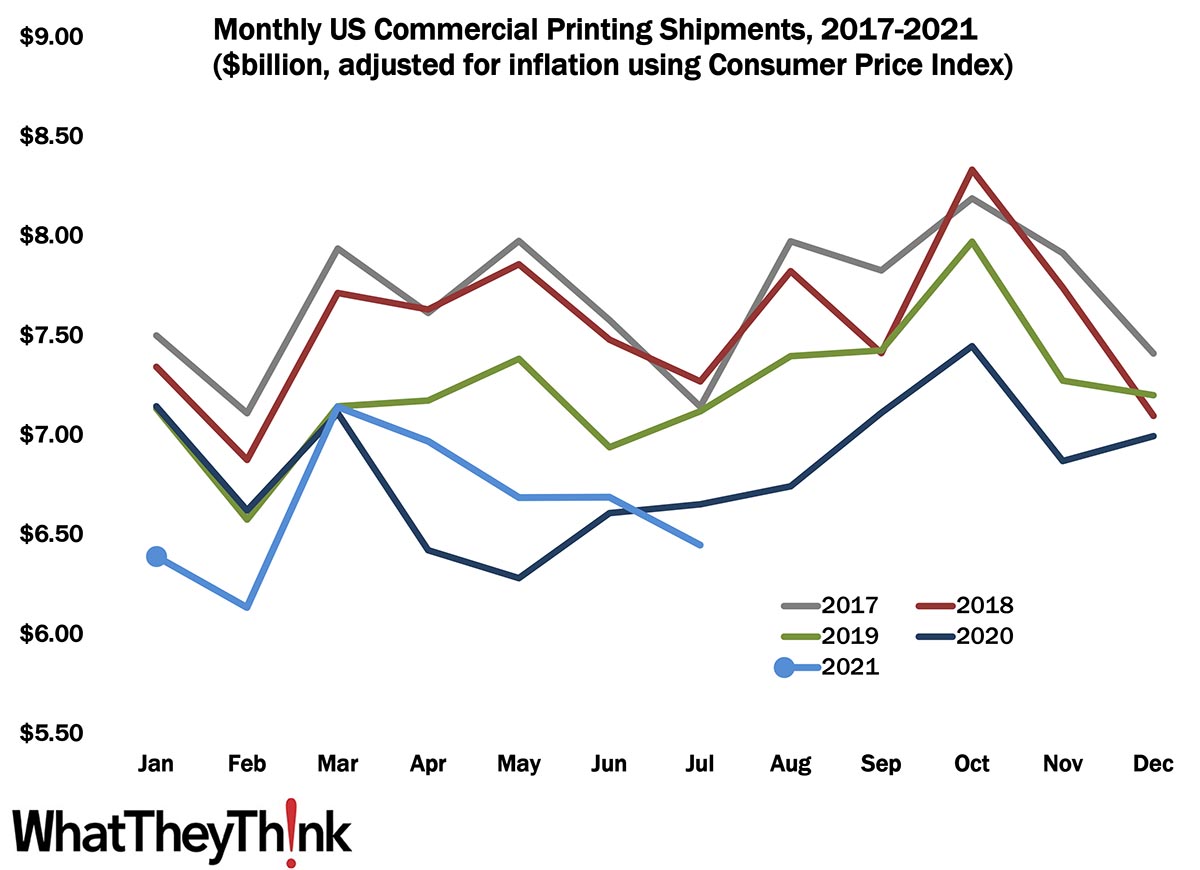
July Shipments: Back on the Decline
Published: September 17, 2021
July 2021 printing shipments came in at $6.45 billion, down from June’s $6.69 billion. Year to date, January-to-July shipments are $46.44 billion. At this point in 2020, year-to-date shipments were slightly higher at $46.83. The recovery is proving more challenging than the actual pandemic, it seems. Full Analysis
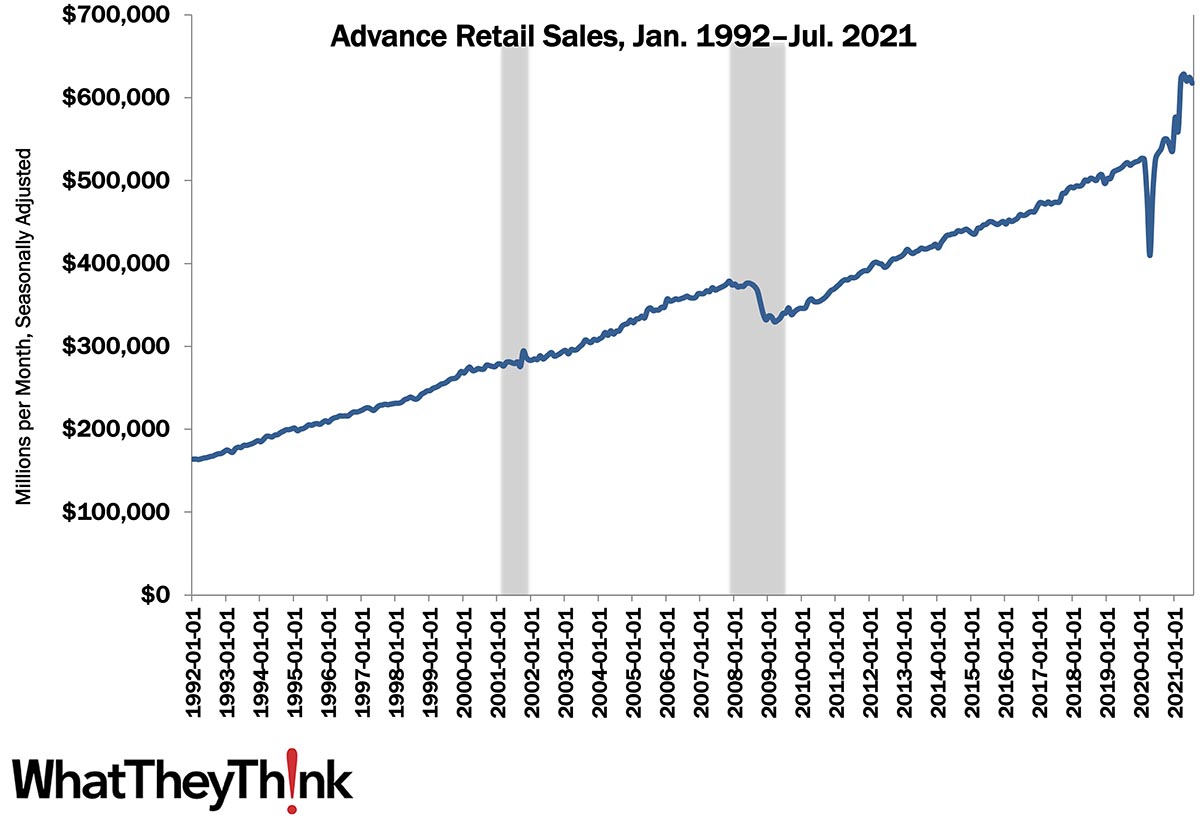
Two Indicators: Retail Sales and Industrial Production
Published: September 10, 2021
This week’s Friday data dump looks at two macroeconomic indicators that will give us some sense of how we are bouncing back from the pandemic—Retail sales and the Industrial Production Index. Full Analysis
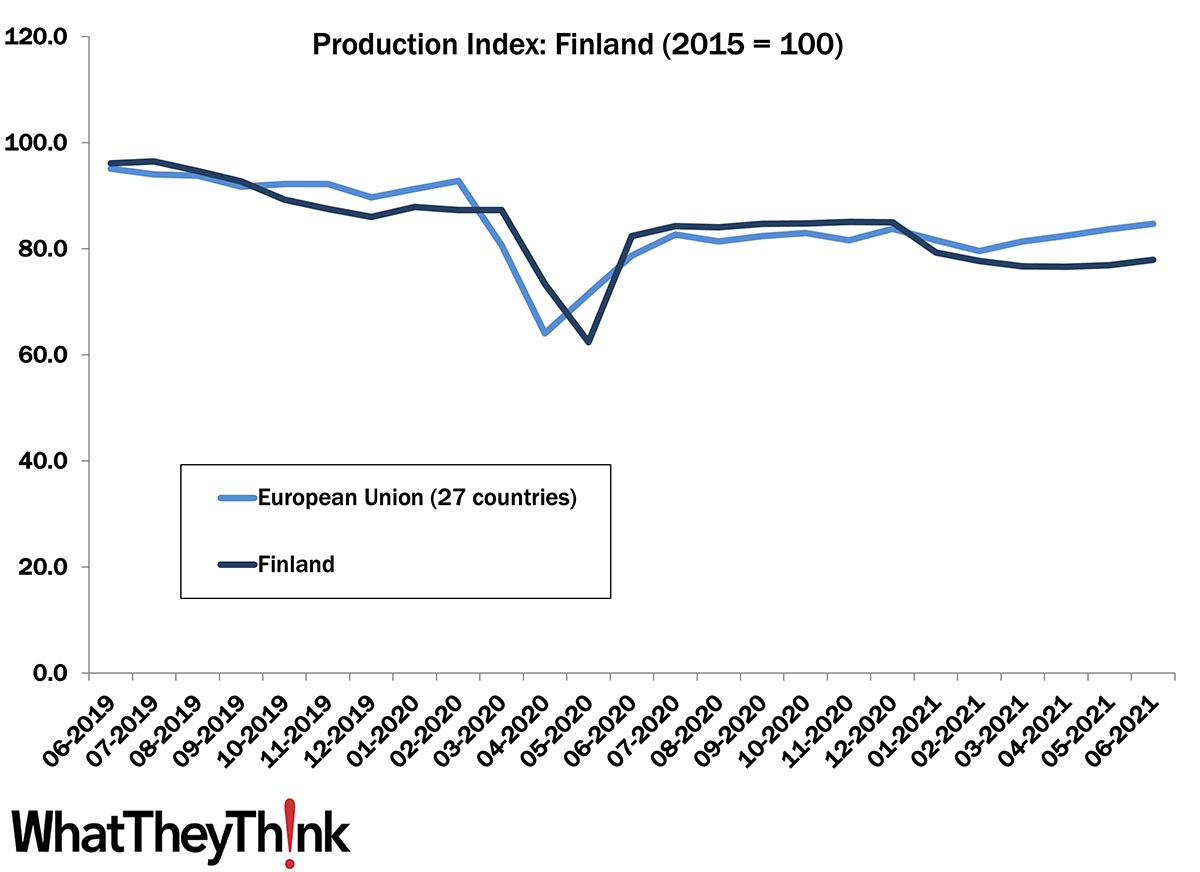
European Print Industry Snapshot: Finland
Published: September 7, 2021
In this bimonthly series, WhatTheyThink is presenting the state of the printing industry in different European countries based on the latest monthly production numbers. This week, we take a look at the printing industry in Finland. Full Analysis
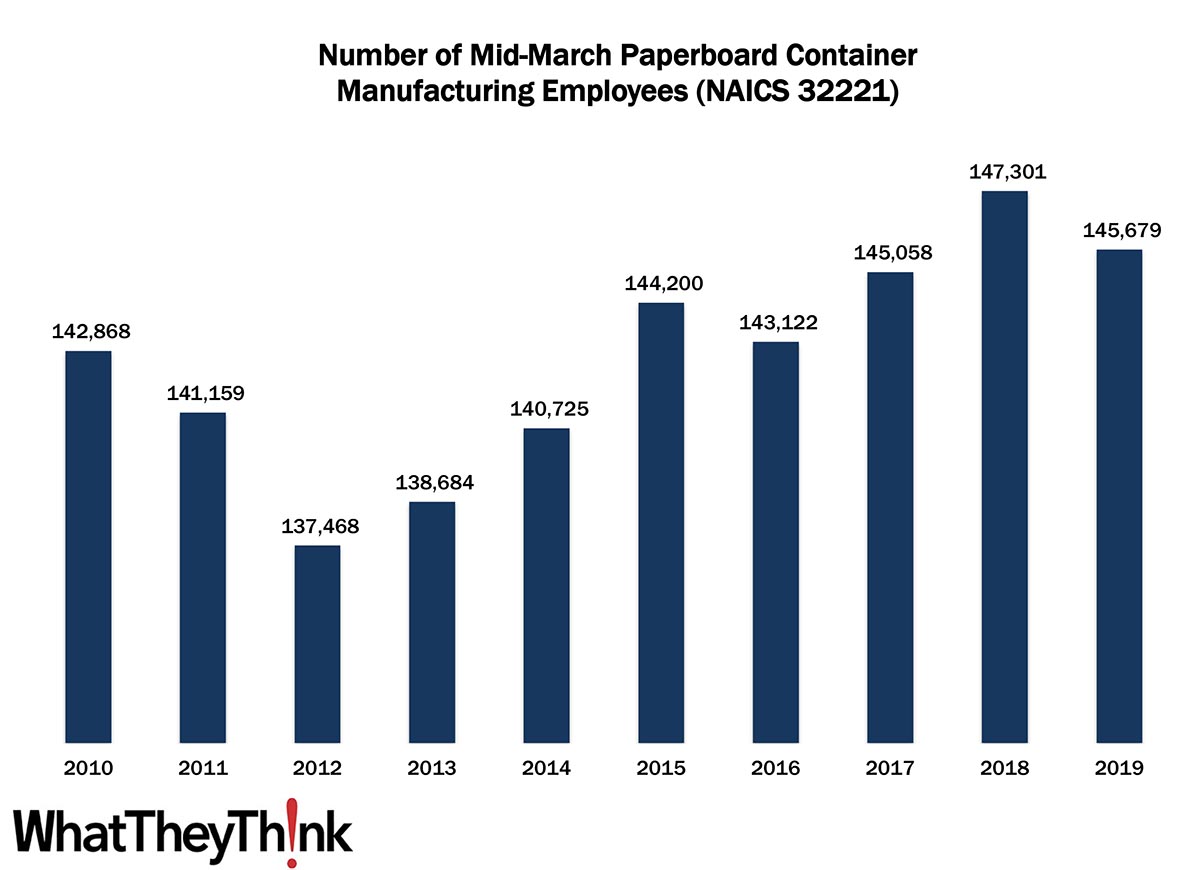
Paperboard Container Manufacturing Employment—2010–2019
Published: September 3, 2021
According to County Business Patterns, in 2010, there were 142,868 employees in NAICS 32221 (Paperboard Container Manufacturing establishments). Employment in this category dropped abruptly in 2011 and 2012, then continued to rise over the course of the decade, peaking in 2018 at 147,301 before dropping a bit in 2019. In macro news, office and mall vacancy rates are at historic highs, the pandemic having accelerated trends that had been well underway beforehand. Full Analysis
July Graphic Arts Employment—Reaching a Plateau
Published: August 27, 2021
In July 2021, all printing employment was down -0.2% from June, production employment up +0.7%, and non-production printing employment down -2.0%. Full Analysis
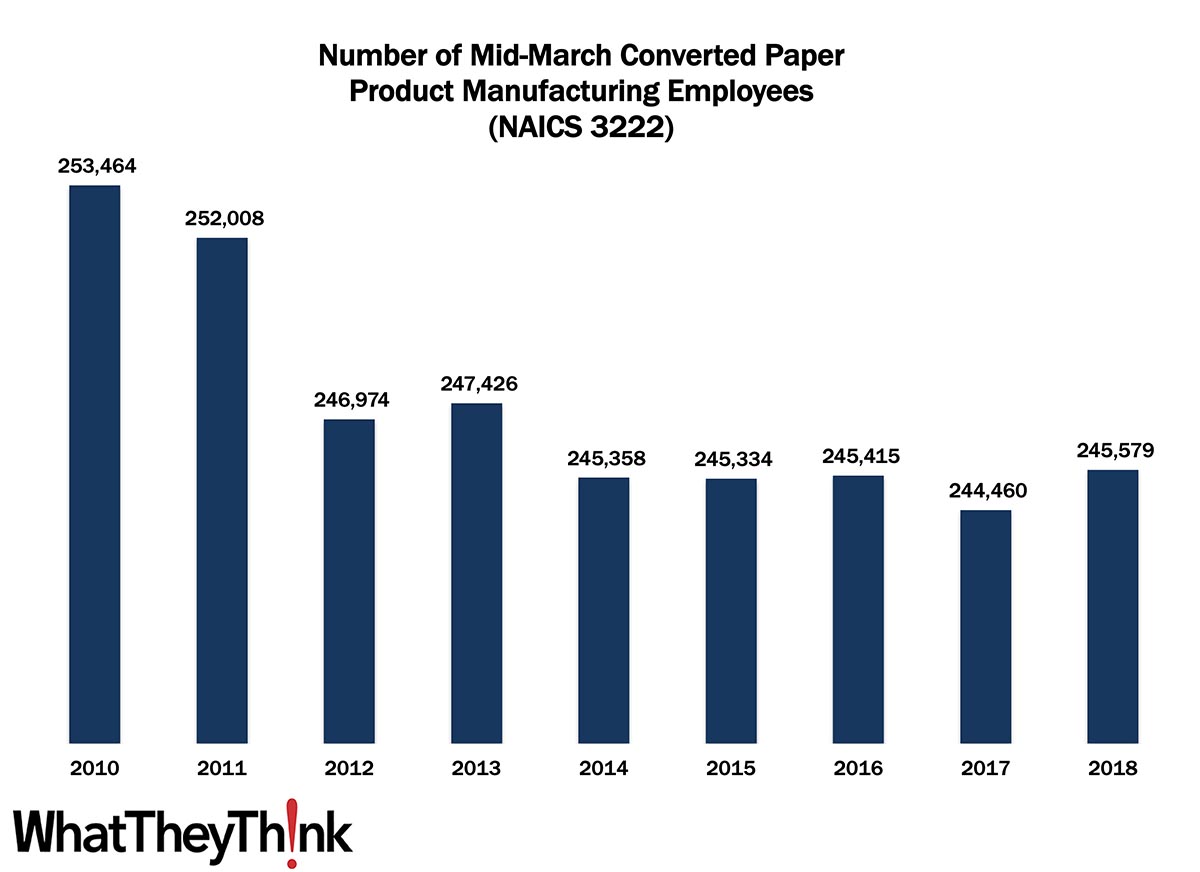
Converted Paper Product Manufacturing Employment—2010–2018
Published: August 20, 2021
According to County Business Patterns, in 2010, there were 253,464 employees in NAICS 3222 (Converted Paper Product Manufacturing establishments). Employment in this category dropped abruptly in 2012, then remained somewhat stable over the course of the decade and reaching 245,579 in 2018. In macro news, the American Institute of Architects (AIA) monthly Architecture Billings Index (ABI) show increased demand for architectural design services, good news for the signage industry. Full Analysis
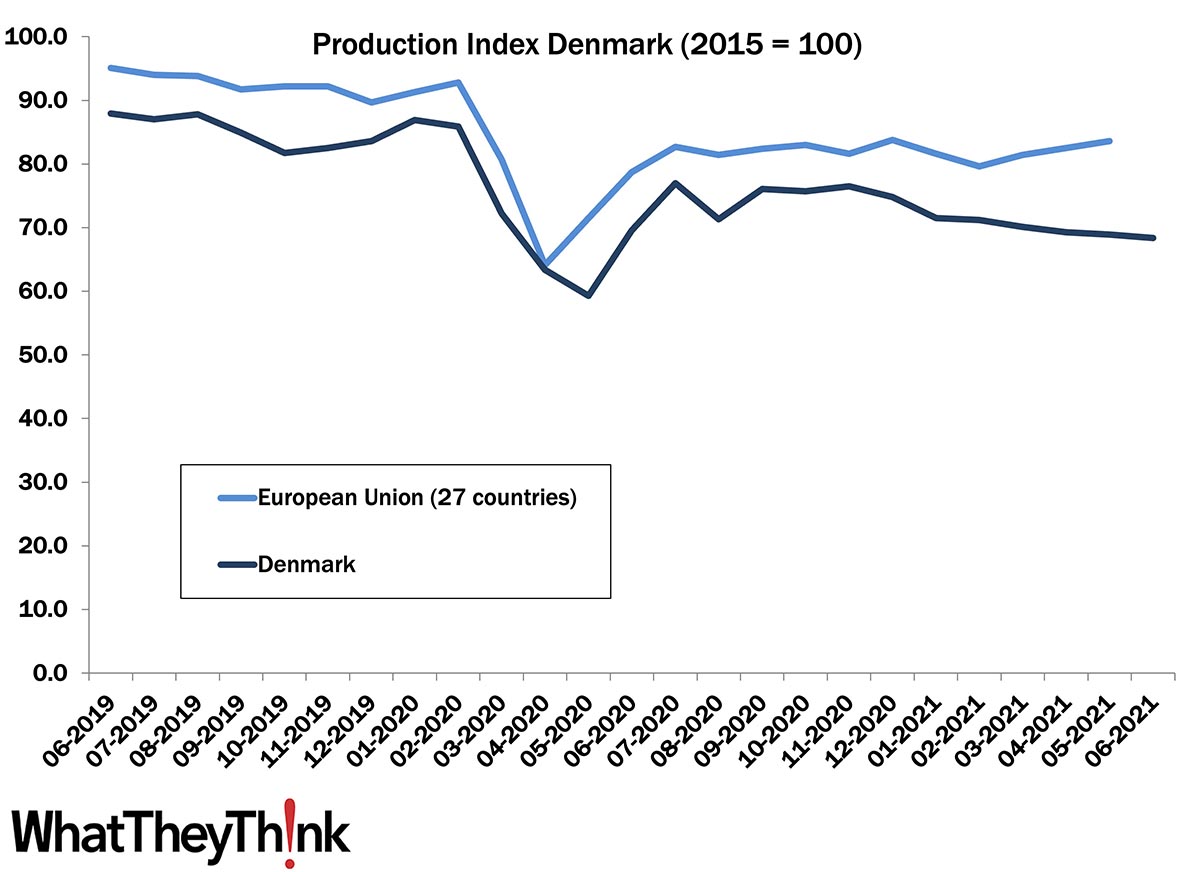
European Print Industry Snapshot: Denmark
Published: August 16, 2021
In this bimonthly series, WhatTheyThink is presenting the state of the printing industry in different European countries based on the latest monthly production numbers. This week, we take a look at the printing industry in Denmark. Full Analysis
June Shipments: A Lateral Move
Published: August 13, 2021
June 2021 printing shipments came in at $6.65 billion, unchanged from May. We usually see declines from May to June, but at least the lateral move has halted two months of declining shipments. Full Analysis
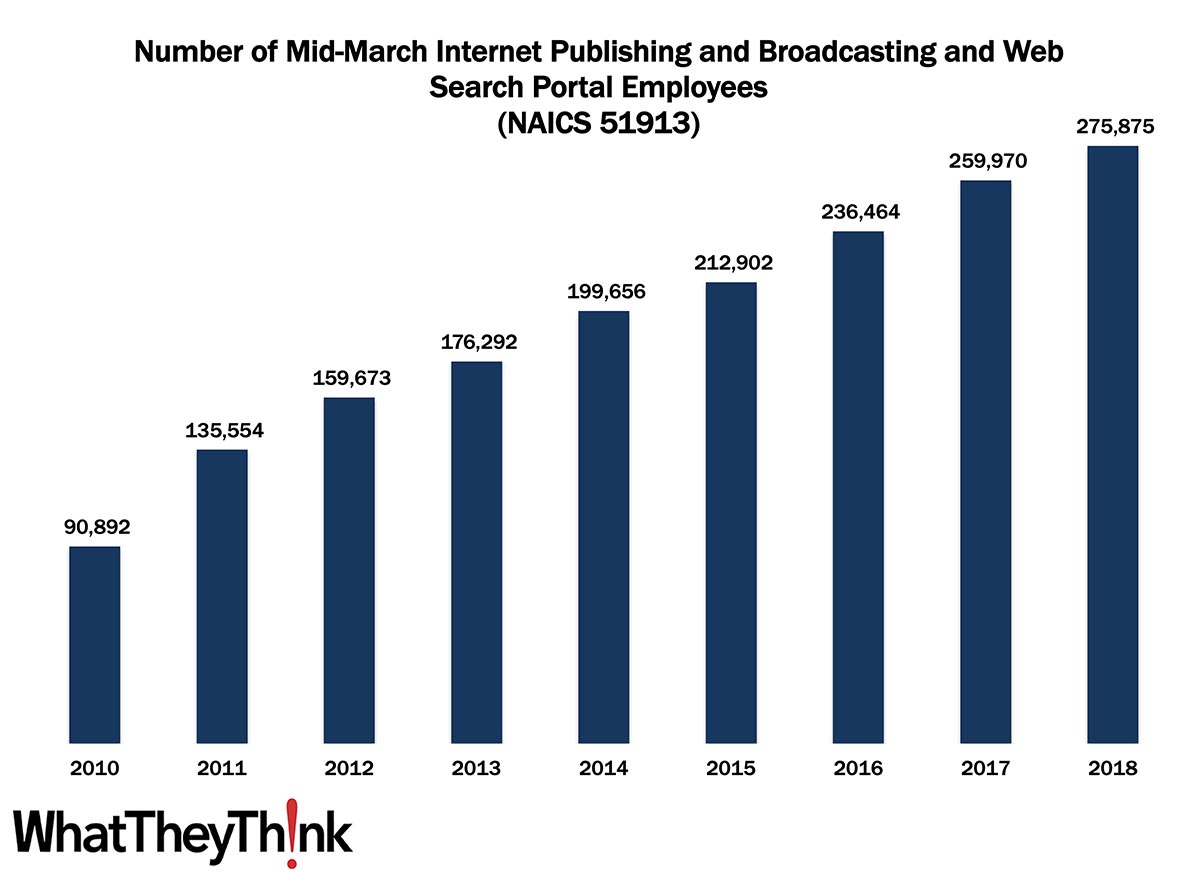
Internet Publishing Employment—2010–2018
Published: August 6, 2021
According to County Business Patterns, in 2010, there were 90,892 employees in NAICS 51913 (Internet Publishing and Broadcasting and Web Search Portals). Over the course of the decade, employment in this category grew steadily to reach 275,875 in 2018. In macro news, real GDP increased at an annual rate of 6.5% in Q2 2021. Full Analysis
June Graphic Arts Employment—Continuing to Get a Little Better
Published: July 30, 2021
In June 2021, all printing employment was up +0.1% from May, production employment up +0.7%, and non-production printing employment down -1.2%. Full Analysis
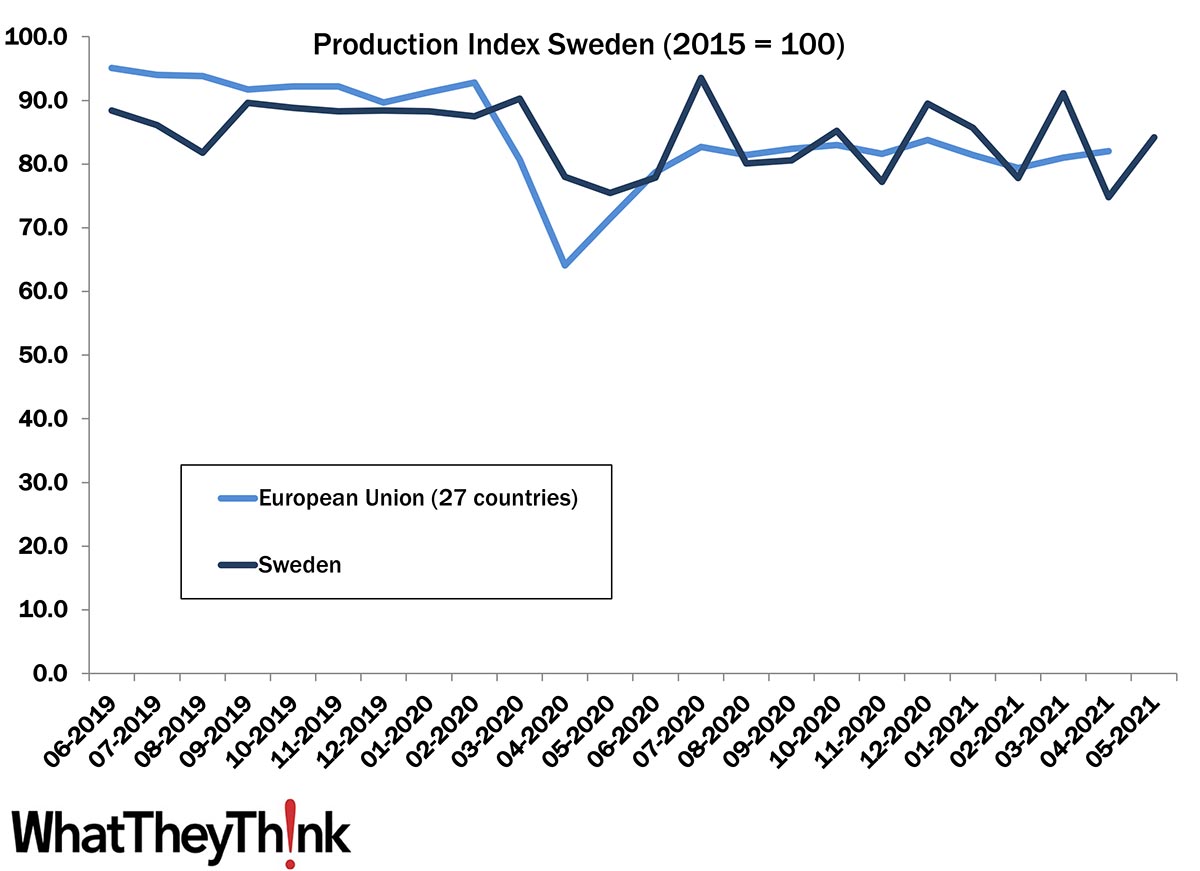
European Print Industry Snapshot: Sweden
Published: July 27, 2021
In this bimonthly series, WhatTheyThink is presenting the state of the printing industry in different European countries based on the latest monthly production numbers. This week, we take a look at the printing industry in Sweden. Full Analysis
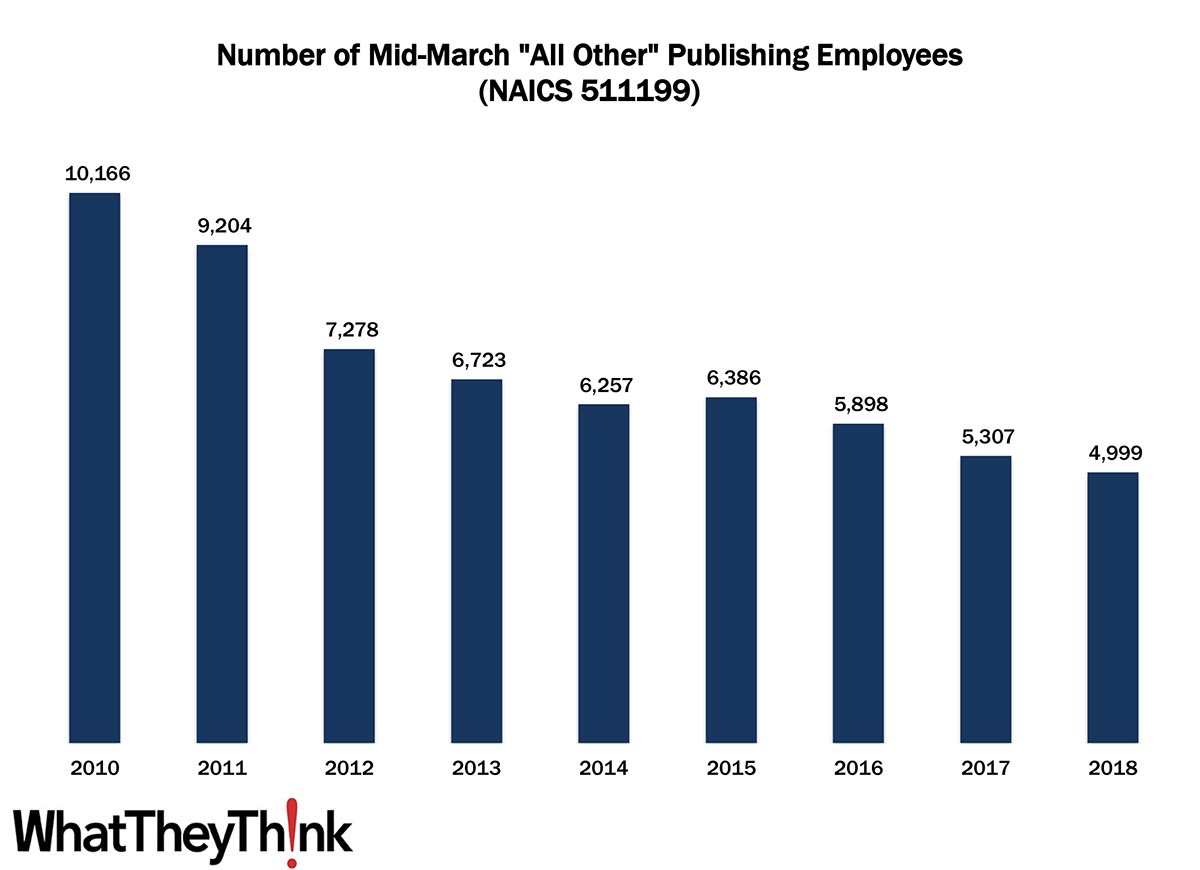
Assorted Publishing Employment—2010–2018
Published: July 23, 2021
According to County Business Patterns, in 2010, there were 10,166 employees in NAICS 511199 (All Other Publishers). Over the course of the decade, employment in this category steadily declined to bottom out at 4,999 in 2018. In macro news, last year’s “official” COVID recession lasted only two months, according to the NBER. Full Analysis
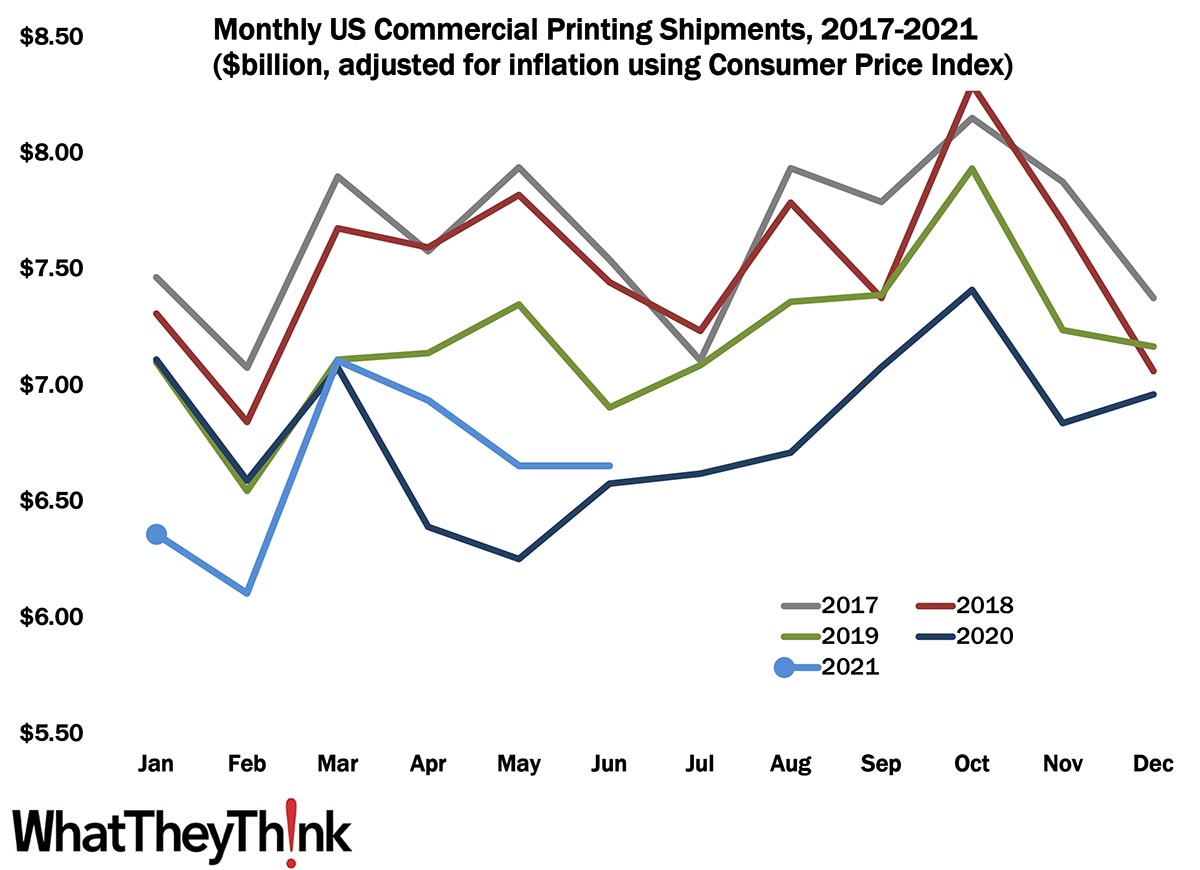
Shipments: An Evening Out
Published: July 16, 2021
May 2021 printing shipments came in at $6.59 billion, a slight downturn from April’s $6.87 billion, and the second consecutive month of decline, but is consistent with the pattern we have been tracking over the past five years. Full Analysis
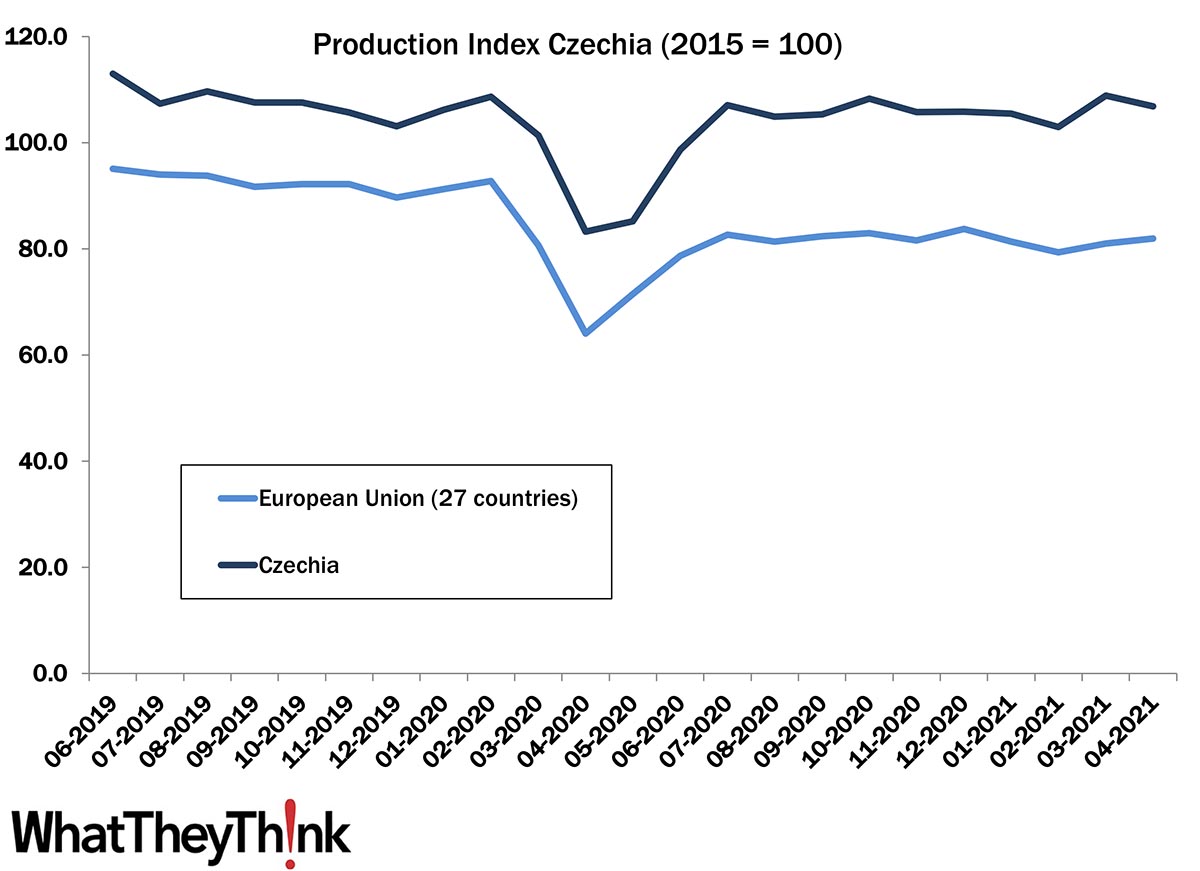
European Print Industry Snapshot: Czech Republic
Published: July 13, 2021
In this bimonthly series, WhatTheyThink is presenting the state of the printing industry in different European countries based on the latest monthly production numbers. This week, we take a look at the printing industry in the Czech Republic. Full Analysis
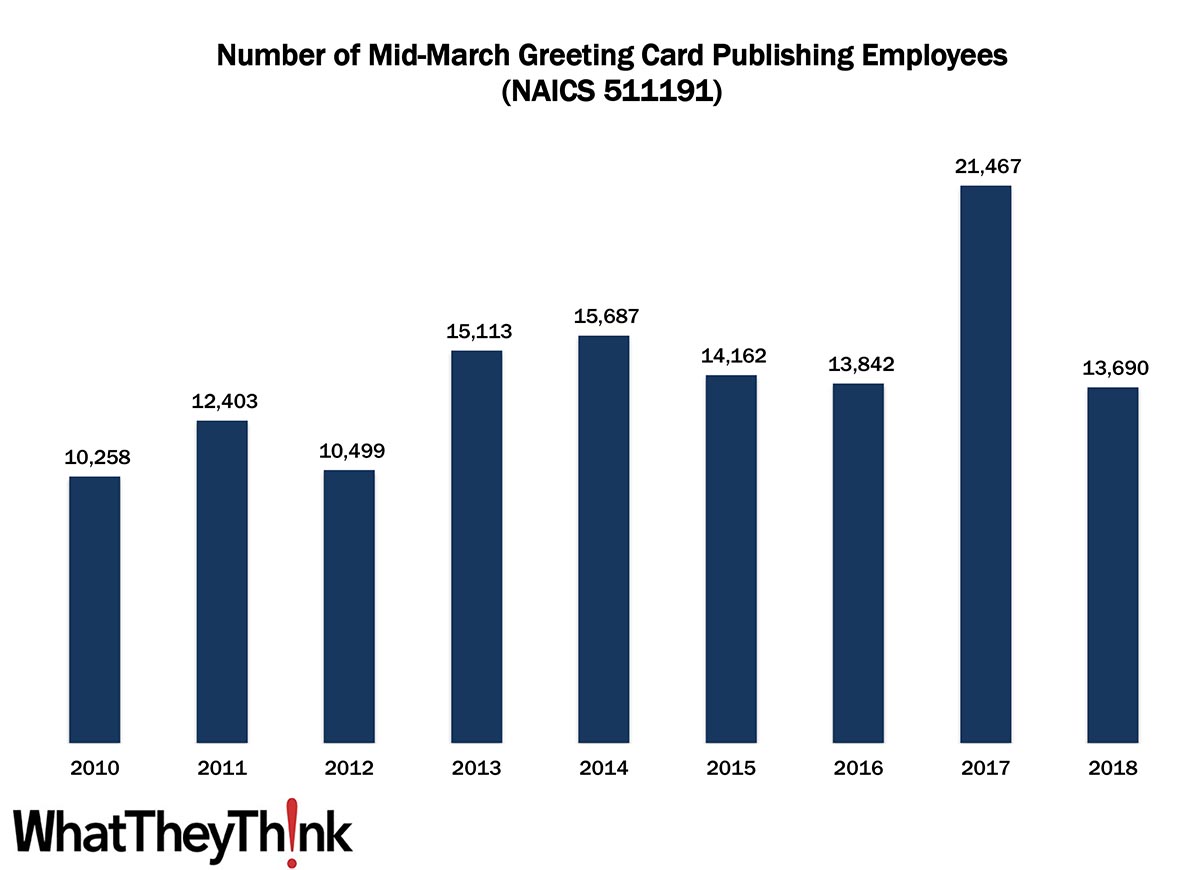
Greeting Card Publishers—2010–2018
Published: July 2, 2021
According to County Business Patterns, in 2010, there were 10,258 employees in NAICS 511191 (Greeting Card Publishers). Over the course of the decade, employment has been up and down, reaching 13,690 in 2018. In sort of macro news, Las Vegas tourism traffic rose substantially in May 2021, as conventions were poised to reopen. Full Analysis
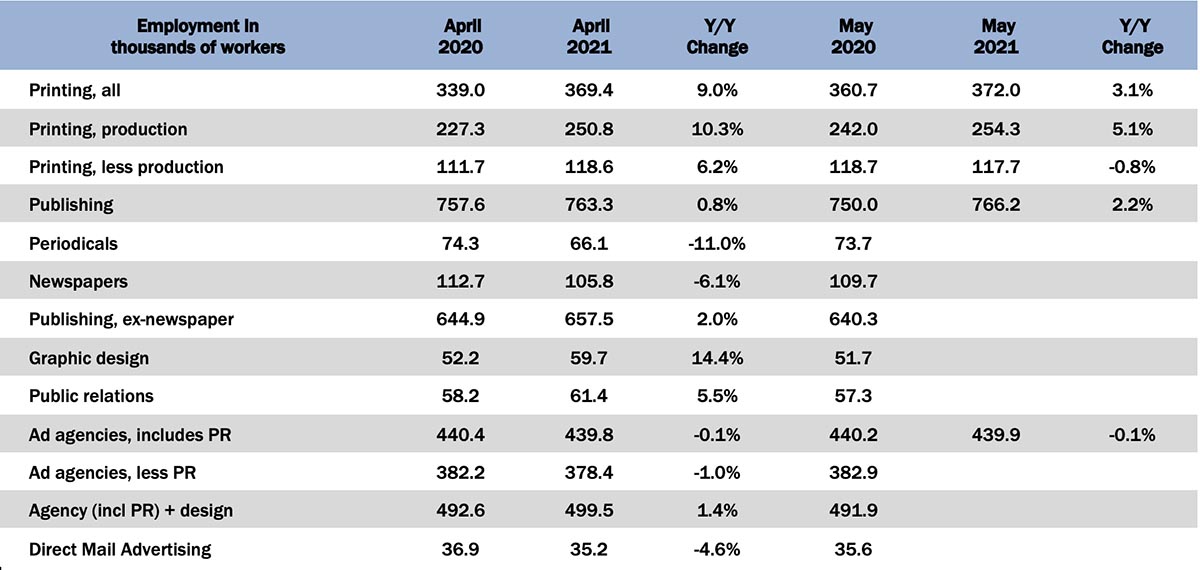
May Graphic Arts Employment—Getting a Little Better
Published: June 25, 2021
In May 2021, all printing employment was up +0.7% from February, production employment up +1.4%, and non-production printing employment down -0.8%. Full Analysis
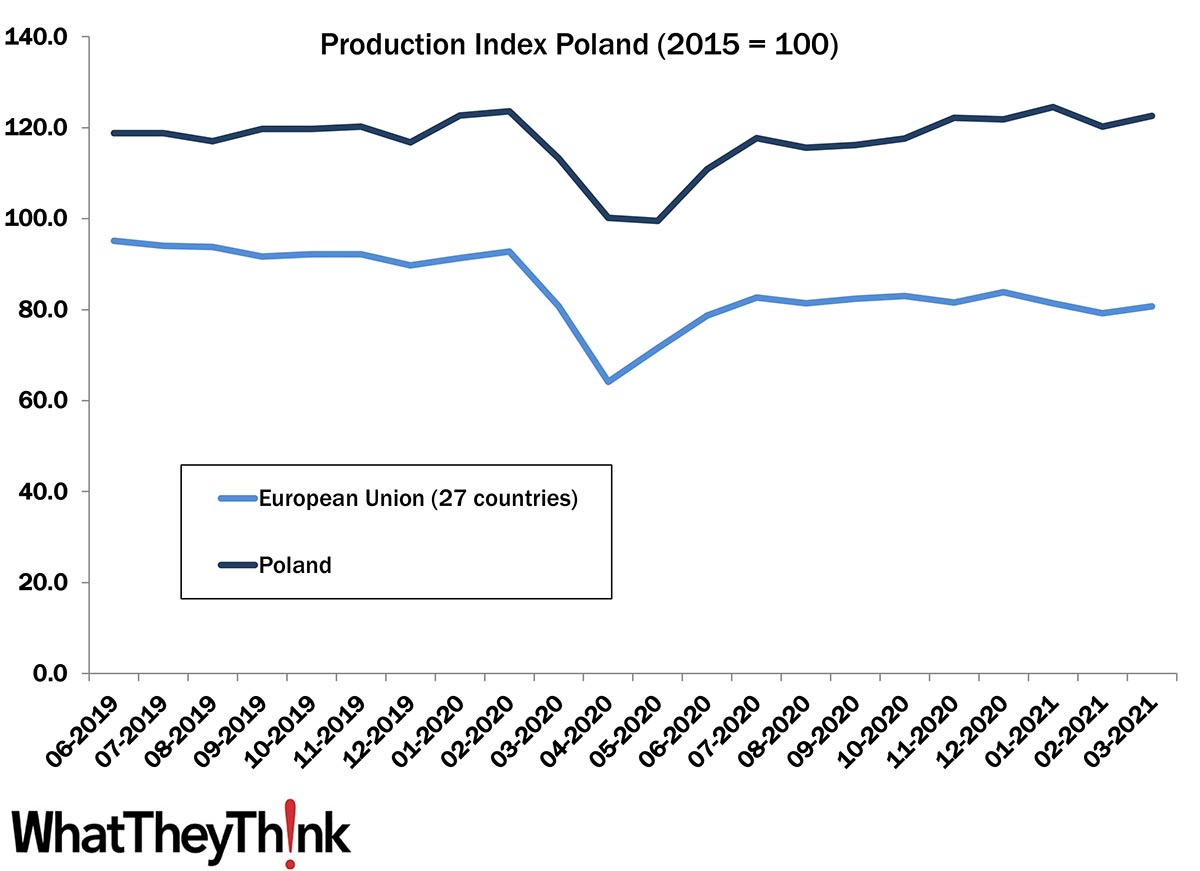
European Print Industry Snapshot: Poland
Published: June 22, 2021
In this bimonthly series, WhatTheyThink is presenting the state of the printing industry in different European countries based on the latest monthly production numbers. This week, we take a look at the printing industry in Poland. Full Analysis
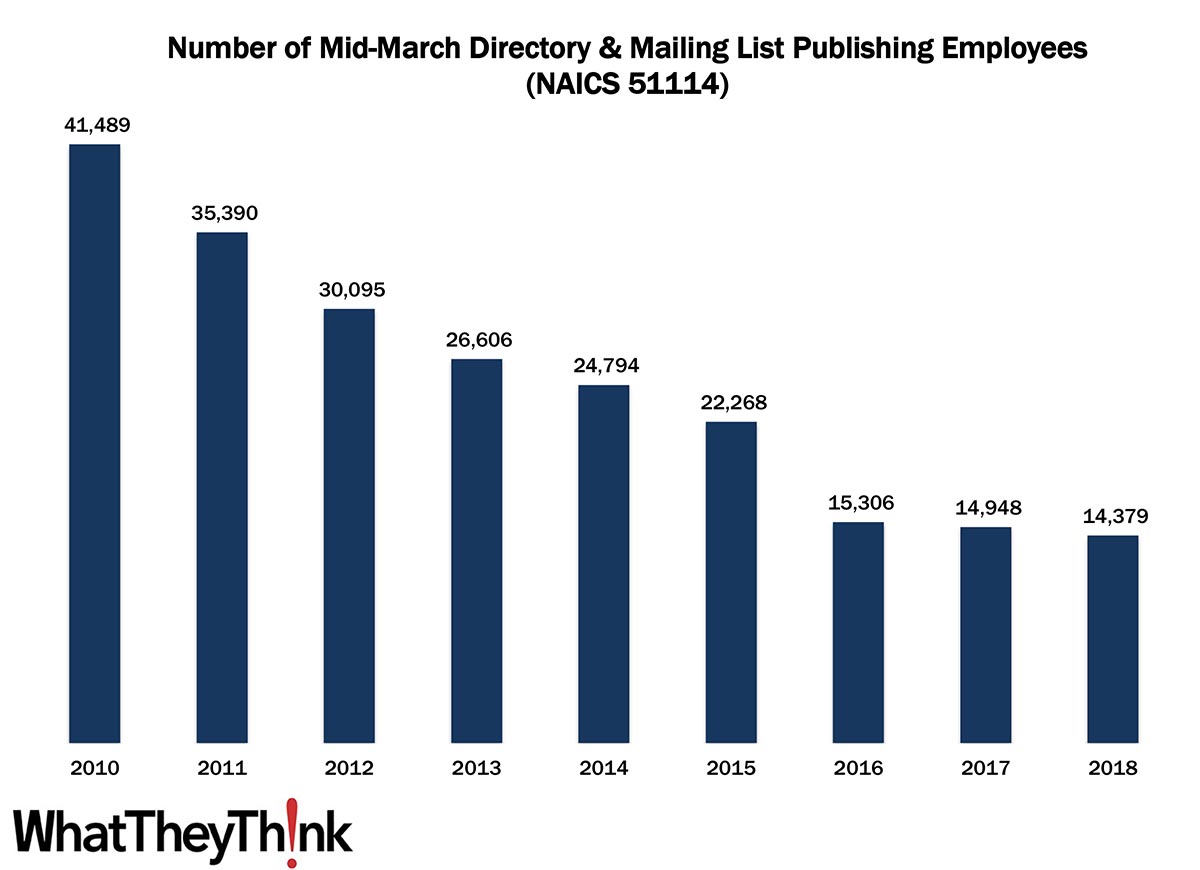
Directory and Mailing List Publishers—2010–2018
Published: June 18, 2021
According to County Business Patterns, in 2010, there were 41,489 employees in NAICS 51114 (Directory and Mailing List Publishing). Over the course of the decade, employment had plummeted to a low of 14,379. In macro news, new business creation has been at record highs. Full Analysis
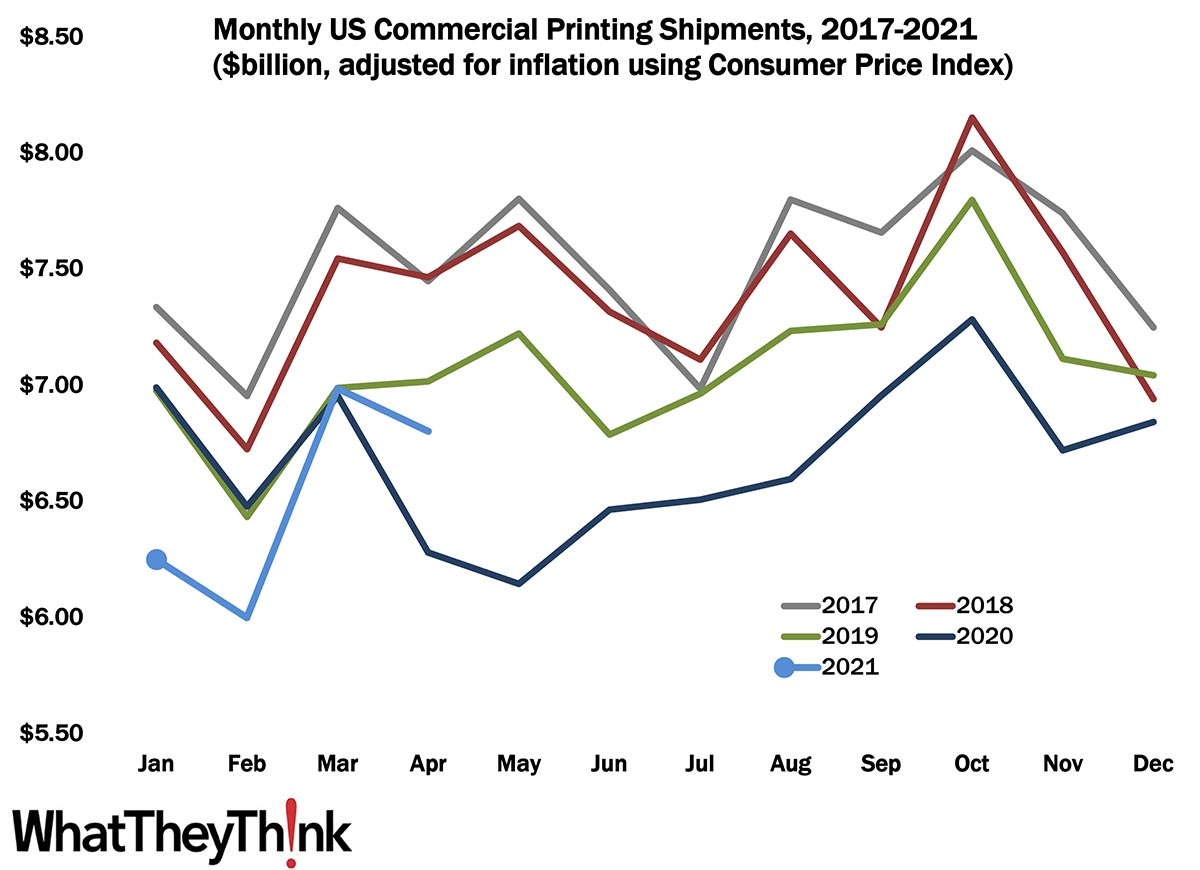
Shipments: A New Season?
Published: June 11, 2021
April 2021 printing shipments came in at $6.80 billion, a slight downturn from March’s $6.98 billion, but is consistent with the pattern we have been tracking over the past five years. Full Analysis
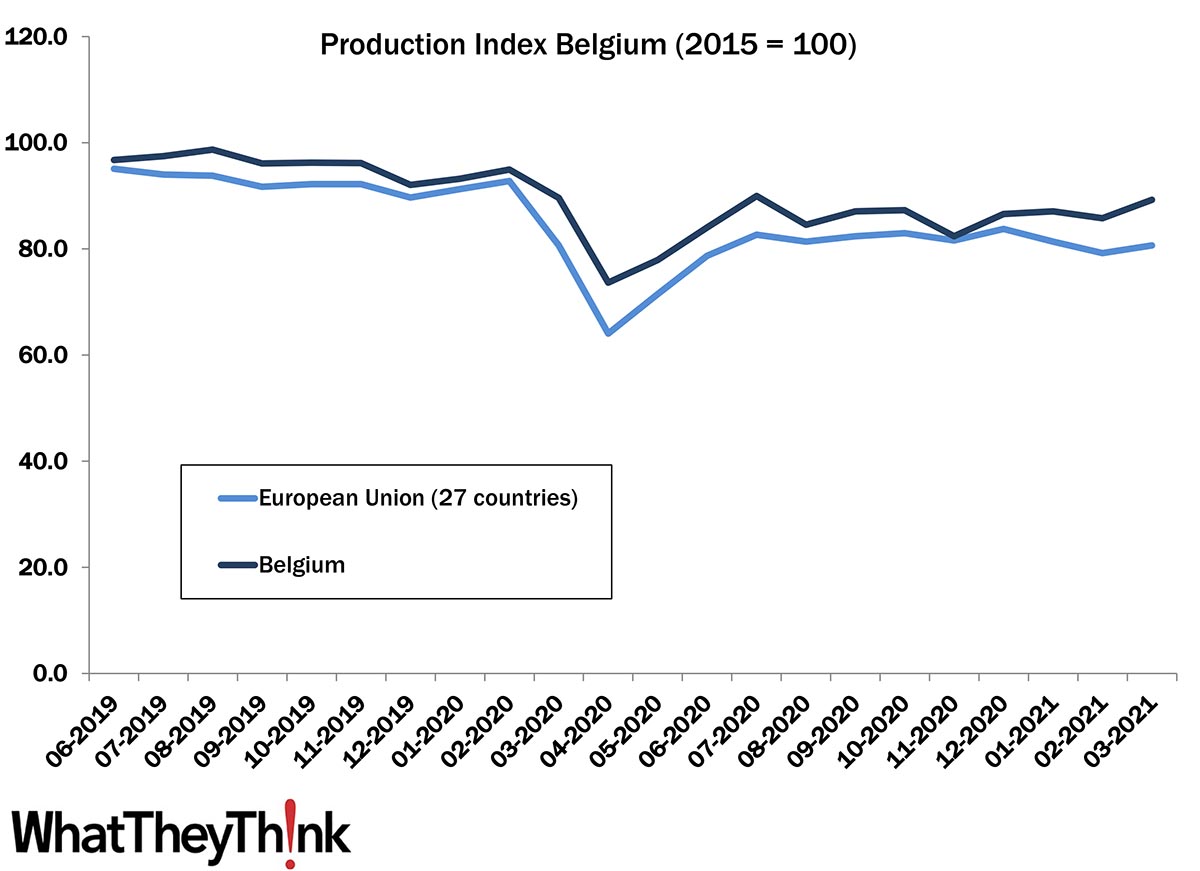
European Print Industry Snapshot: Belgium
Published: June 8, 2021
In this bimonthly series, WhatTheyThink is presenting the state of the printing industry in different European countries based on the latest monthly production numbers. This week, we take a look at the printing industry in Belgium Full Analysis
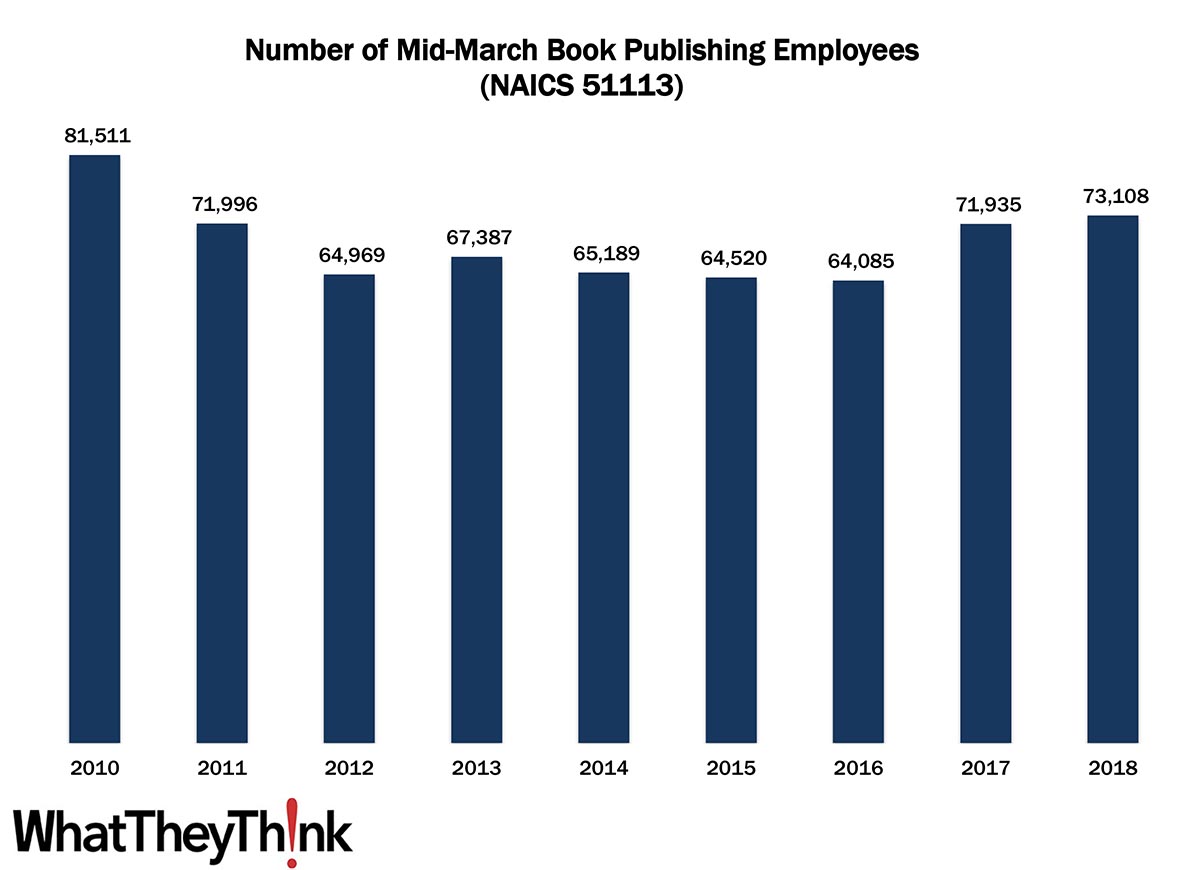
Book Publishing Employees—2010–2018
Published: June 4, 2021
According to County Business Patterns, in 2010, there were 81,511 employees in NAICS 51113 (Book Publishing). Over the course of the decade, employment had dropped to a low of 64,085, but climbed back up to 73,108 in 2018. In macro news, the Great Rebound is underway. Full Analysis
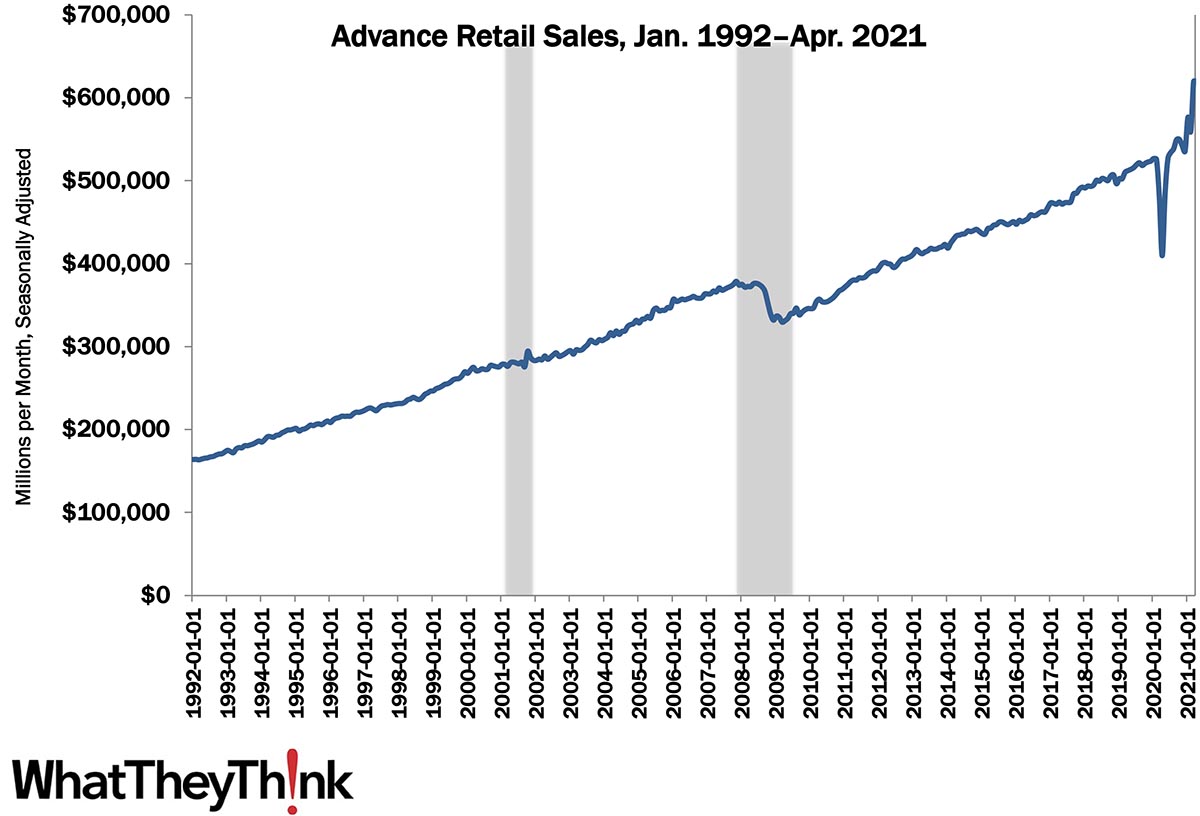
Two Macroeconomic Indicators
Published: May 28, 2021
This week’s Friday data dump looks at two macroeconomic indicators that will give us some sense of how we are bouncing back from the pandemic—the Industrial Production Index, and Retail Sales. Full Analysis
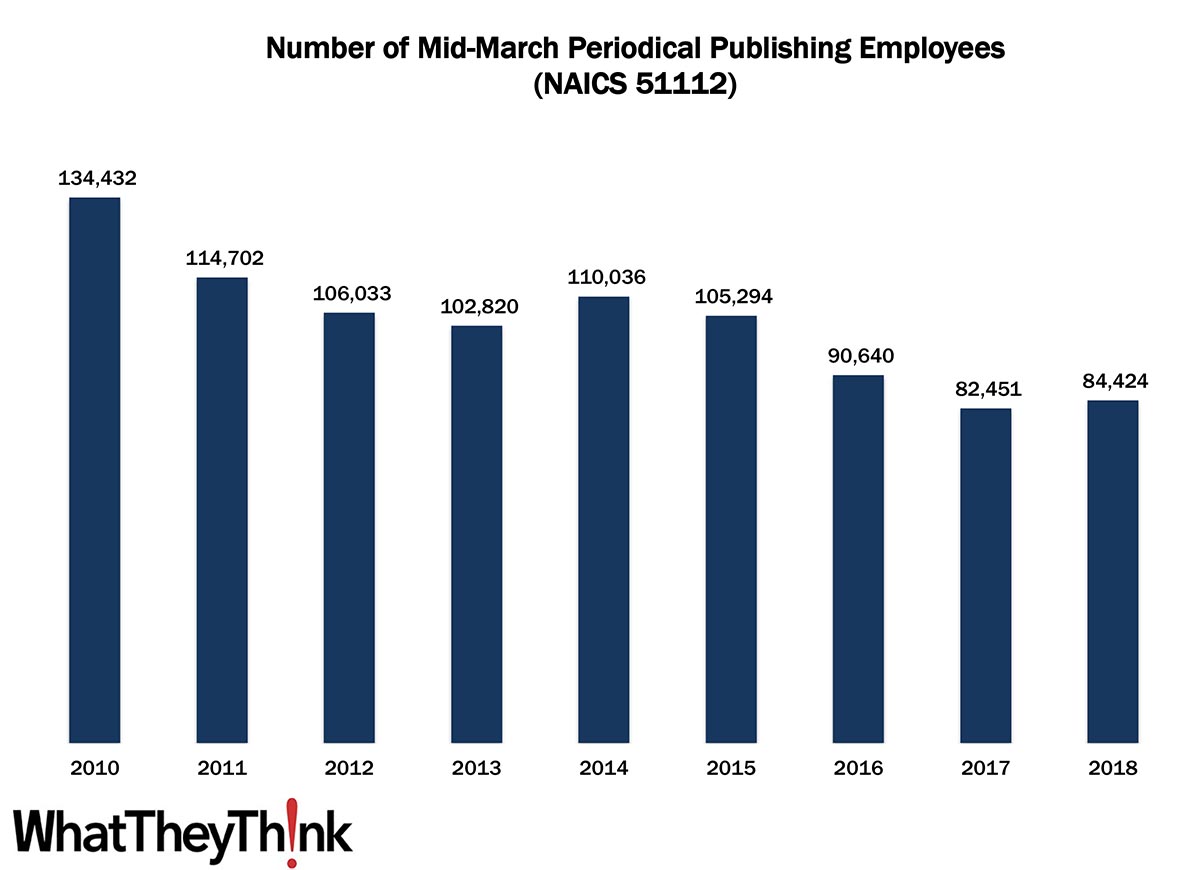
Periodical Publishing Employees—2010–2018
Published: May 21, 2021
According to County Business Patterns, in 2010, there were 134,432 employees in NAICS 51112 (Periodical Publishing). By 2018, employees had decreased to 84,424. In macro news, ecommerce as a percent of retail sales has dropped almost back to its pre-pandemic level. Full Analysis
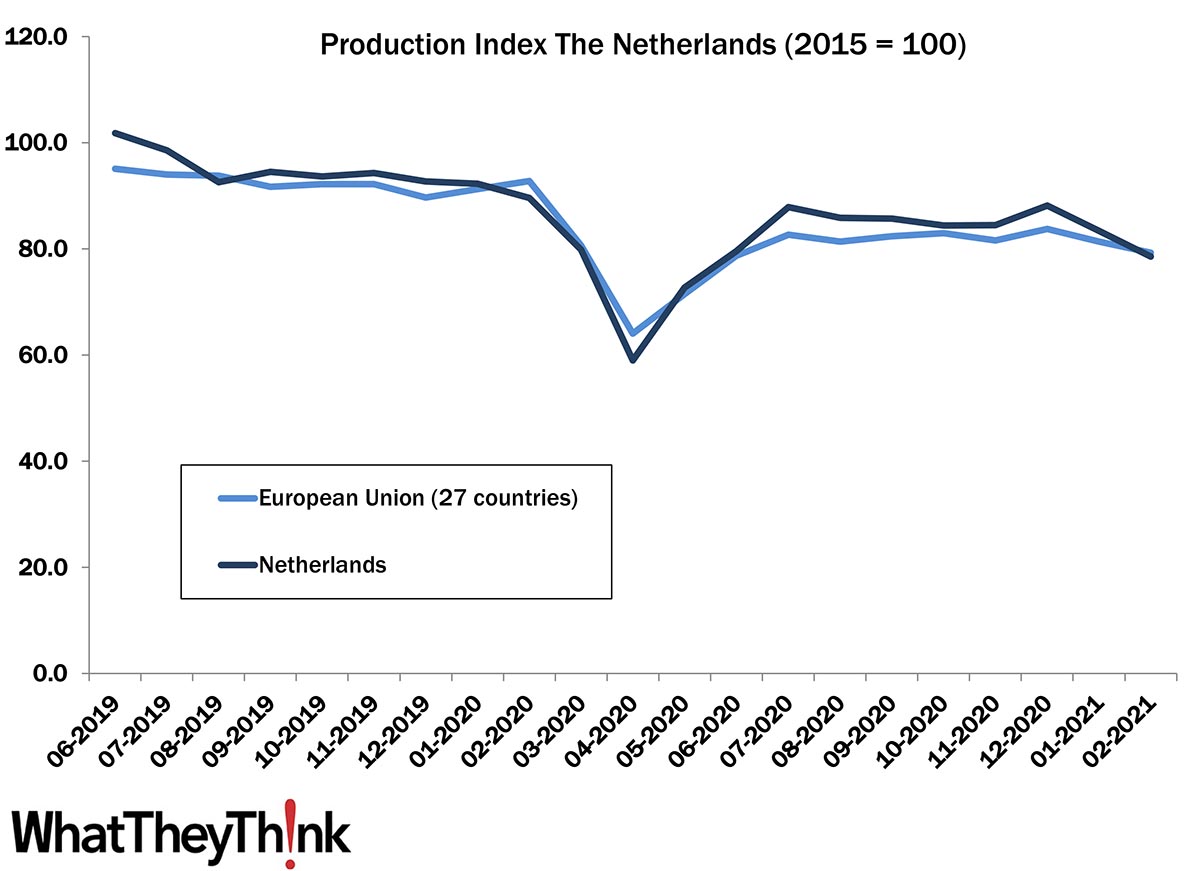
European Print Industry Snapshot: Netherlands
Published: May 18, 2021
In this bimonthly series, WhatTheyThink is presenting the state of the printing industry in different European countries based on the latest monthly production numbers. This week, we take a look at the printing industry in the Netherlands Full Analysis
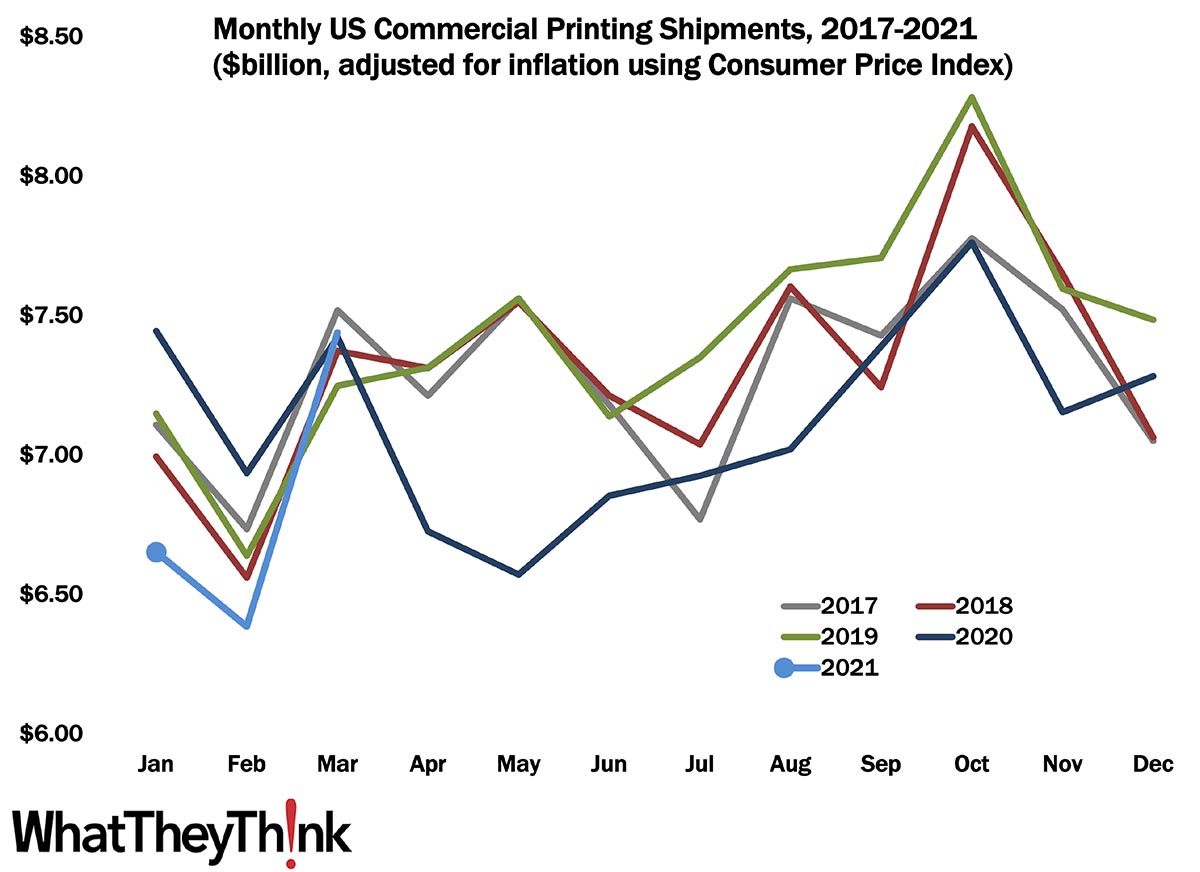
Shipments: We Told You
Published: May 14, 2021
Last month, we said that “shipments can only get better from here”—and we were right. March shipments roared back from a historical low of $6.39 billion in February to $7.44 billion in March, the second best March in the past five years. Full Analysis
March Graphic Arts Employment—Getting Back to Work
Published: May 7, 2021
In March 2021, all printing employment was up +1.5% from February, production employment up +1.1%, and non-production printing employment up +2.2%. Full Analysis
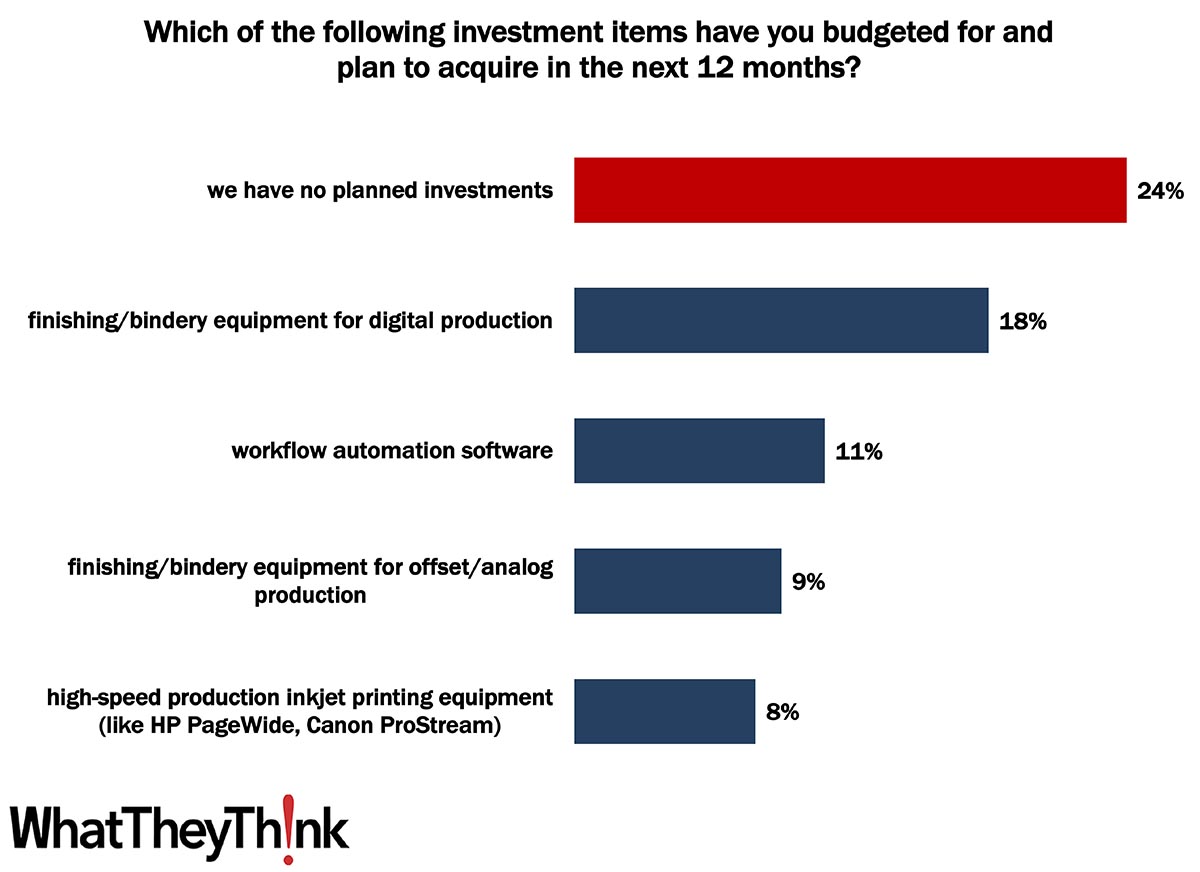
Printing 2021 Quick Look: Top Investments
Published: May 5, 2021
According to data from our recently published Printing Outlook 2021 special report, one-fourth of print businesses have no major investment plans for 2021. Full Analysis
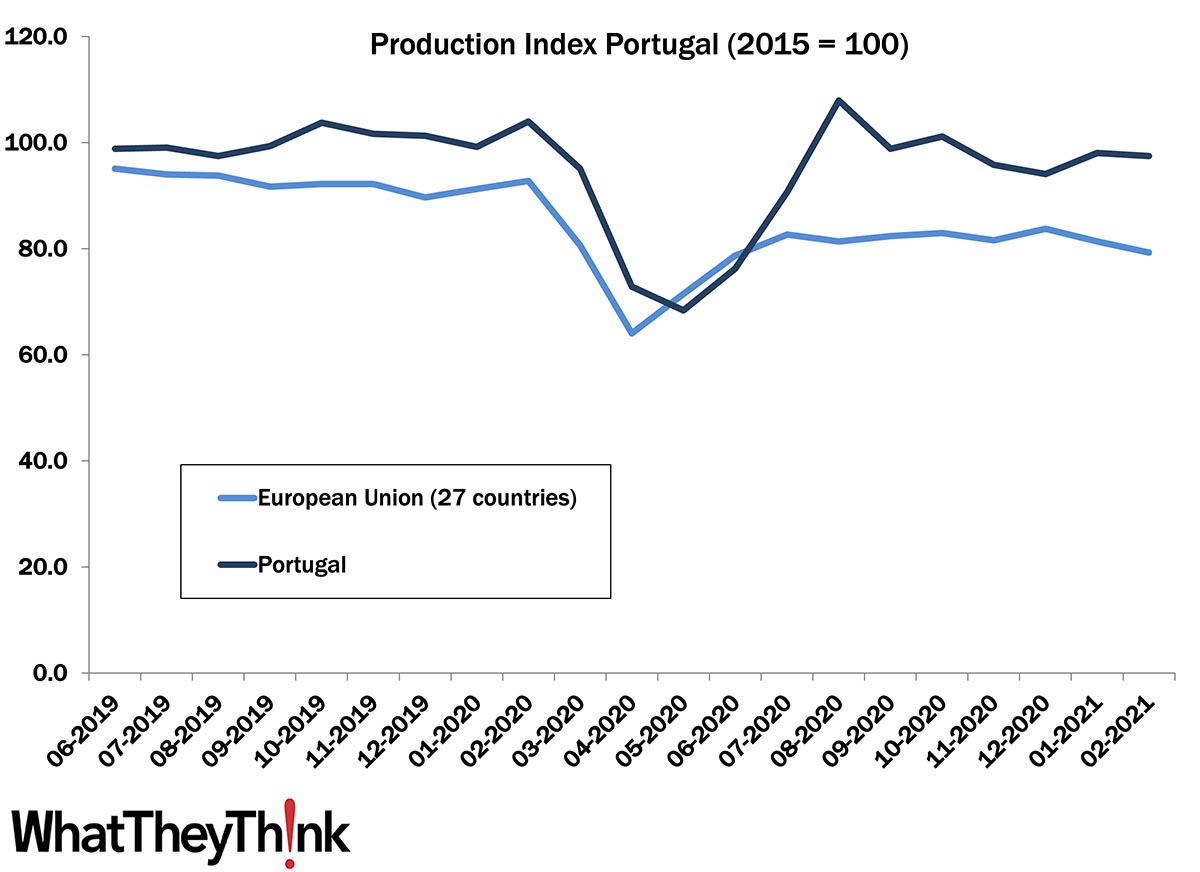
European Print Industry Snapshot: Portugal
Published: May 4, 2021
In this bimonthly series, WhatTheyThink is presenting the state of the printing industry in different European countries based on the latest monthly production numbers. This week, we take a look at the printing industry in Portugal. Full Analysis
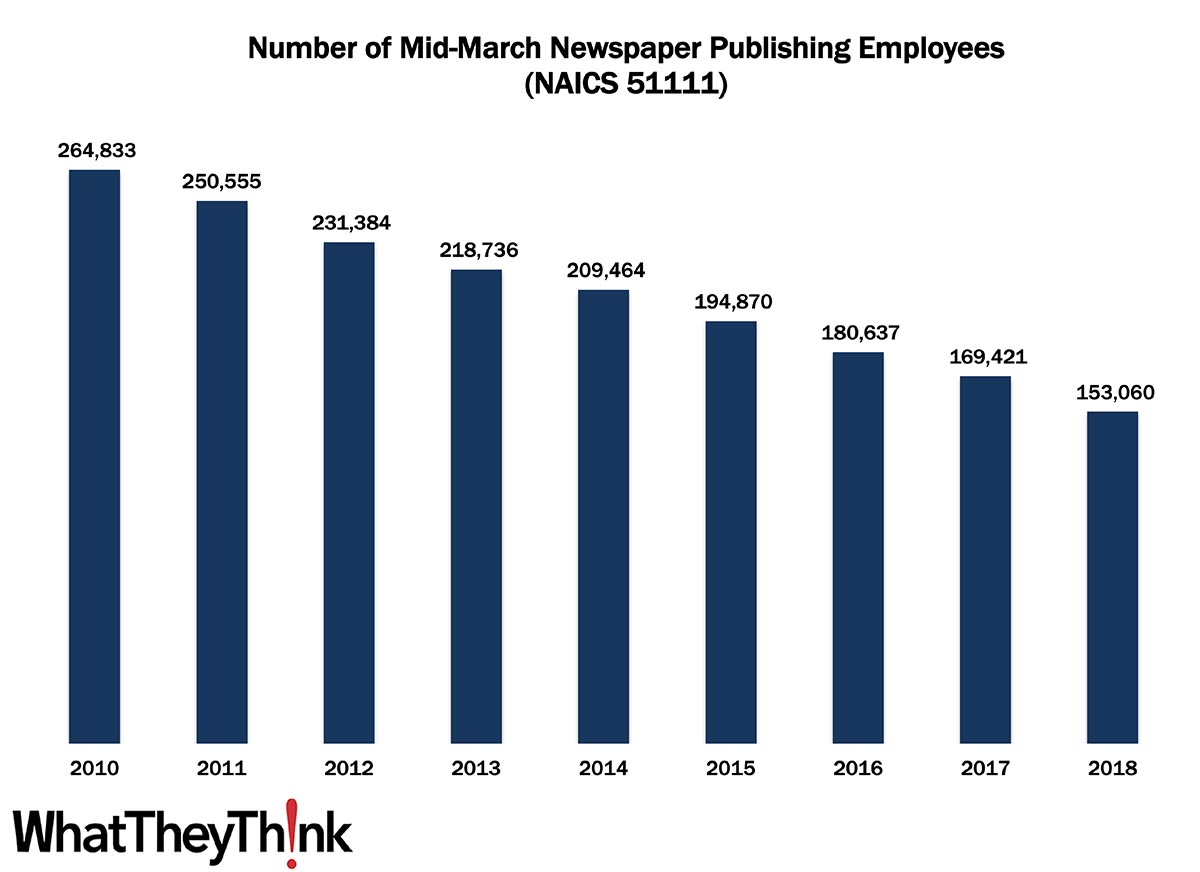
Newspaper Publishing Employees—2010–2018
Published: April 30, 2021
According to County Business Patterns, in 2010, there were 264,833 employees in NAICS 51111 (Newspaper Publishing). By 2018, employees had decreased to 153,060. In macro news, Q1 GDP was up 6.4%. Full Analysis
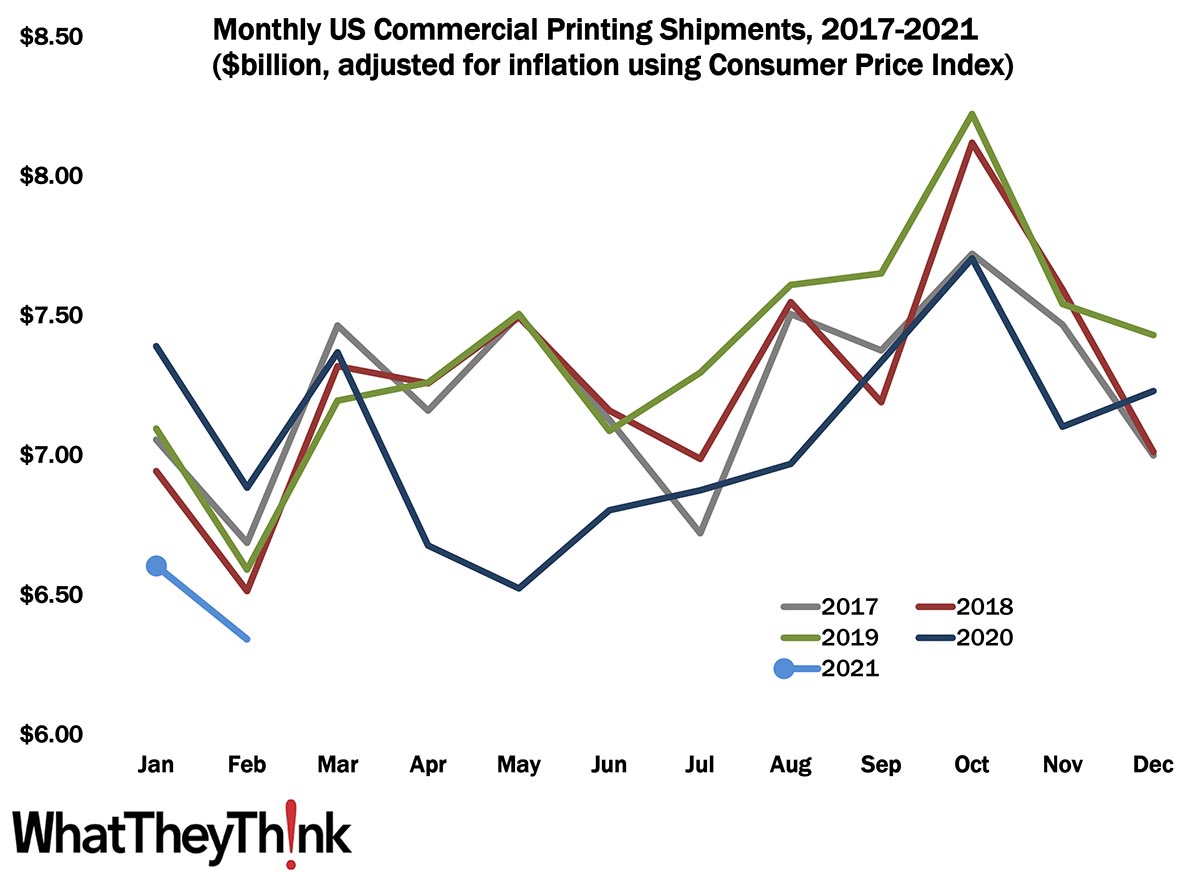
Shipments: They Can Only Get Better from Here
Published: April 23, 2021
We didn’t kick off 2021 very auspiciously, with January printing shipments coming in at $6.57 billion, down from December 2020’s $7.17 billion, and then a further drop in February to $6.34 billion. Full Analysis
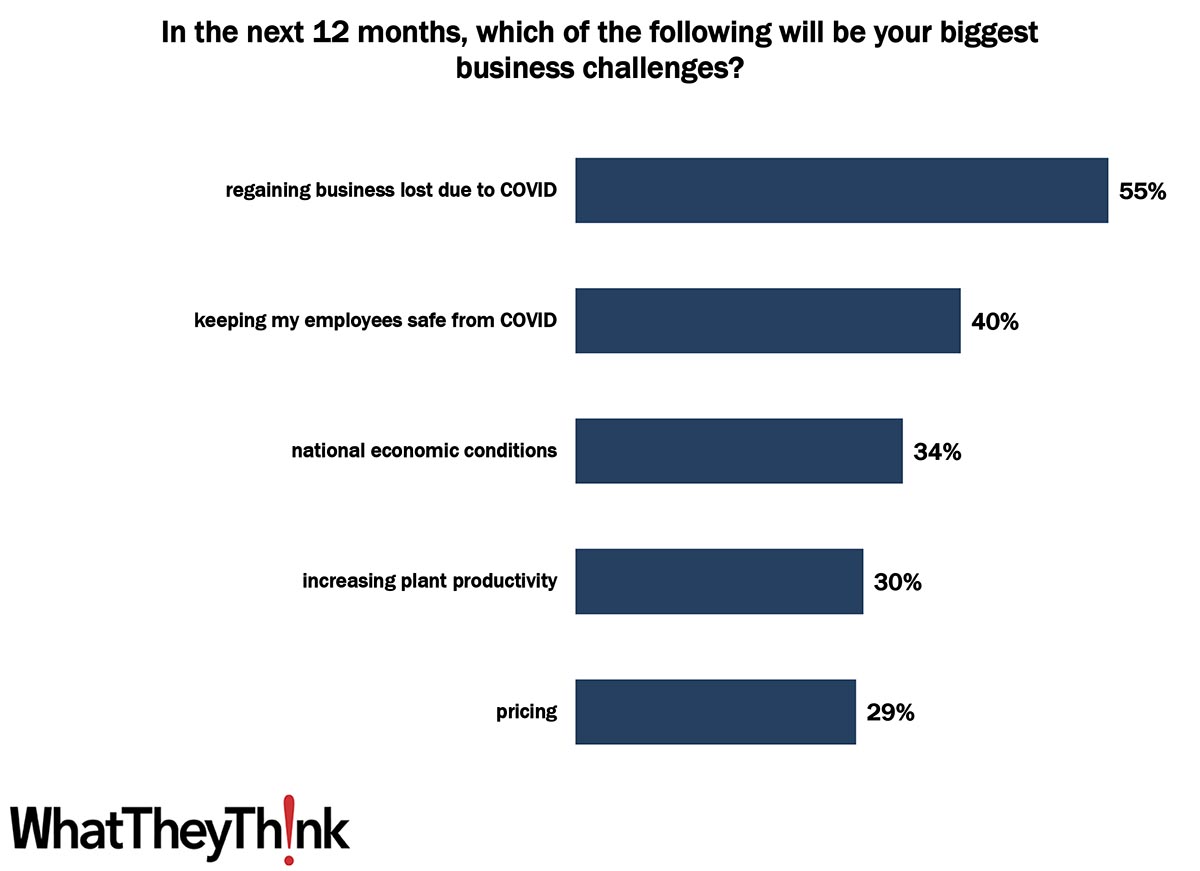
Printing 2021 Quick Look: Top Challenges
Published: April 21, 2021
According to data from our recently published Printing Outlook 2021 special report, recovering business lost to COVID and national economic conditions dominated printers’ top challenges—but traditional challenges will gain prominence post-COVID. Full Analysis
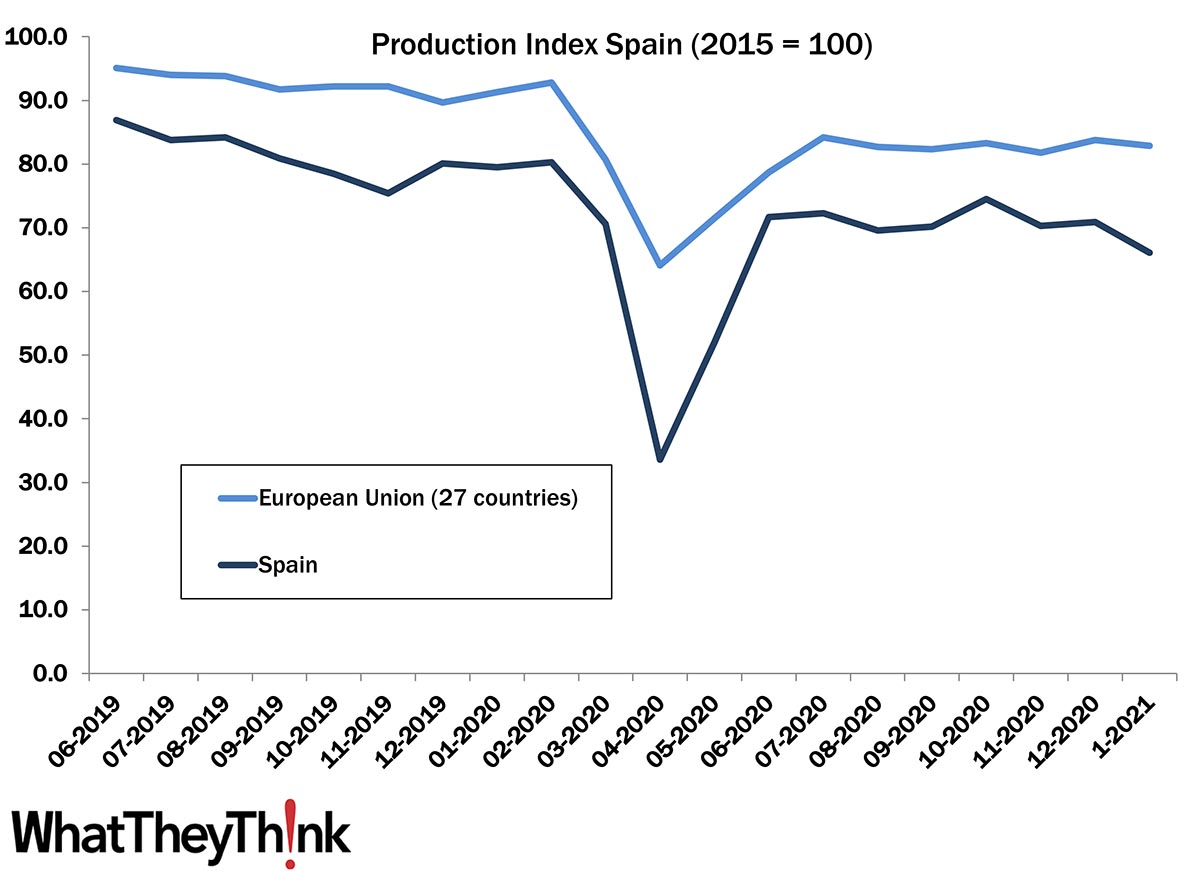
European Print Industry Snapshot: Spain
Published: April 20, 2021
In this bimonthly series, WhatTheyThink is presenting the state of the printing industry in different European countries based on the latest monthly production numbers. This week, we take a look at the printing industry in Spain. Full Analysis
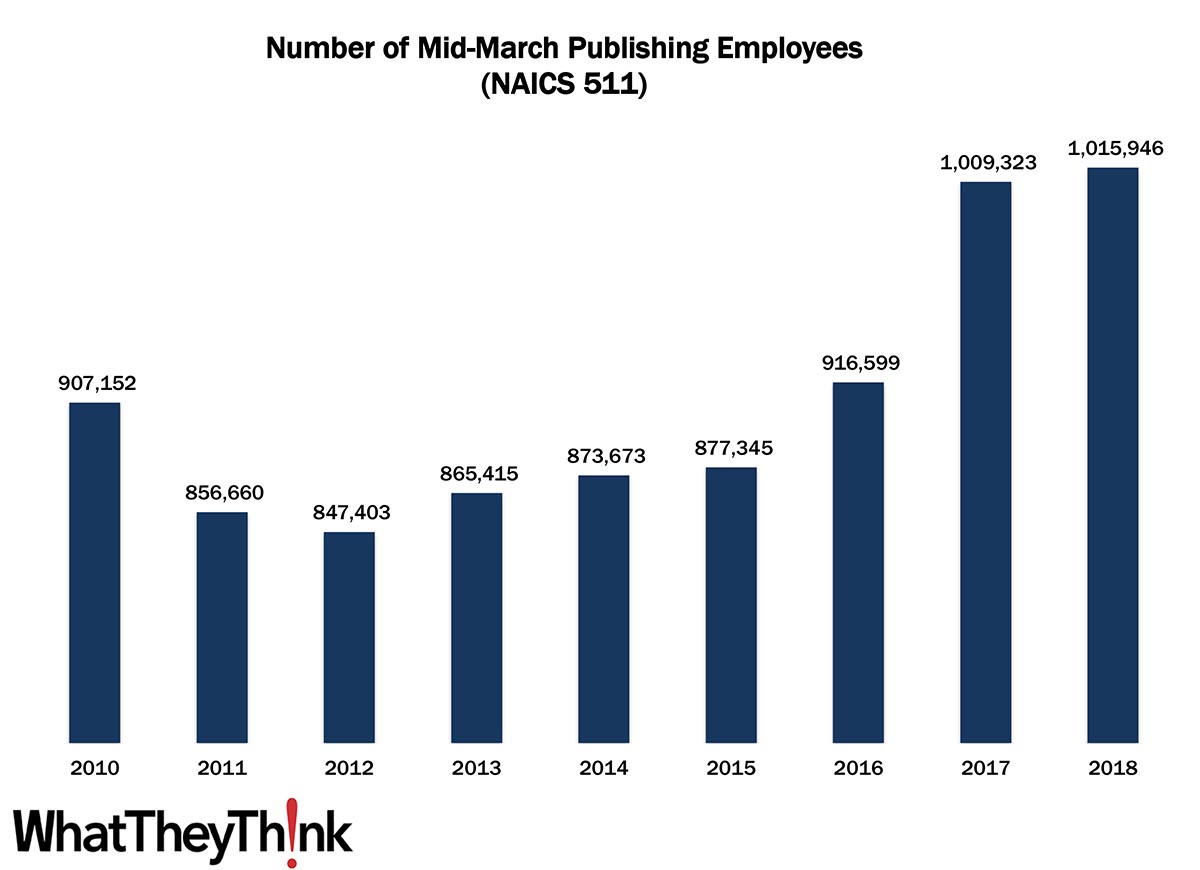
Publishing Employees—2010–2018
Published: April 16, 2021
According to County Business Patterns, in 2010, there were 907,152 employees in NAICS 511 (Publishing Industries—except Internet). By 2018, employees had increased to 1,015,946. In macro news, retail sales were up 9.8% in March. Full Analysis
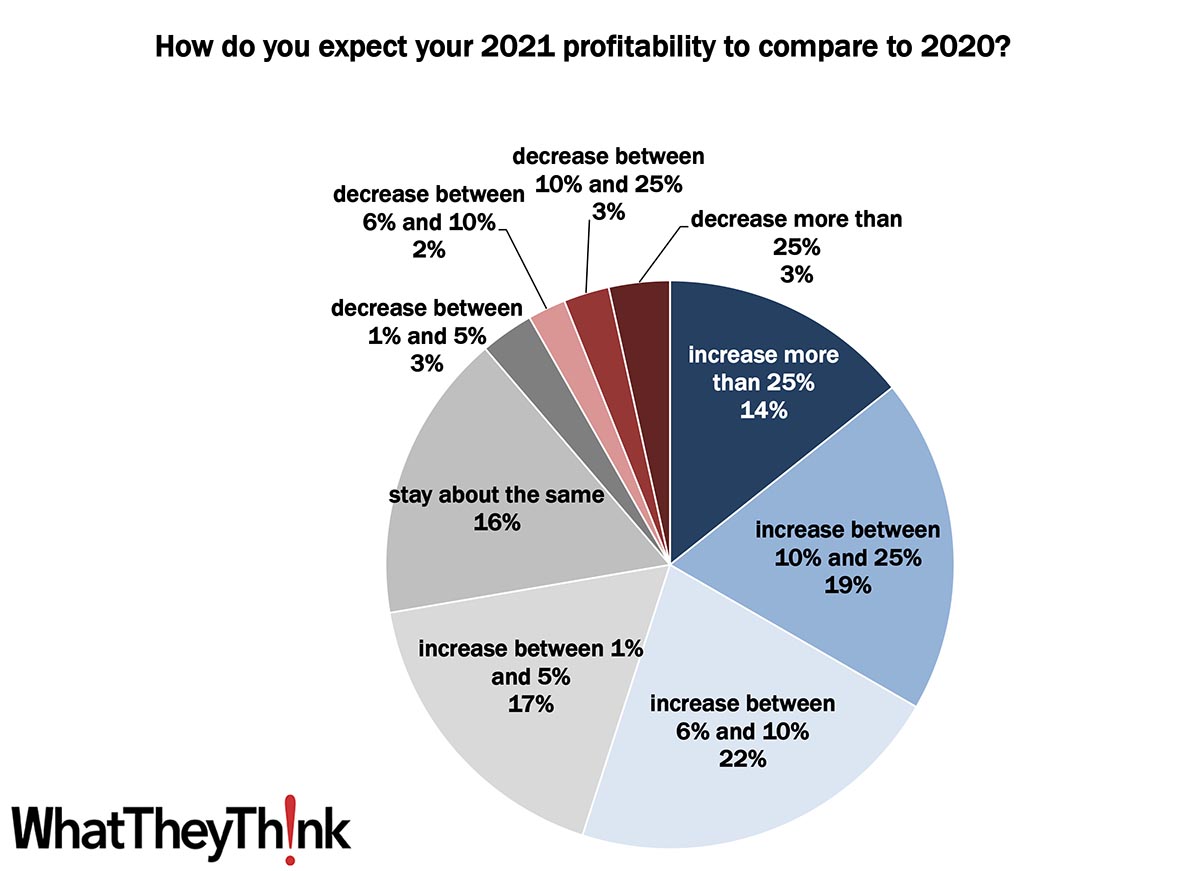
Printing 2021 Quick Look: 2021 Profits
Published: April 14, 2021
According to data from our recently published Printing Outlook 2021 special report, print businesses expect a +8.1% increase in profits from 2020 to 2021. Full Analysis
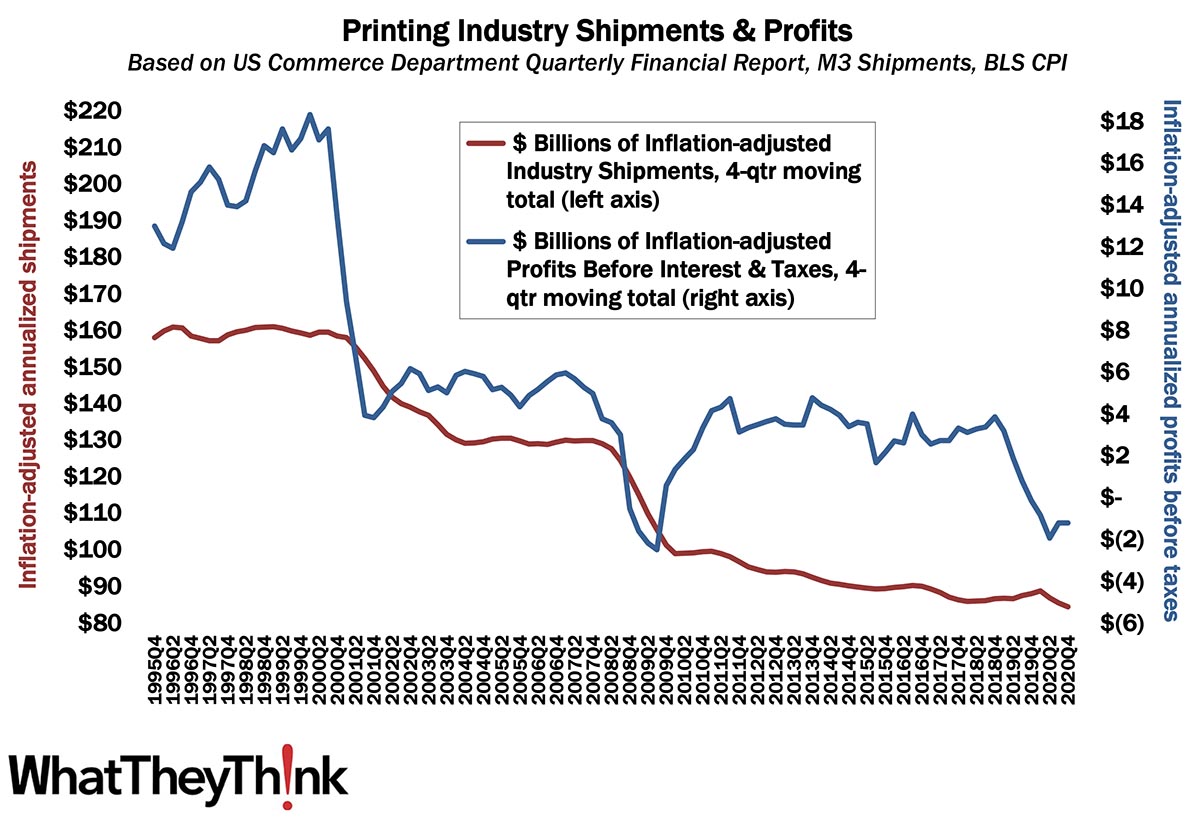
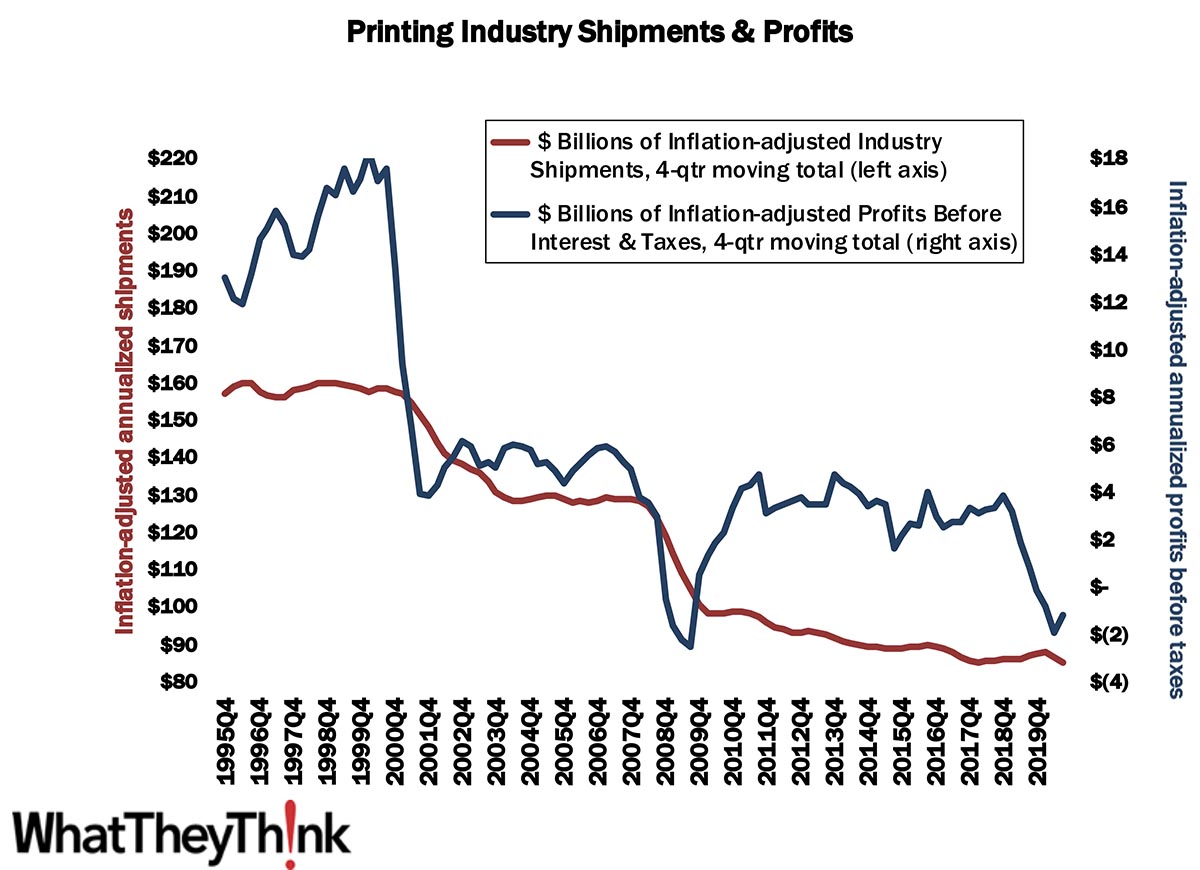
Profits: Back to the Tale of Two Cities
Published: April 9, 2021
We’ve long been calling it “a tale of two cities”—large printers and small/mid-size printers and the profitability gap between them. The pandemic interrupted this ongoing narrative temporarily, but back in Q3 2020, we started to return to normal, at least in terms of industry profits trends, which continued into Q4. Full Analysis
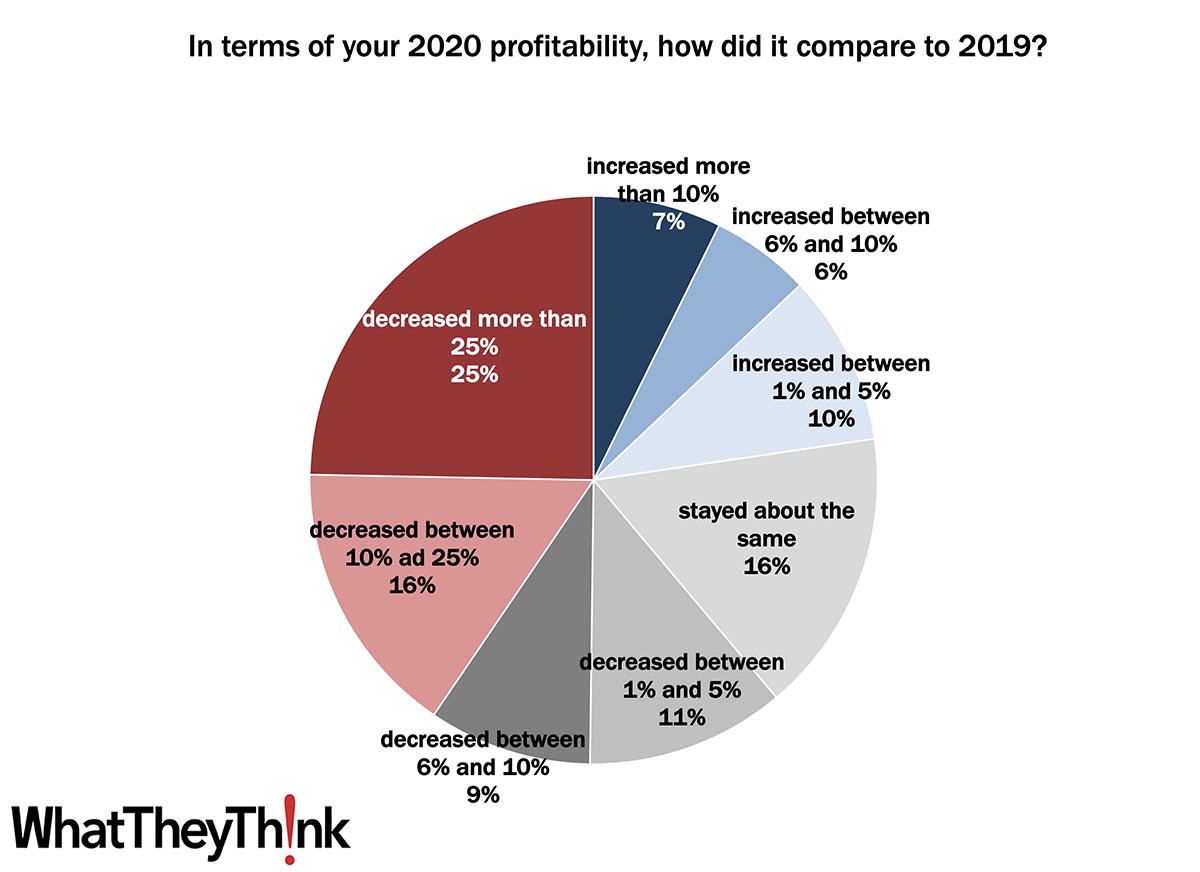
Printing 2021 Quick Look: 2020 Profits
Published: April 7, 2021
According to data from our recently published Printing Outlook 2021 special report, print businesses reported a -9.1% decline in profits from 2019 to 2020. Full Analysis
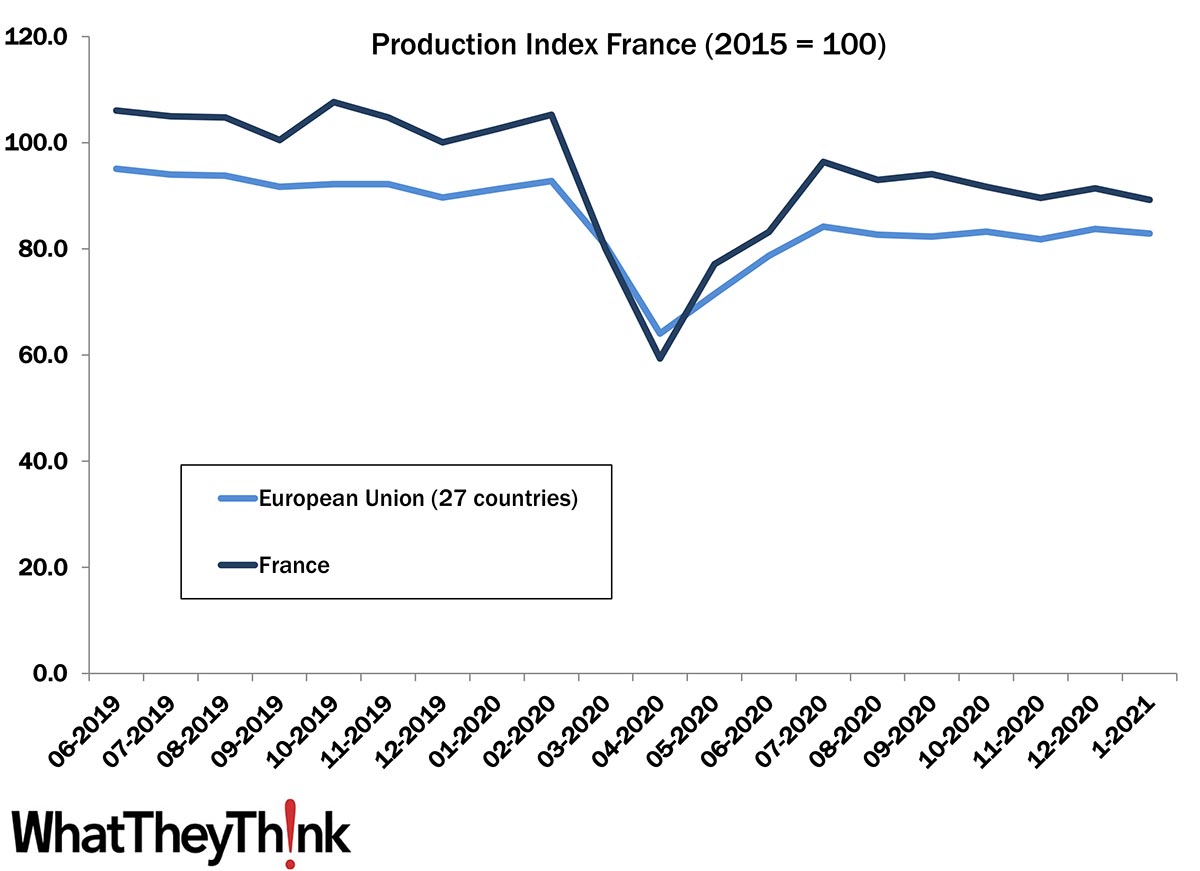
European Print Industry Snapshot: France
Published: April 5, 2021
In this bimonthly series, WhatTheyThink is presenting the state of the printing industry in different European countries based on the latest monthly production numbers. This week, we take a look at the printing industry in France. Full Analysis
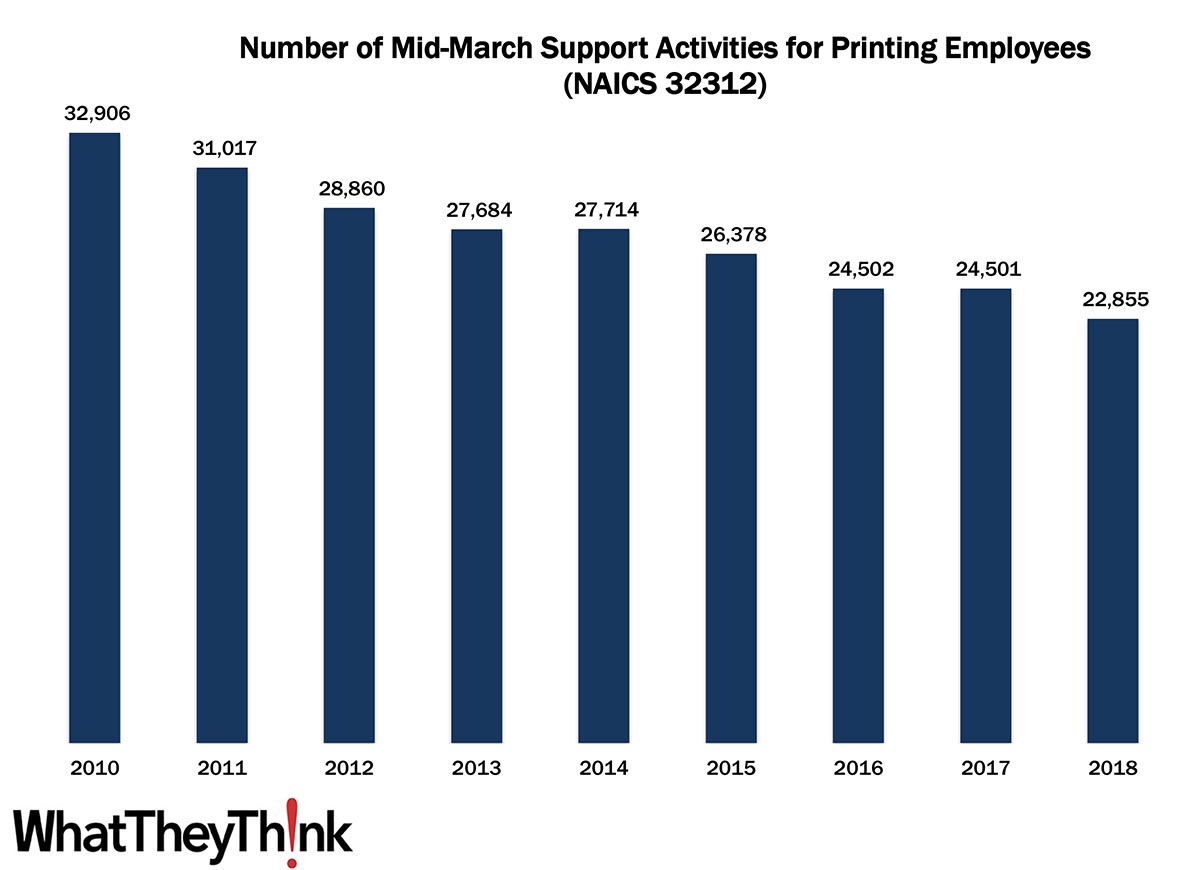
Pre- and Postpress Employees—2010–2018
Published: March 26, 2021
According to County Business Patterns, in 2010, there were 32,906 employees in NAICS 32312 (Support Activities for Printing). By 2018, employees had declined to 22,855. In macro news, Q4 2020 GDP was revised up. Full Analysis
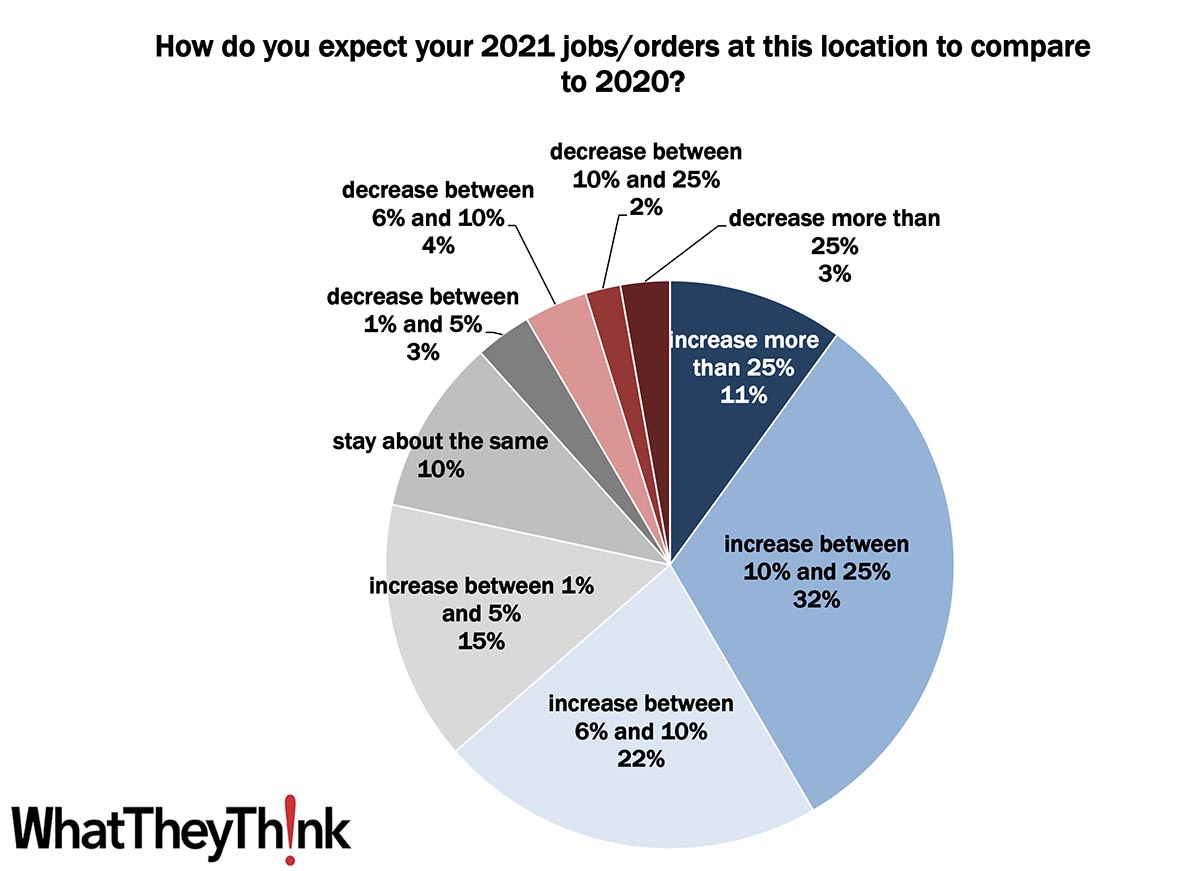
Printing 2021 Quick Look: Anticipated 2021 Jobs/Orders
Published: March 24, 2021
According to data from our recently published Printing Outlook 2021 special report, print businesses expect print industry jobs/orders to rebound +9.0% from 2020 to 2021. Full Analysis
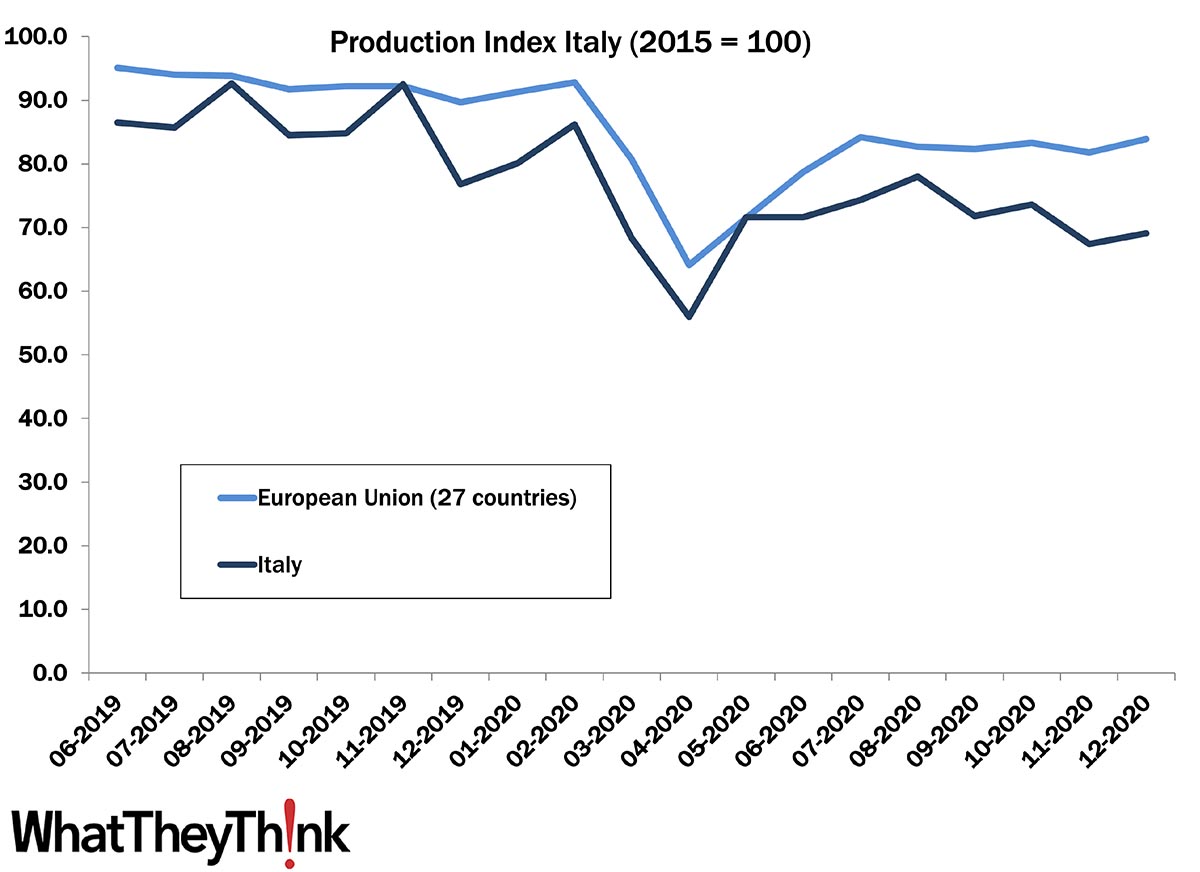
European Print Industry Snapshot: Italy
Published: March 23, 2021
In this bimonthly series, WhatTheyThink is presenting the state of the printing industry in different European countries based on the latest monthly production numbers. This week, we take a look at the printing industry in Italy. Full Analysis
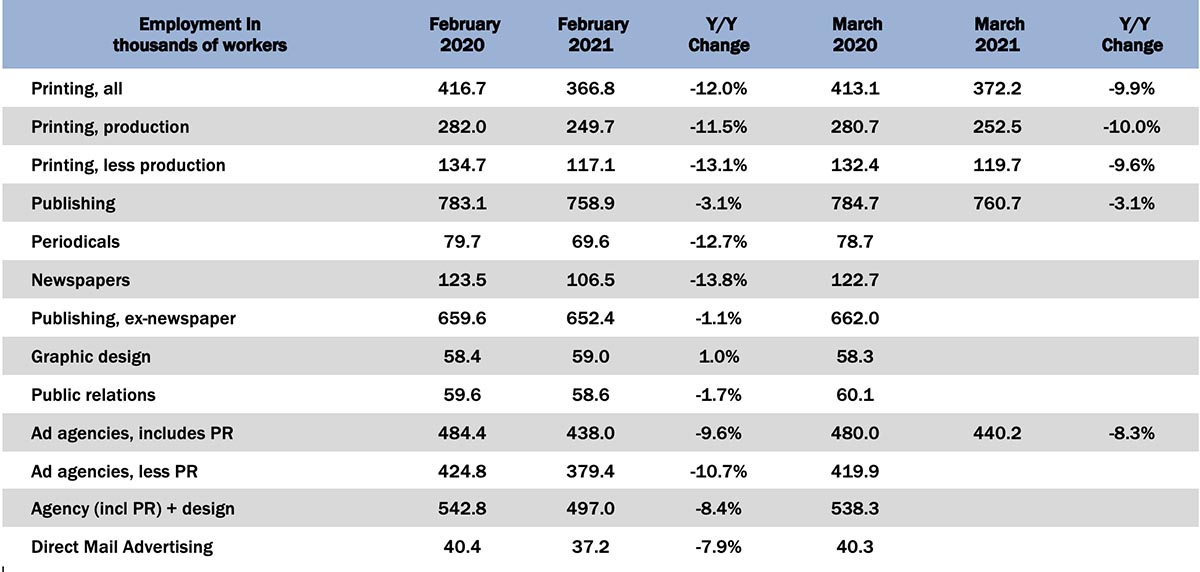
Graphic Arts Employment—February 2021
Published: March 19, 2021
In February 2021, all printing employment is down -0.5% from January, production employment down -0.4%, and non-production printing employment down -0.8%. Full Analysis
Printing 2021 Quick Look: 2020 Jobs/Orders
Published: March 17, 2021
According to data from our recently published Printing Outlook 2021 special report, the average number of jobs decreased -10.8% from 2019 to 2020. Full Analysis
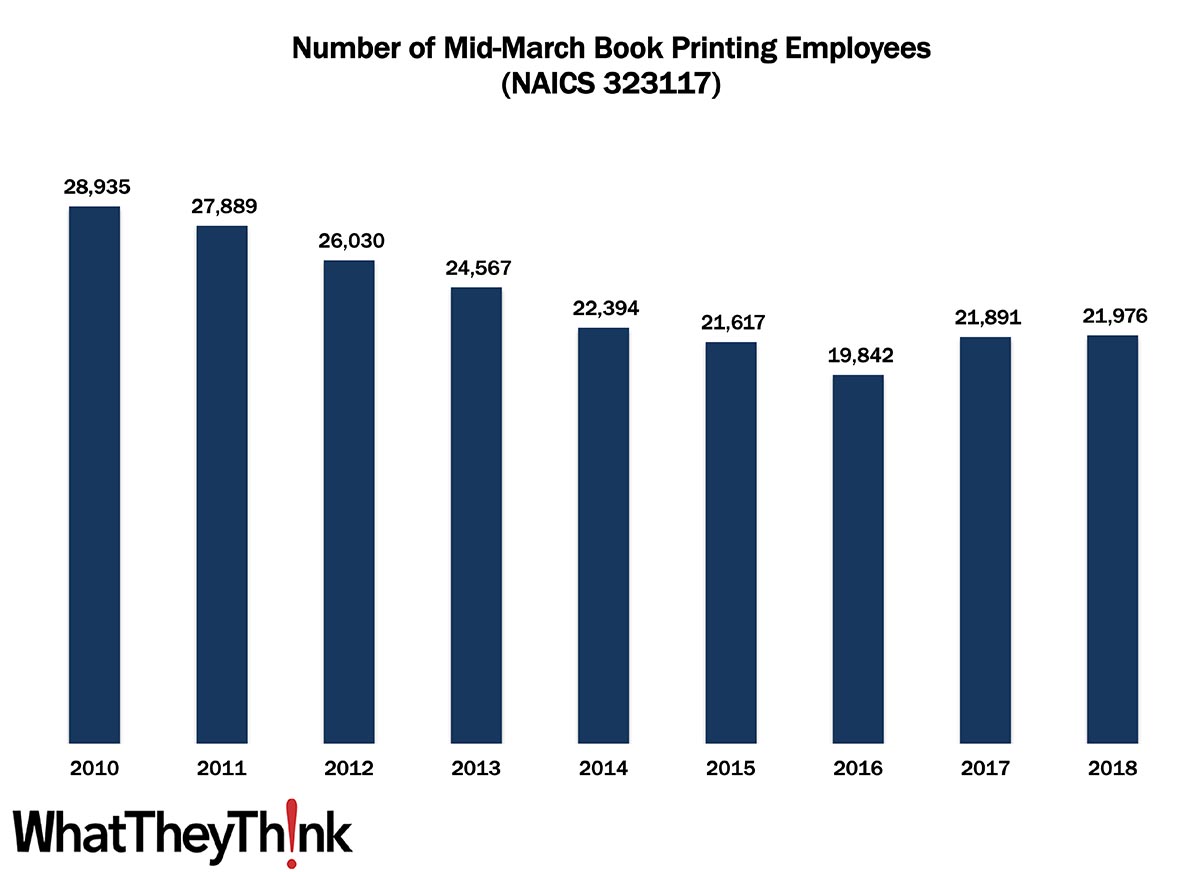
Book Printing Employees—2010–2018
Published: March 12, 2021
According to County Business Patterns, in 2010, there were 28,935 employees in NAICS 323117 (Book Printing Establishments). By 2018, employees had declined to 21,976. In macro news, inflation was soft in February. Full Analysis
Printing 2021 Quick Look: Anticipated 2021 Revenues
Published: March 10, 2021
According to data from our recently published Printing Outlook 2021 special report, print businesses expect print industry revenues to rebound +9.1% from 2020 to 2021. Full Analysis
January Printing Shipments—They Can Only Get Better from Here
Published: March 5, 2021
We kicked off 2021 inauspiciously with January printing shipments coming in at $6.61 billion, down from 2020’s $7.17 billion. It's the worst January in at least the last five years, but already things are boding well for the rest of 2021. Full Analysis
Printing Outlook 2021 Quick Look: 2020 Revenues
Published: March 3, 2021
According to data from our recently published Printing Outlook 2021 special report, print industry revenues dropped -12.6% from 2019 to 2020, compared to +4.1% from 2018 to 2019. Full Analysis
European Print Industry Snapshot: United Kingdom
Published: March 2, 2021
In this bimonthly series, WhatTheyThink is presenting the state of the printing industry in different European countries based on the latest monthly production numbers. This week, we take a look at the printing industry in the United Kingdom. Full Analysis
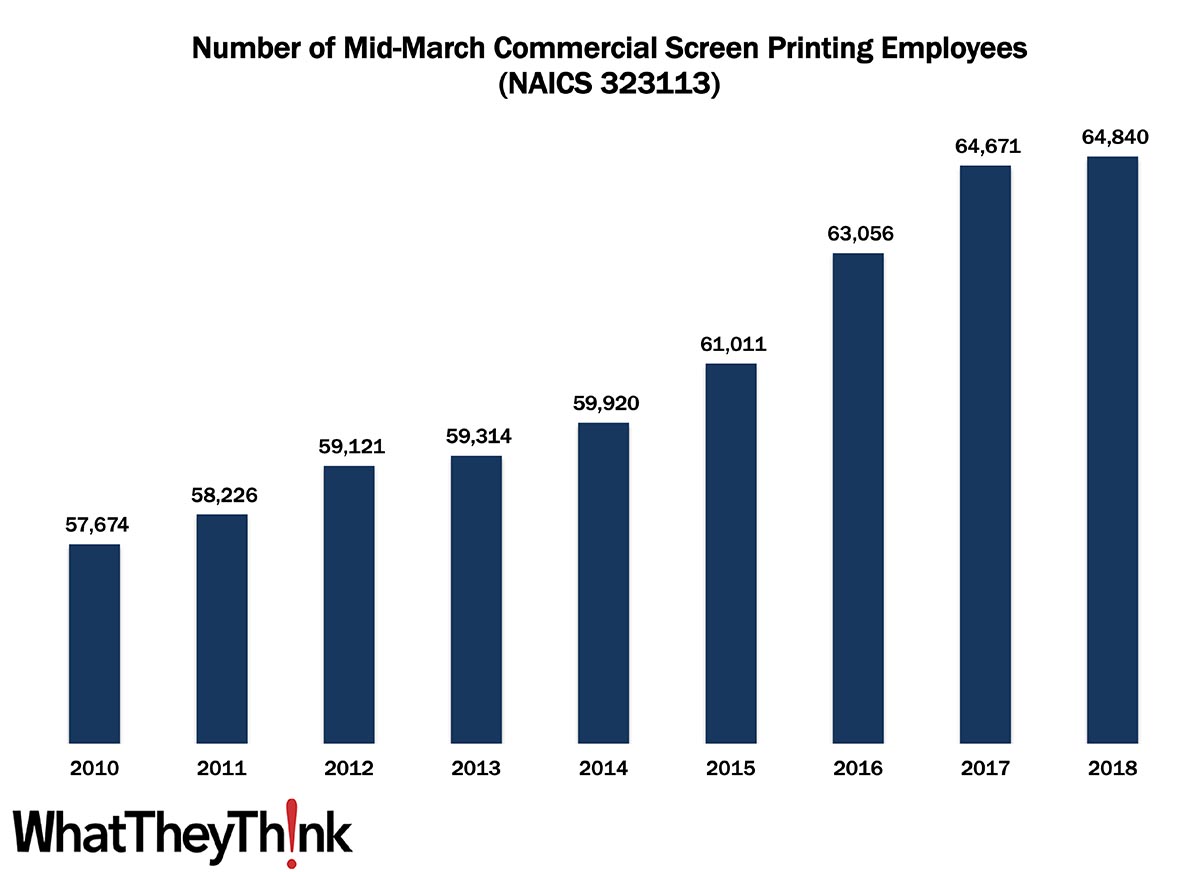
Commercial Screen Printing Employees—2010–2018
Published: February 26, 2021
In 2010, there were 57,674 employees working in US screen printing establishments (NAICS 323113). By 2018, that number had increased +12.4% to 64,840. In macro news, seven “recovery indicators” for parts of the economy most acutely impacted by the pandemic. Full Analysis
December Printing Shipments—One Last Unexpected Twist for 2020
Published: February 19, 2021
In December 2020, in one last, end-of-the-year rally, printing shipments grew from $7.0 billion to $7.17 billion. Full Analysis
European Print Industry Snapshot: Germany
Published: February 15, 2021
In this bimonthly series, WhatTheyThink is presenting the state of the printing industry in different European countries based on the latest monthly production numbers. This week, we take a look at the printing industry in Germany. Full Analysis
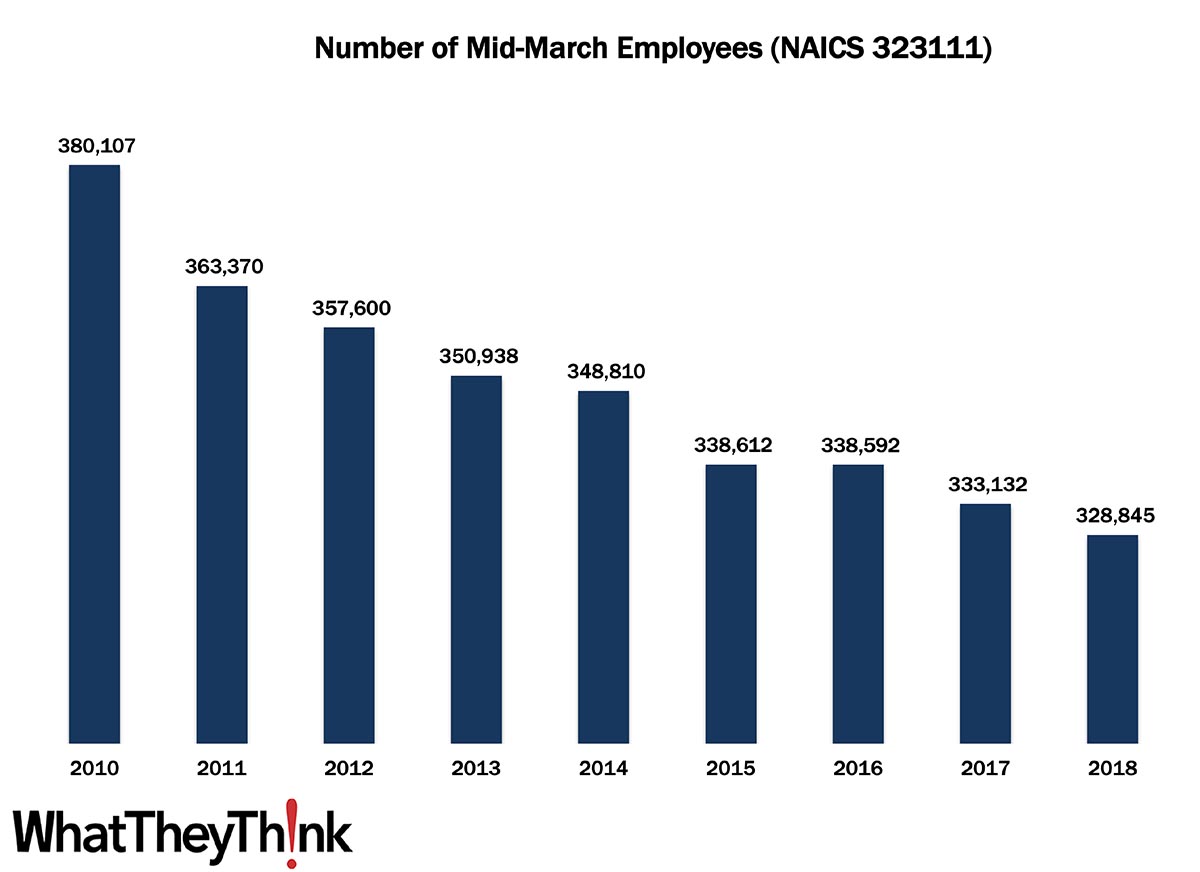
Commercial Printing Employees (Less Screen and Books)—2010–2018
Published: February 12, 2021
In 2010, there were 380,107 employees working in US establishments in NAICS 323111 (Commercial Printing–Except Screen and Books). By 2018, that number had declined -13.5% to 328,845. In macro news, the Consumer Price Index (CPI) increased 0.3% in January, or 1.4% over the last 12 months. Full Analysis
Q3 2020 Profits—Back on Track…Sort Of
Published: February 5, 2021
Annualized printing industry profits for Q3 2020 rose from -$1.92 billion to -$1.19 billion. That’s still really low, but at least it’s headed back toward positive territory. Full Analysis
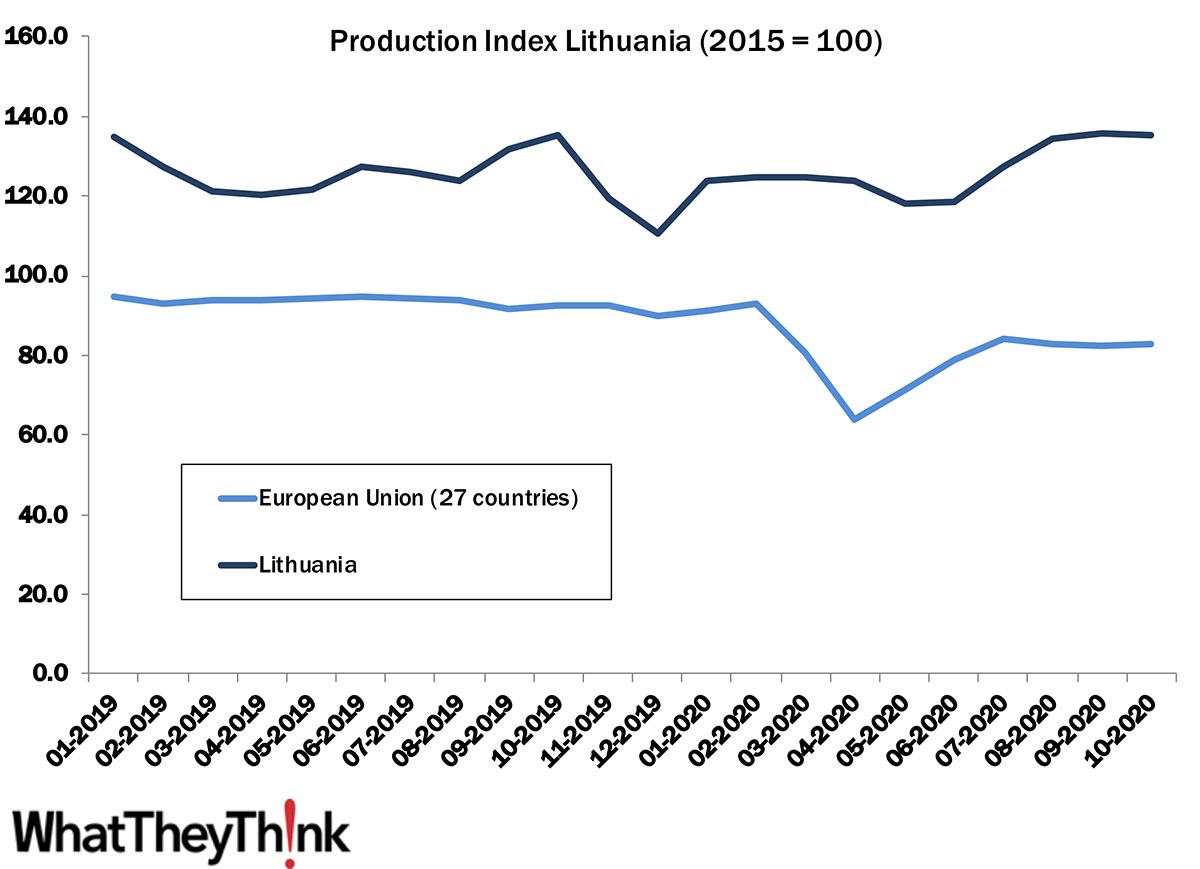
European Print Industry Snapshot: Lithuania
Published: February 1, 2021
In this bimonthly series, WhatTheyThink is presenting the state of the printing industry in different European countries based on the latest monthly production numbers. This week, we take a look at the printing industry in Lithuania and the Baltic states. Full Analysis
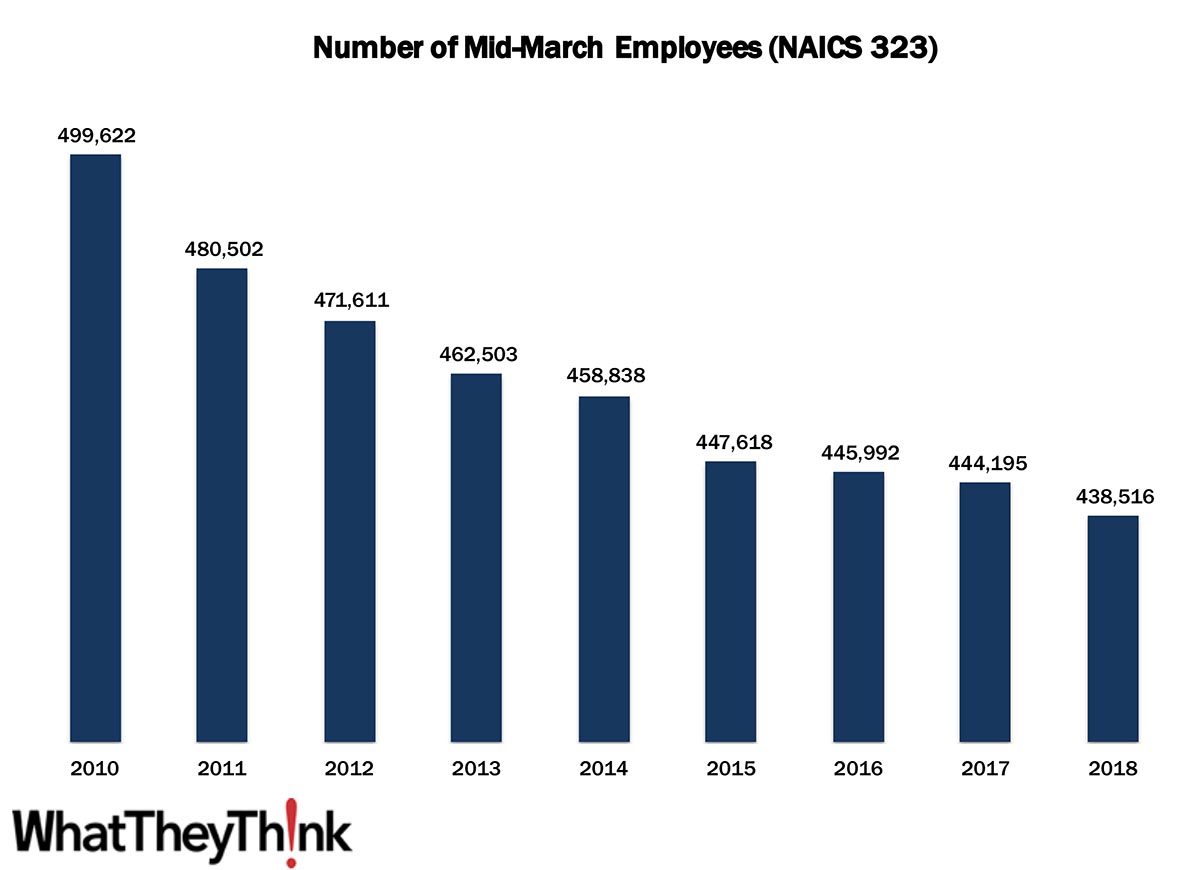
Commercial Printing Employees—2010–2018
Published: January 29, 2021
In 2010, there were 499,622 employees working in US establishments in NAICS 323. By 2018, that number had declined -12.2% to 438,516. In macro news, real GDP increased at an annual rate of 4.0% in Q4 2020. Full Analysis
Graphic Arts Employment—December 2020
Published: January 22, 2021
In December 2020, all printing employment was up +0.7% from November, production employment up +0.1%, and non-production printing employment up +1.9%. So, basically, a holding pattern—although it’s nice that there are no negative numbers…for almost everyone. Full Analysis
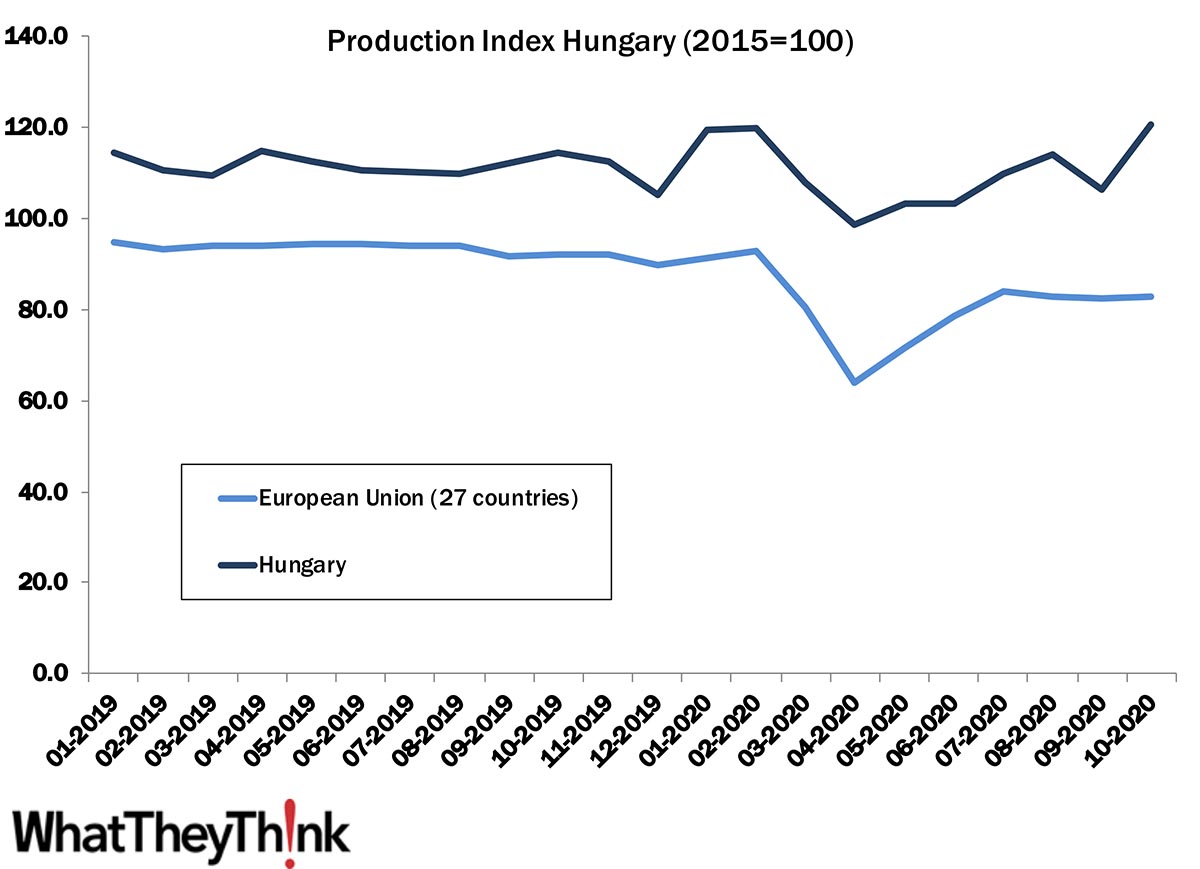
European Print Industry Snapshot: Hungary
Published: January 18, 2021
In this bimonthly series, WhatTheyThink is presenting the state of the printing industry in different European countries based on the latest monthly production numbers. This year kicks off with a look at the printing industry in Hungary. Full Analysis
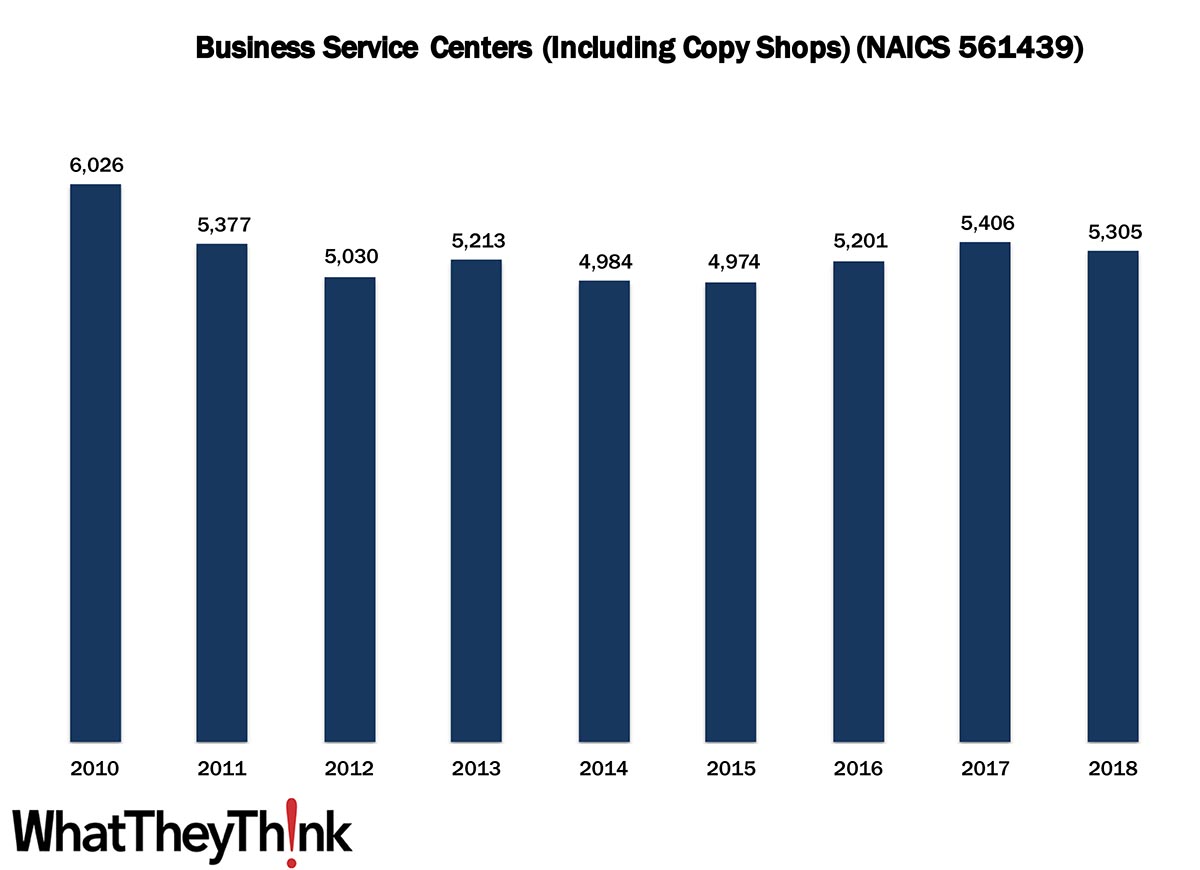
US Copy Center Establishments—2010–2018
Published: January 15, 2021
In 2010, there were 6,026 establishments in NAICS 561439 (Business Service Centers [Including Copy Shops]). By 2018, that number had declined to 5,305. In macro news, weekly initial unemployment claims were at 965,000, an increase of 181,000 from the previous week. Full Analysis
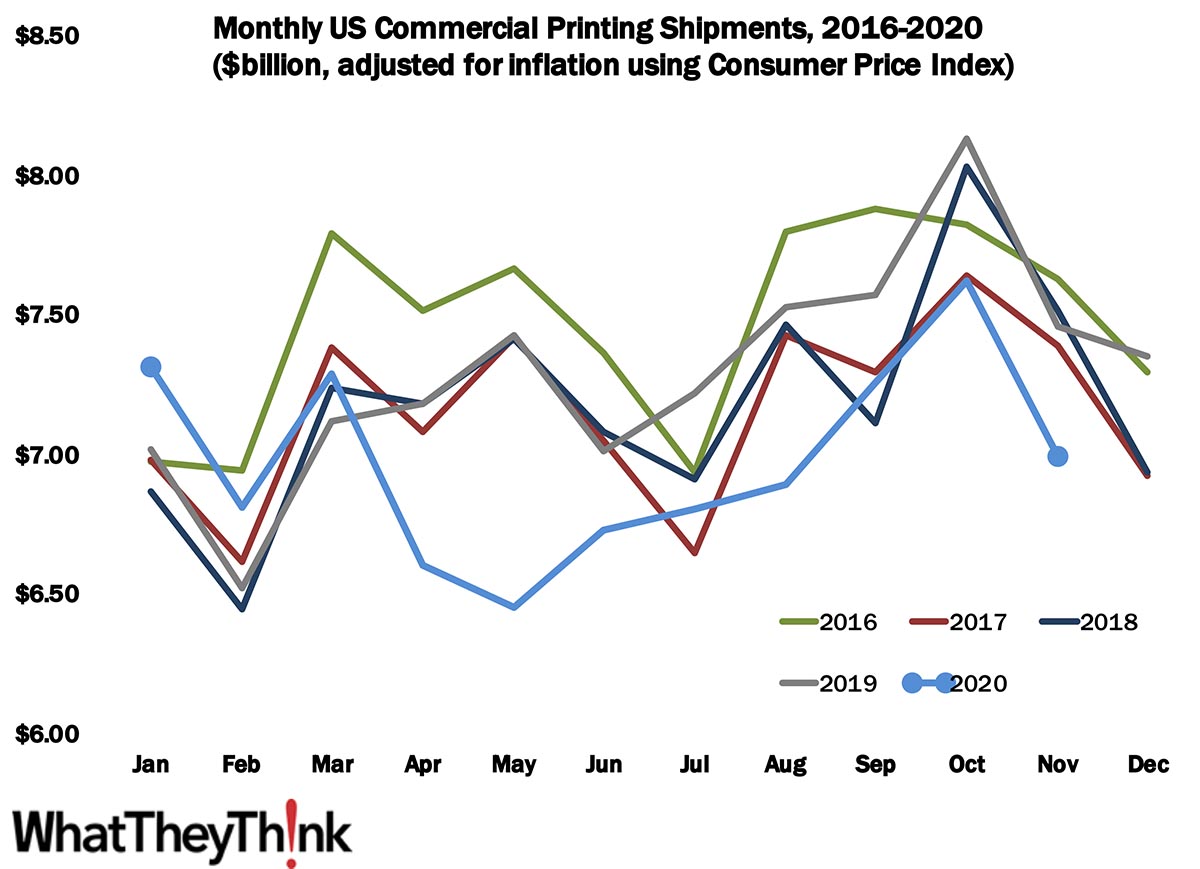
November Printing Shipments—It Was Nice While It Lasted
Published: January 8, 2021
In November 2020, after rising for five straight months, printing shipments plunged from $7.63 billion to $7.0 billion. Full Analysis
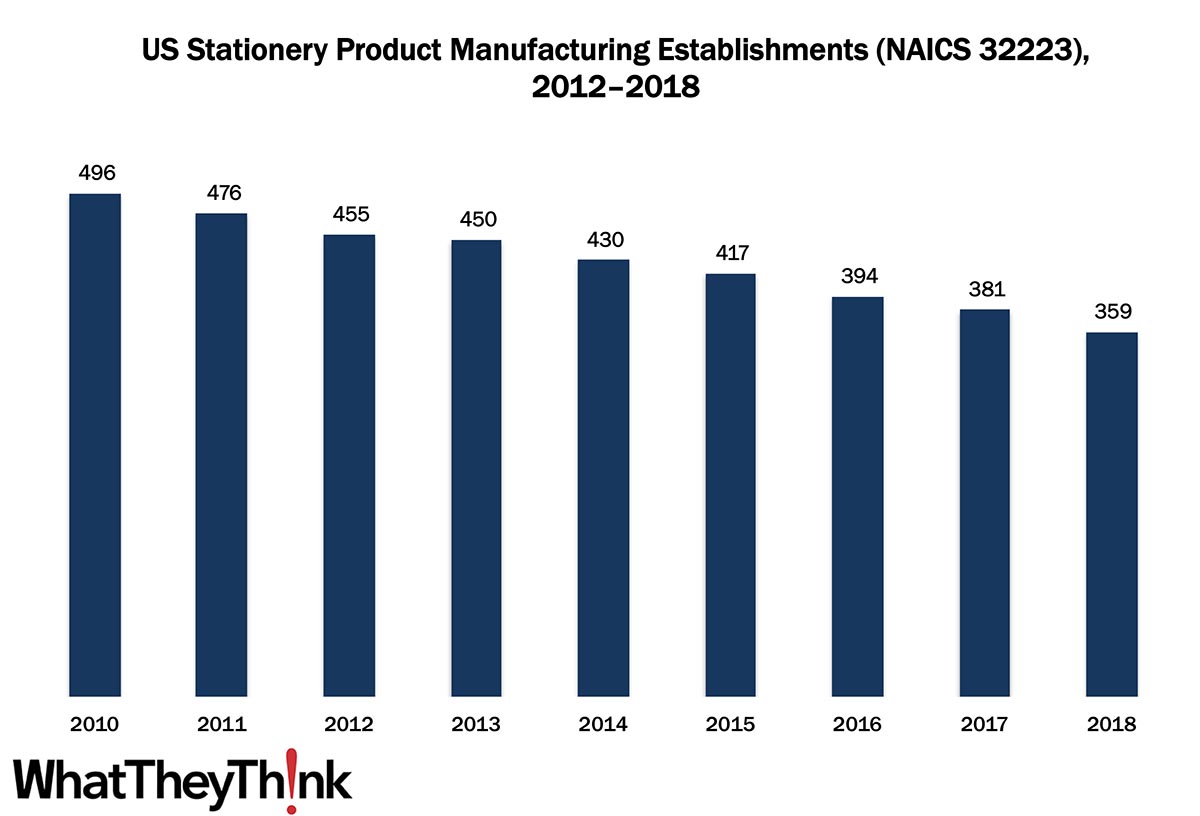
Stationery Product Manufacturing Establishments—2012–2018
Published: December 18, 2020
In 2010, there were 496 establishments in NAICS 32223 (Stationery Product Manufacturing). By 2018, that number had declined to 359. In macro news, retail sales for November took a dip. Full Analysis
European Print Industry Snapshot: Turkey
Published: December 15, 2020
In this bimonthly series, WhatTheyThink is presenting the state of the printing industry in different European countries based on the latest monthly production numbers. This last installment for 2020 features a look at the printing industry in Turkey. Full Analysis
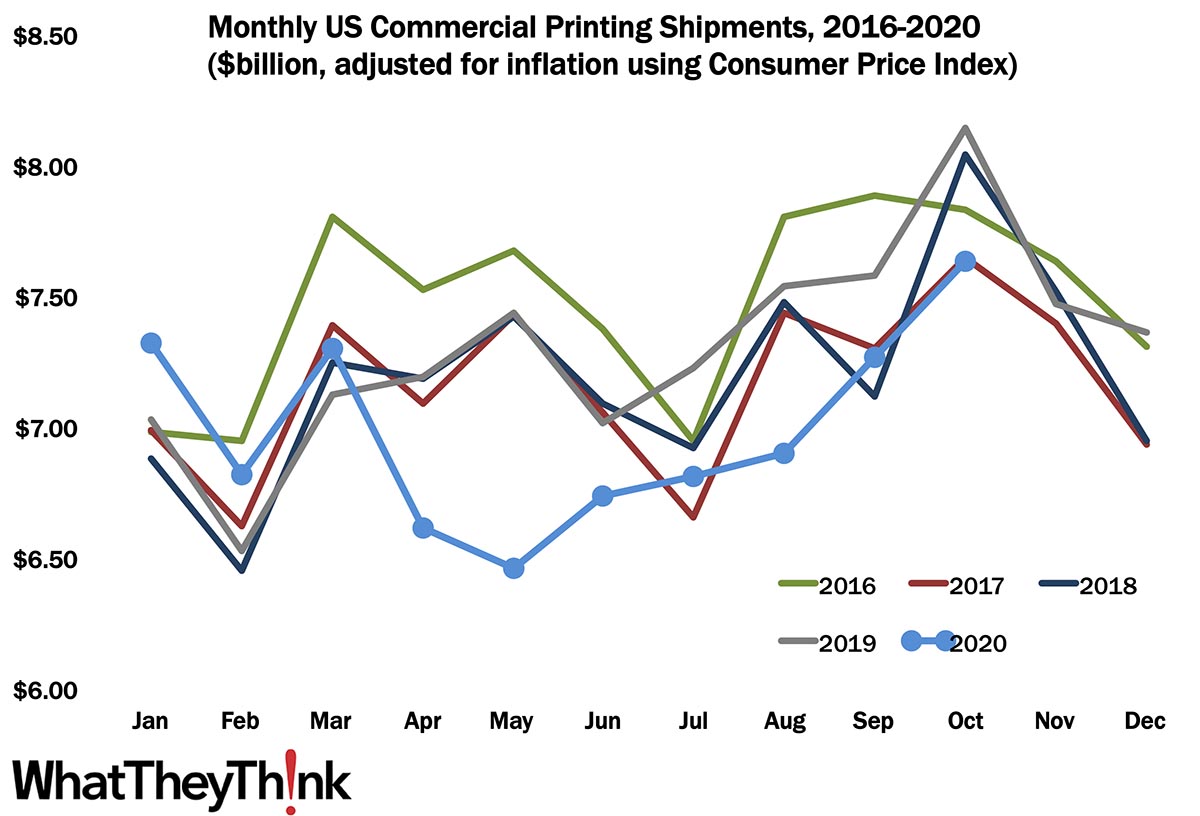
October Printing Shipments—The "Best" October in Five Years?
Published: December 11, 2020
In October 2020, printing shipments rose to $7.63 billion—the fifth straight month of increasing shipments, as the industry rebound from the depths of the spring continues. Full Analysis
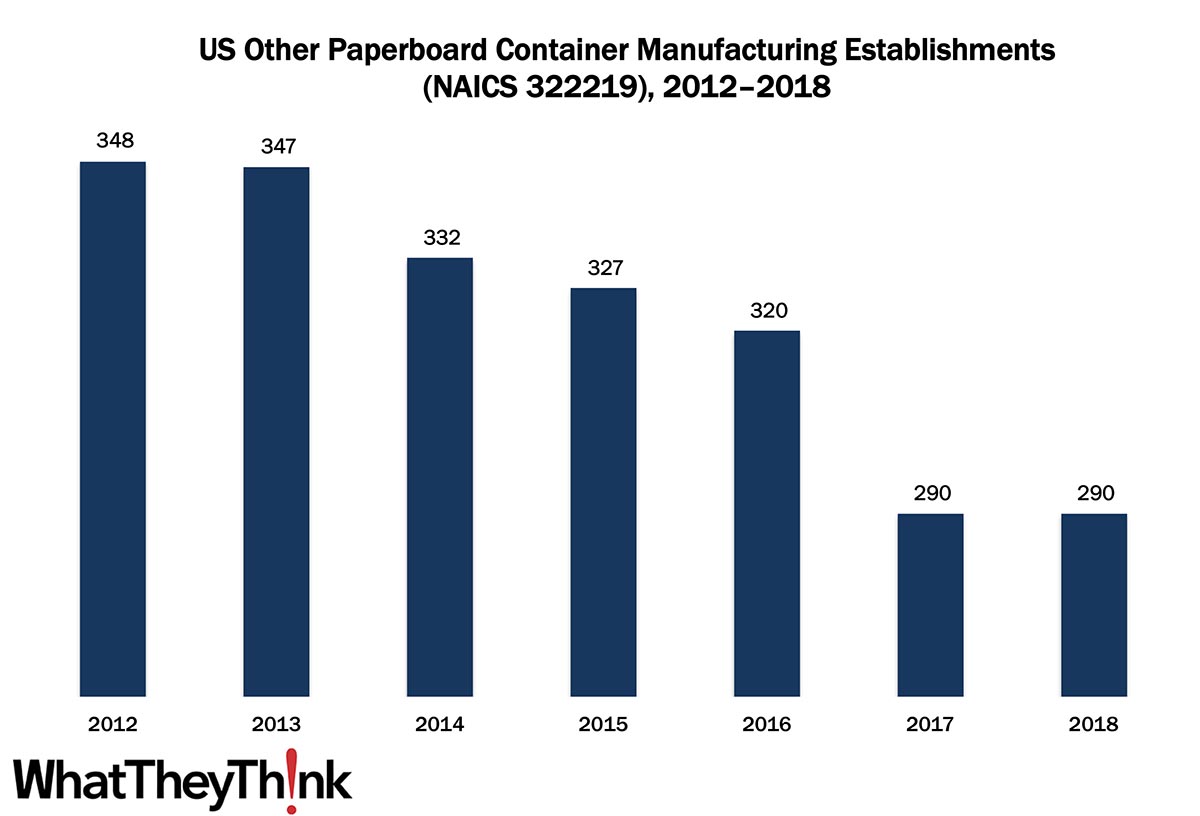
Other Paperboard Container Manufacturing Establishments—2012–2018
Published: December 4, 2020
In 2012, there were 348 establishments in NAICS 322219 (Other Paperboard Container Manufacturing). By 2018, that number had declined to 290. In macro news, highlights (if you want to call them that) from the most recent Federal Reserve “Beige Book.” Full Analysis
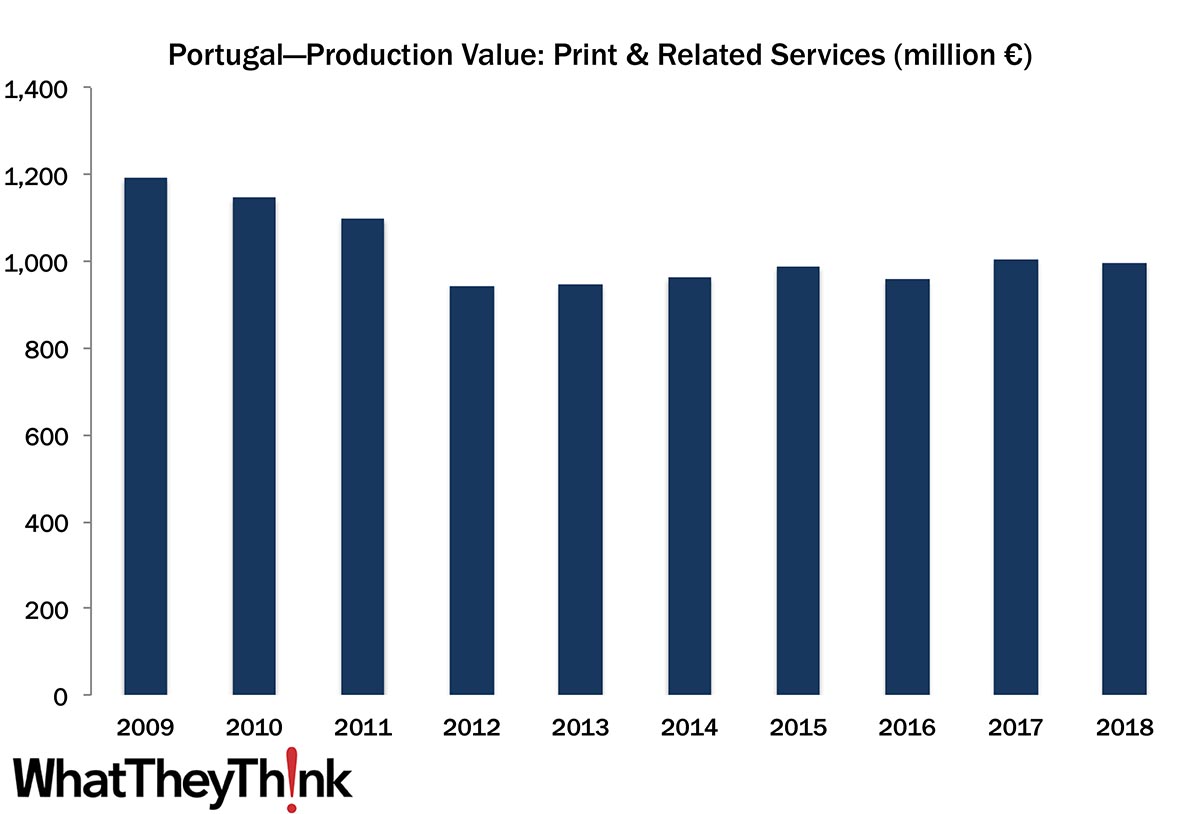
European Print Industry Snapshot: Portugal
Published: December 2, 2020
In this bimonthly series, WhatTheyThink is presenting the state of the printing industry in different European countries based on the latest monthly production numbers. This week features a look at the printing industry in Portugal. Full Analysis
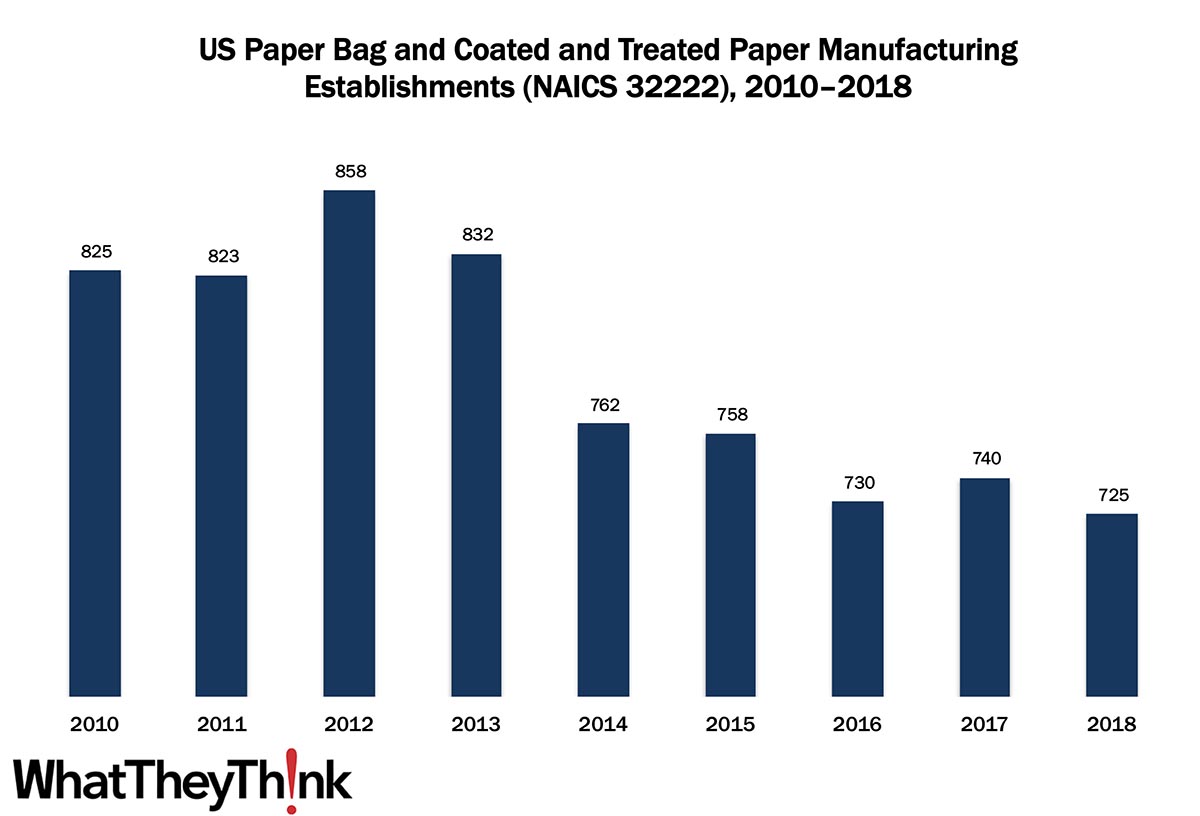
Paper Bag and Coated and Treated Paper Manufacturing Establishments—2010–2018
Published: November 20, 2020
In 2010, there were 825 establishments in NAICS 32222 (Paper Bag and Coated and Treated Paper Manufacturing). By 2018, that number had declined to 725, despite a spurt of growth in 2012. In macro news, initial unemployment claims were 742,000, an increase of 31,000 from the previous week's revised level. Full Analysis
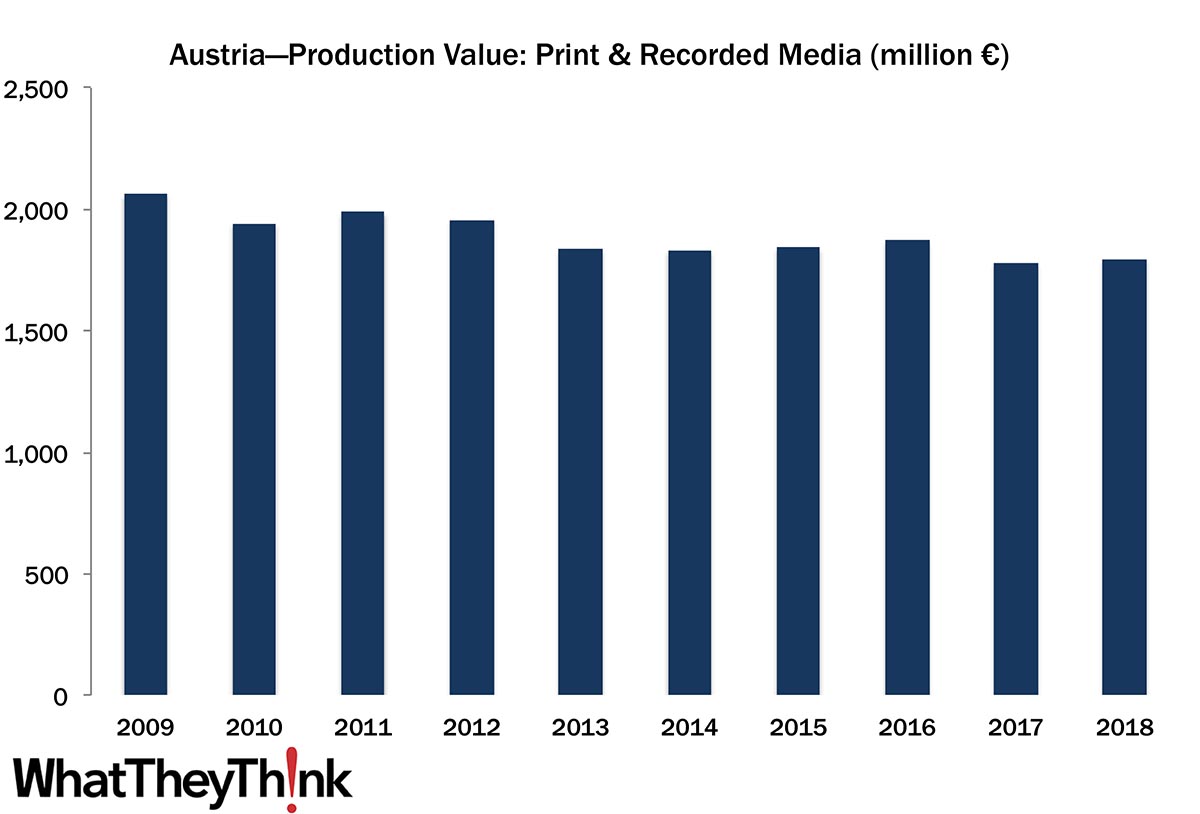
European Print Industry Snapshot: Austria
Published: November 17, 2020
In this bimonthly series, WhatTheyThink is presenting the state of the printing industry in different European countries based on the latest monthly production numbers. This week features a look at the printing industry in Austria. Full Analysis
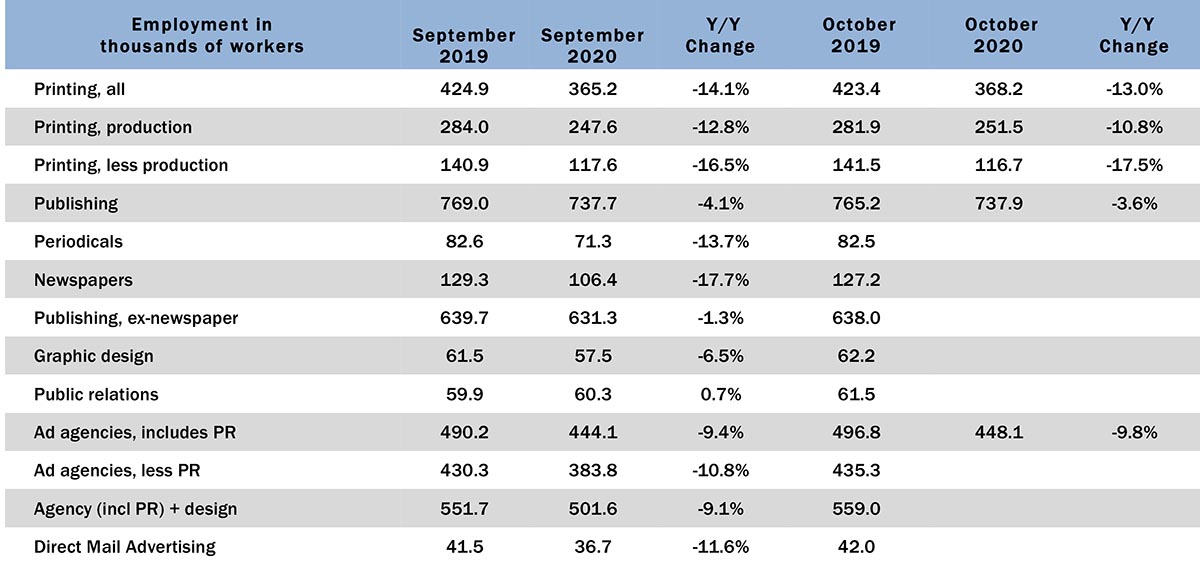
Graphic Arts Employment—October 2020
Published: November 13, 2020
October 2020 employment figures are at least moving in the right direction from September, albeit slowly; overall printing employment in October was up +0.8% from September, with the gains predominantly in production staff continuing to come back. Let’s not look at year-over-year changes in graphic arts employment. Full Analysis
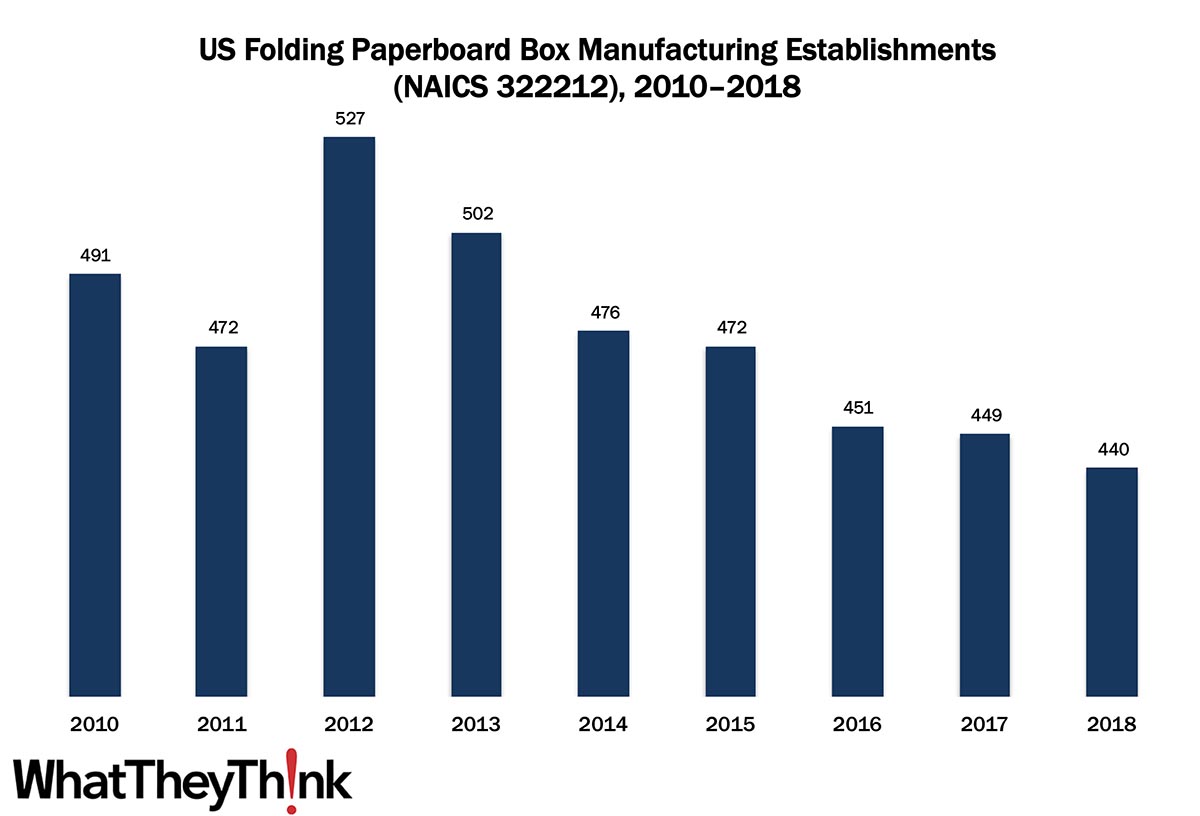
Folding Paperboard Box Manufacturing Establishments—2010–2018
Published: November 6, 2020
In 2010, there were 491 establishments in NAICS 322212 (Folding Paperboard Box Manufacturing). By 2018, that number had declined to 440, despite a spurt of post-recession growth. In macro news, the BEA’s advance estimate of 3Q GDP saw it increasing +33.1%—a climbing out of Q2’s -31.4% hole. Full Analysis
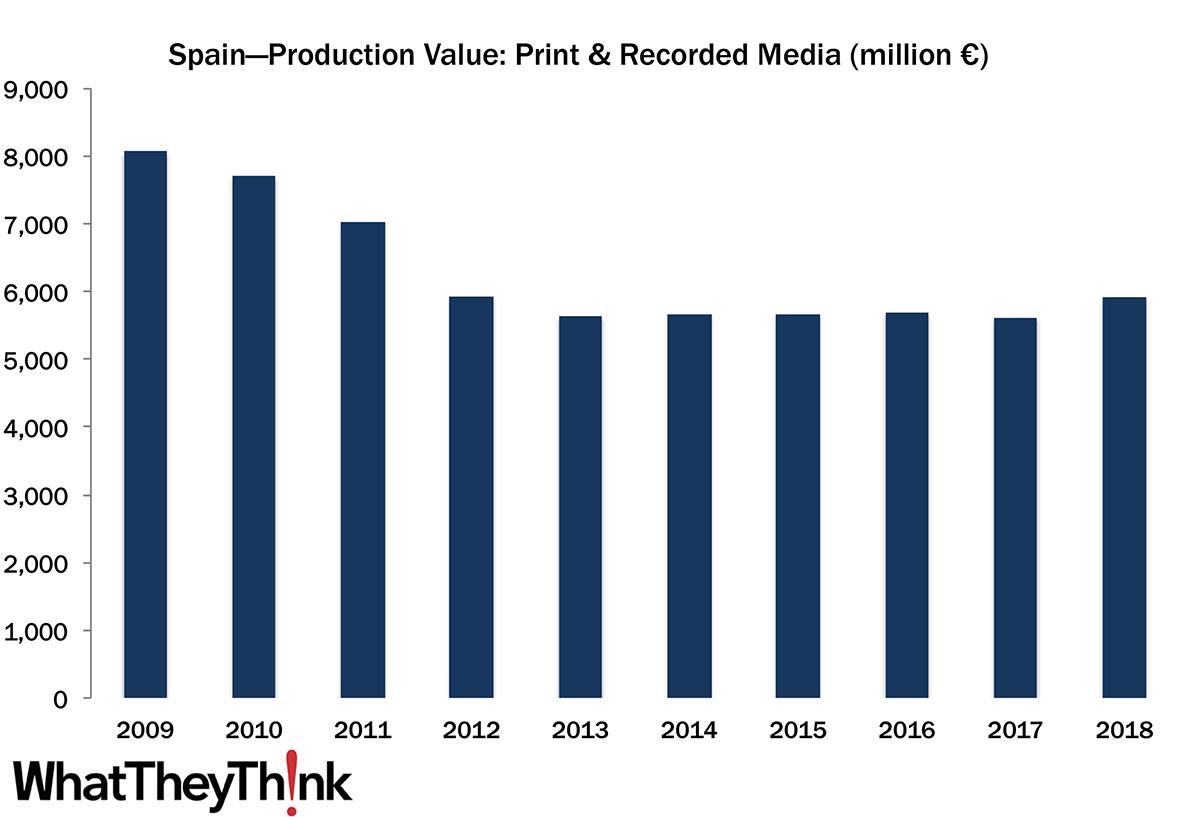
European Print Industry Snapshot: Spain
Published: November 3, 2020
In this bimonthly series, WhatTheyThink is presenting the state of the printing industry in different European countries based on the latest monthly production numbers. This week features a look at the printing industry in Spain. Full Analysis
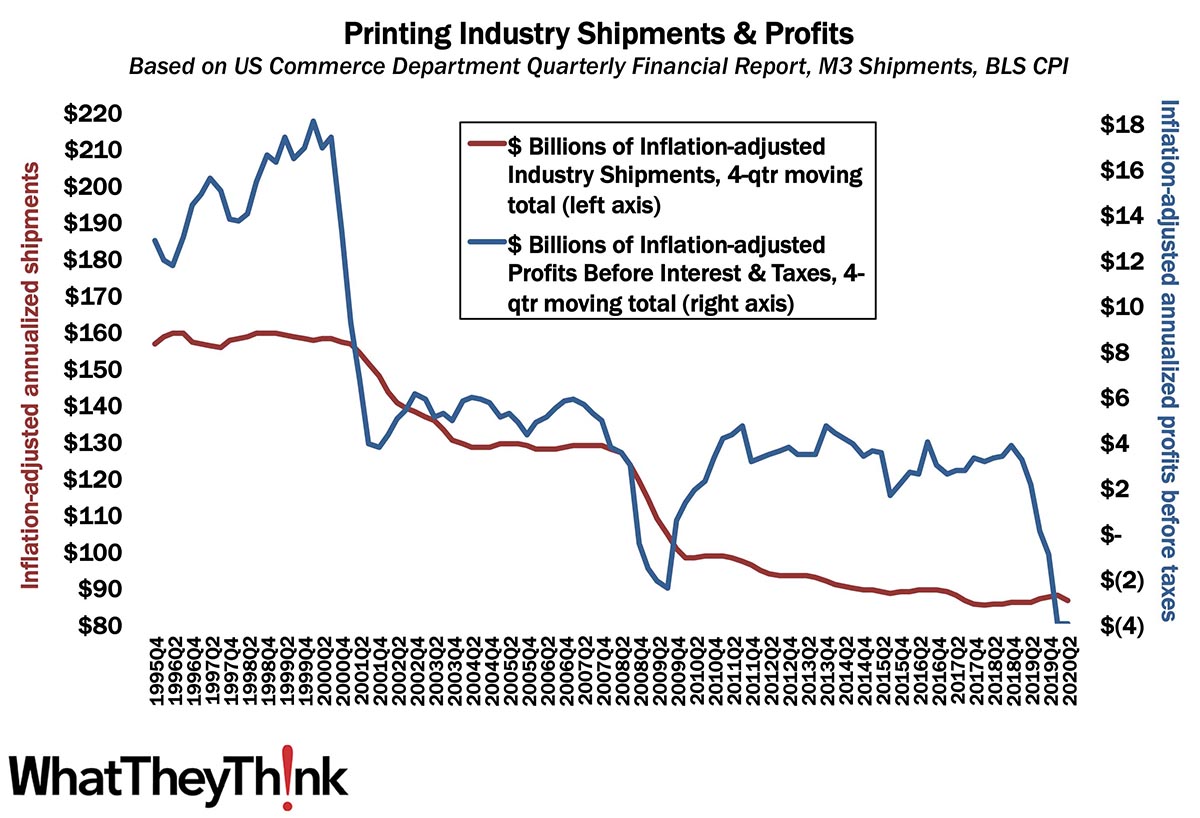
Q2 Profits Unchanged from Q1—But Still Bad
Published: October 30, 2020
Given the lag time in the release of quarterly profits, we have to time travel back to Q2, much as it pains us to do so, where we see that annualized profits for Q2 2020 stayed steady at -$4 billion. Full Analysis
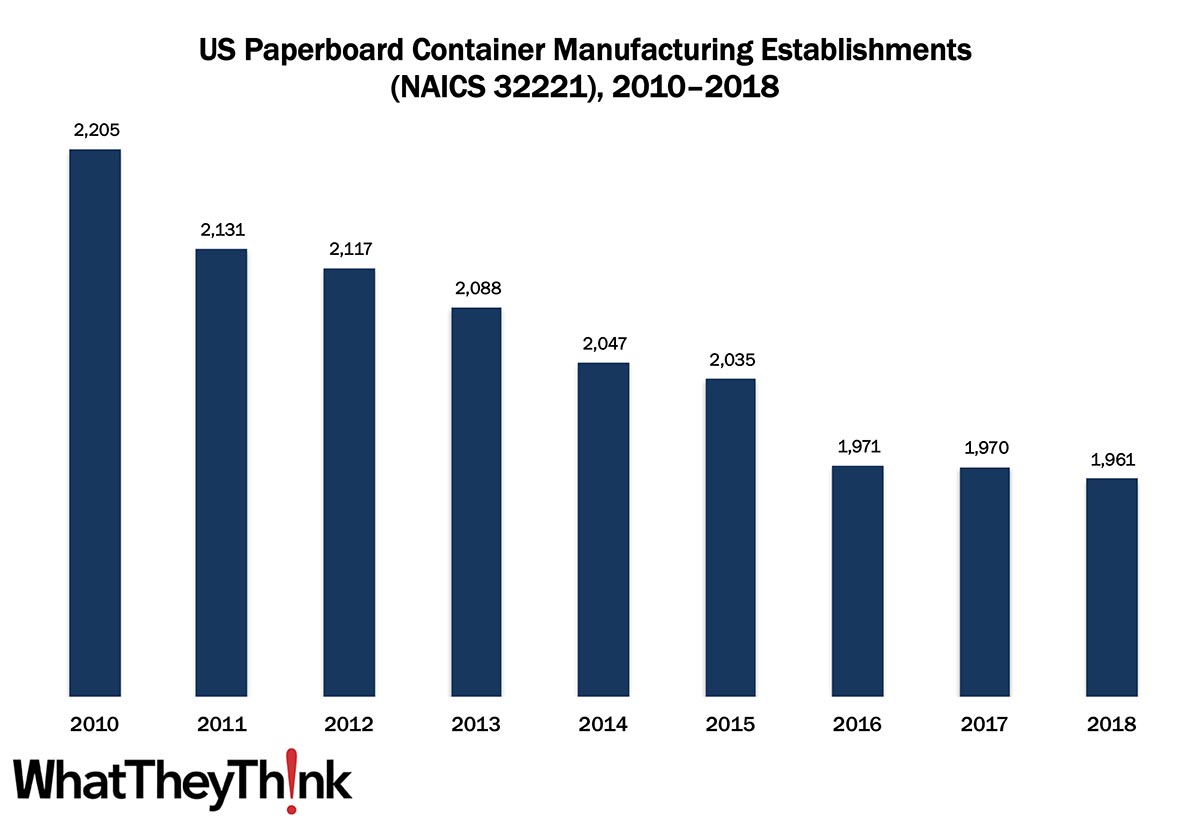
Paperboard Container Manufacturing Establishments—2010–2018
Published: October 23, 2020
In 2010, there were 2,205 establishments in NAICS 32221 (Paperboard Container Manufacturing). By 2018, that number had declined -11% to 1,961. In macro news, the American Institute of Architects’ Architecture Billings Index (ABI) score was up in September. This is a leading indicator for the economy in general, but also for the signage market in particular. Full Analysis
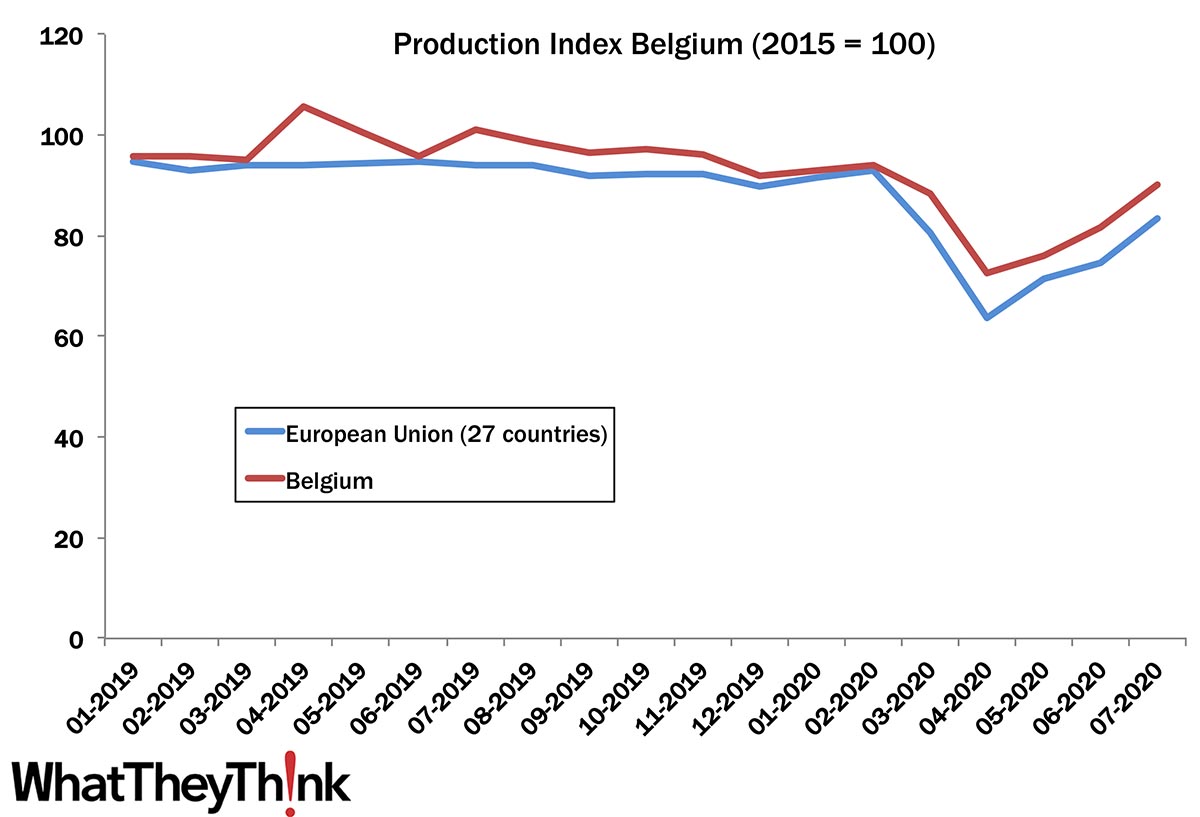
European Print Industry Snapshot: Belgium
Published: October 20, 2020
According to the Eurostat production index, the printing industry in Belgium did fairly well in 2019 and even during the COVID-19 crisis in 2020, despite the country being hit hard by the virus. Although production volumes in 2019 were down compared to 2015, Belgium did better than the European Union average in the production index for printing and recorded media. Full Analysis
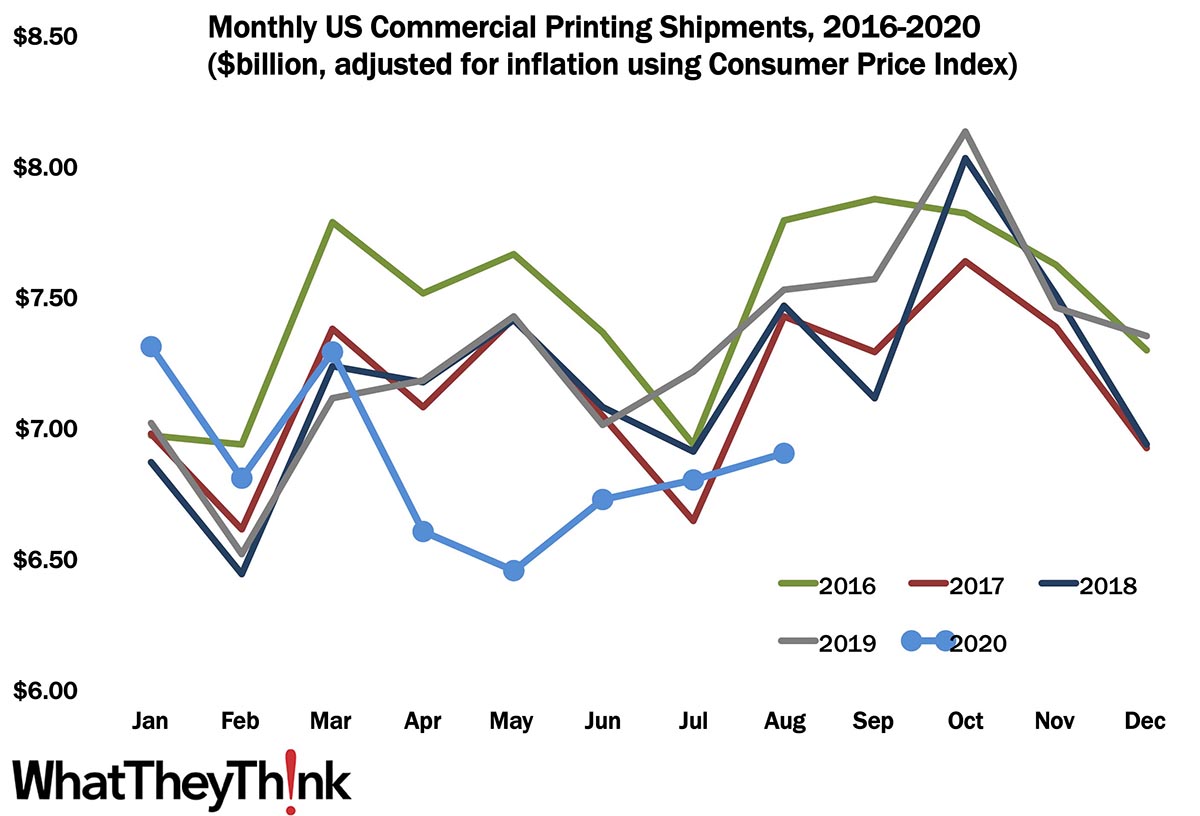
August Printing Shipments—The Rebound Continues
Published: October 16, 2020
In August 2020, printing shipments rose to $6.90 billion—the third straight month of increasing shipments—and while it’s still well below August 2019’s $7.52 billion, given where we came from, that ain’t bad. Full Analysis
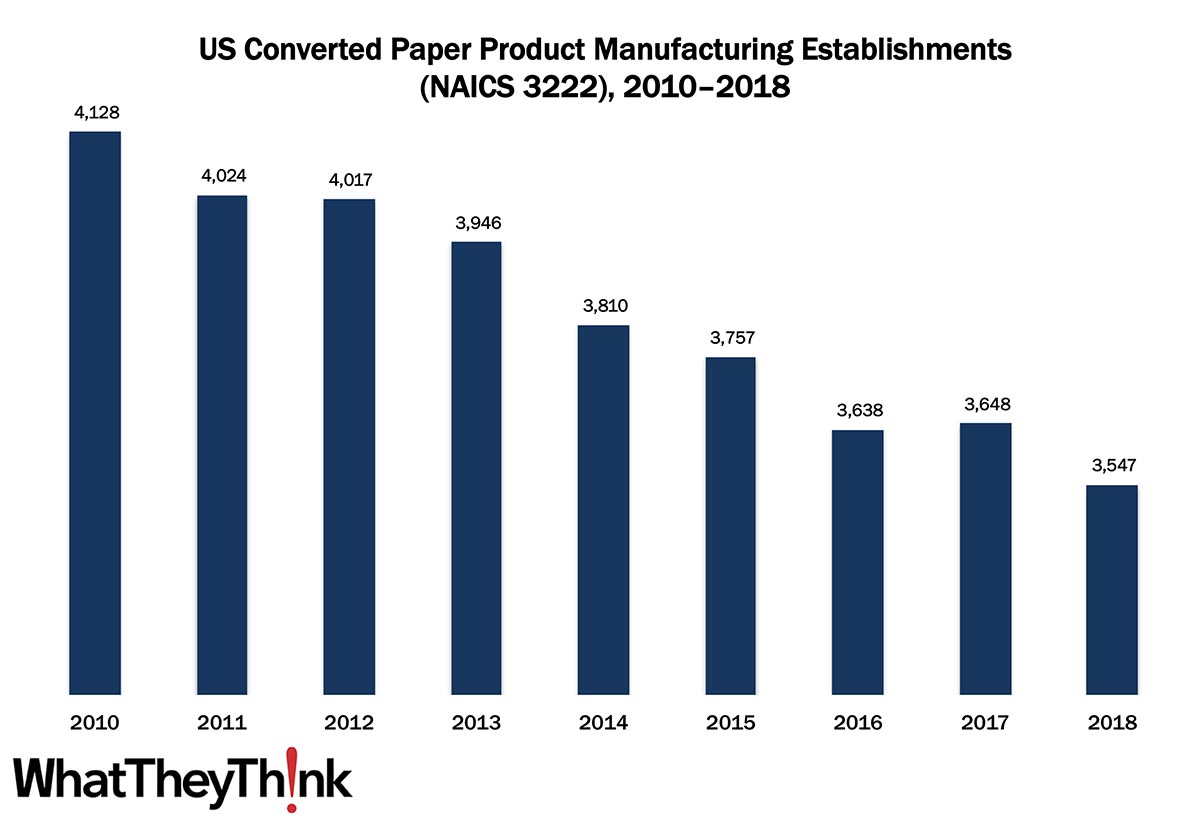
Converted Paper Product Manufacturing Establishments—2010–2018
Published: October 9, 2020
In 2010, there were 4,128 establishments in NAICS 3222 (Converted Paper Product Manufacturing). By 2018, that number had declined -12% to 3,547. In macro news, the unemployment rate drops, but not entirely for the right reasons. Full Analysis
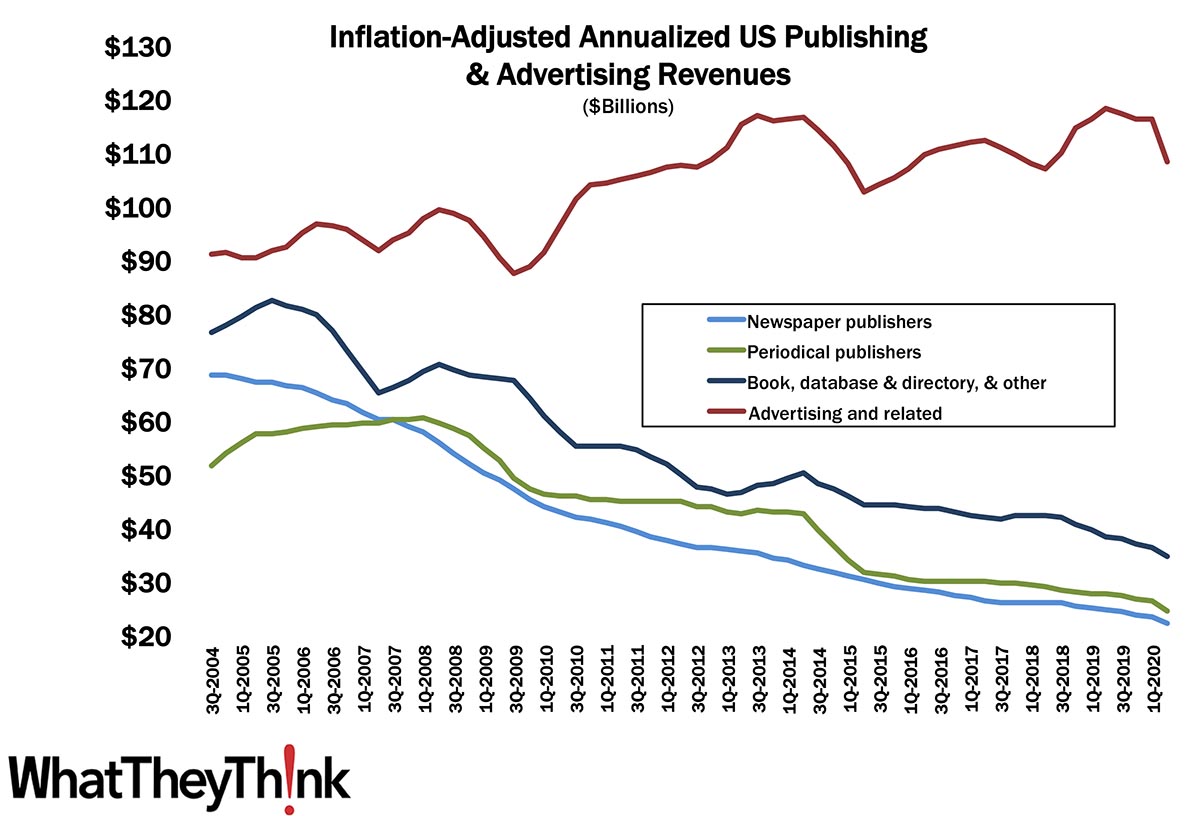
Q2 Publishing and Advertising Revenues
Published: October 2, 2020
From Q1 to Q2, book, periodical, and newspaper publishers, as well as advertising and related markets, saw quarterly revenues drop, some quite abruptly. For some of these markets, the pandemic only accelerated trends that had been long-ongoing. Full Analysis
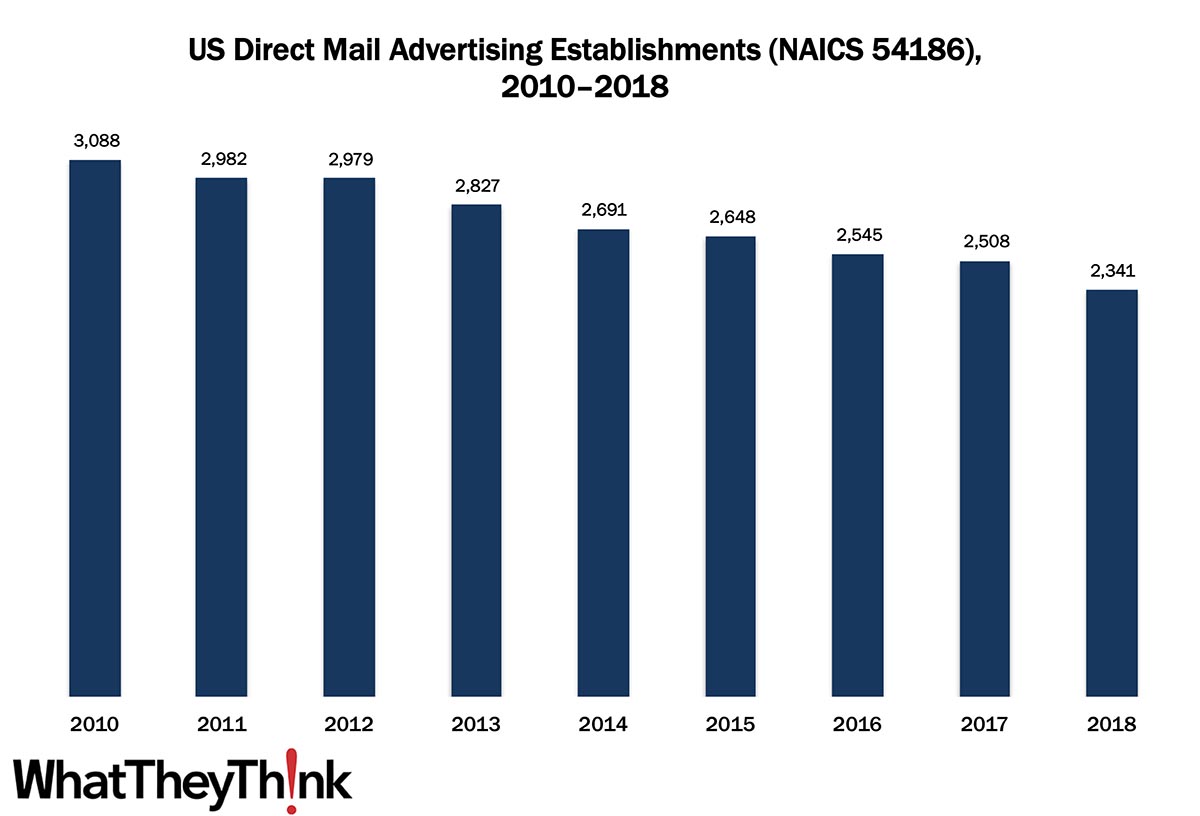
Direct Mail Advertising—2010–2018
Published: September 25, 2020
In 2010, there were 3,088 establishments in NAICS 54186 (Direct Mail Advertising). By 2018, the number of these establishments had dropped to 2,341. In macro news: initial unemployment claims rise again. Full Analysis
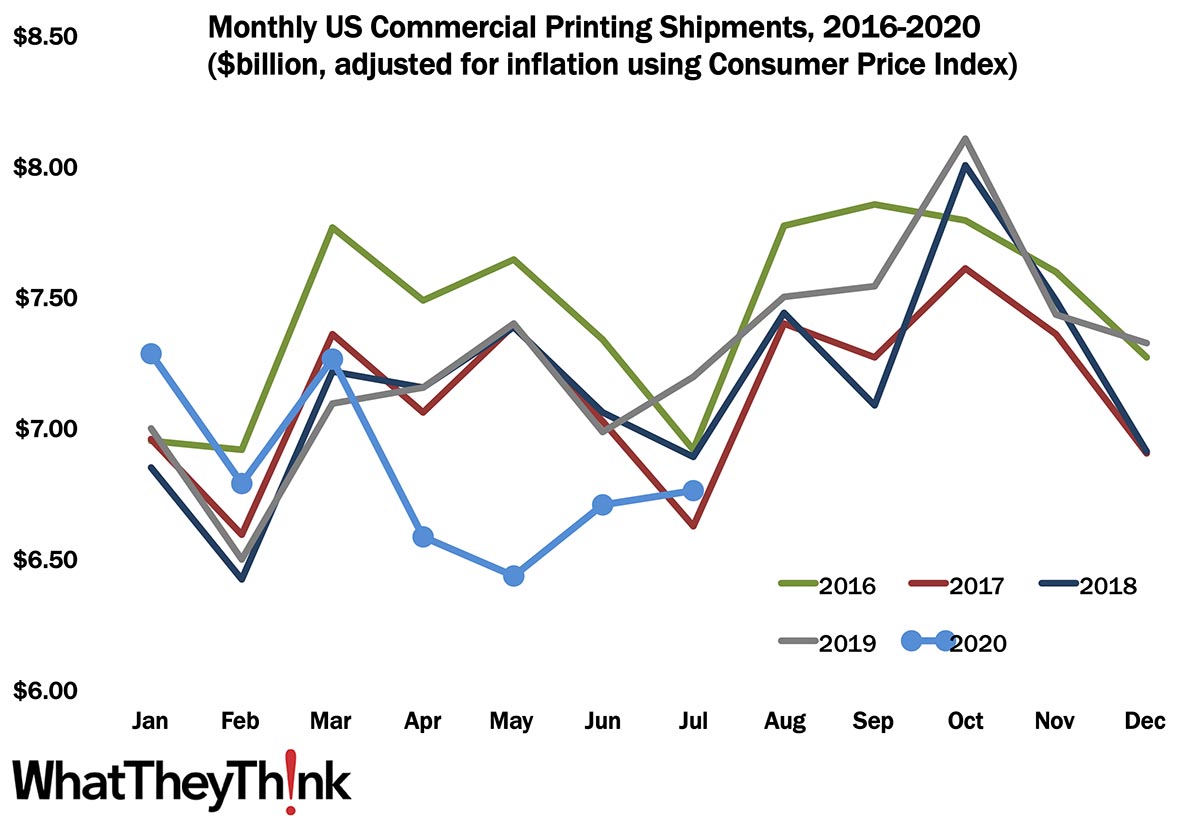
Printing Shipments: Summer’s Almost Gone
Published: September 18, 2020
Printing shipments continued to rebound in July, coming in at $6.75 billion, up from June’s $6.63 billion. We remain hopeful, but as we have been seeing lately, we are far from out of the woods virus-wise and we may see shipments start to decline again come the fall. Full Analysis
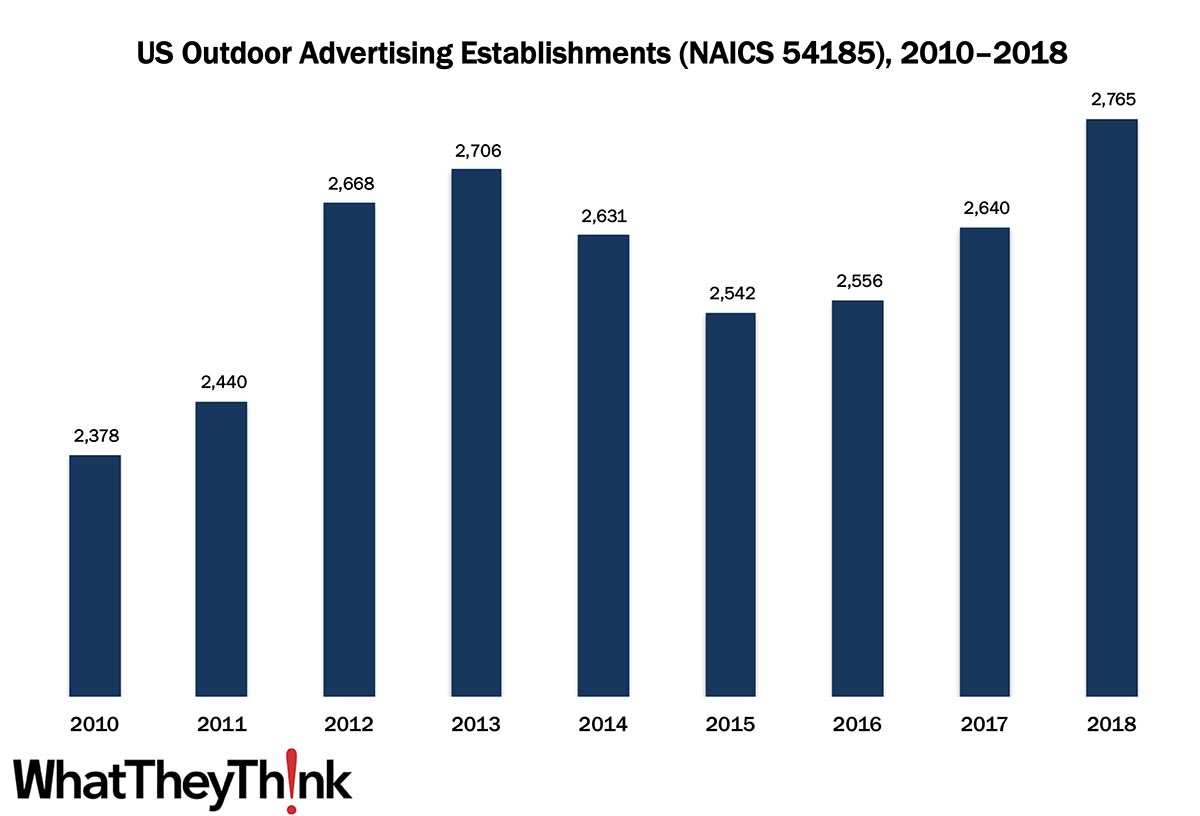
Outdoor Advertising—2010–2018
Published: September 11, 2020
In 2010, there were 2,378 establishments in NAICS 54185 (Outdoor Advertising, although until 2012 this category was referred to as “Display Advertising”). Establishments dipped in the mid-2010s, but hit a new peak in 2018 at 2,765 establishments. In macroeconomic news: unemployment is down, but unemployment claims data paint a dark picture. Full Analysis
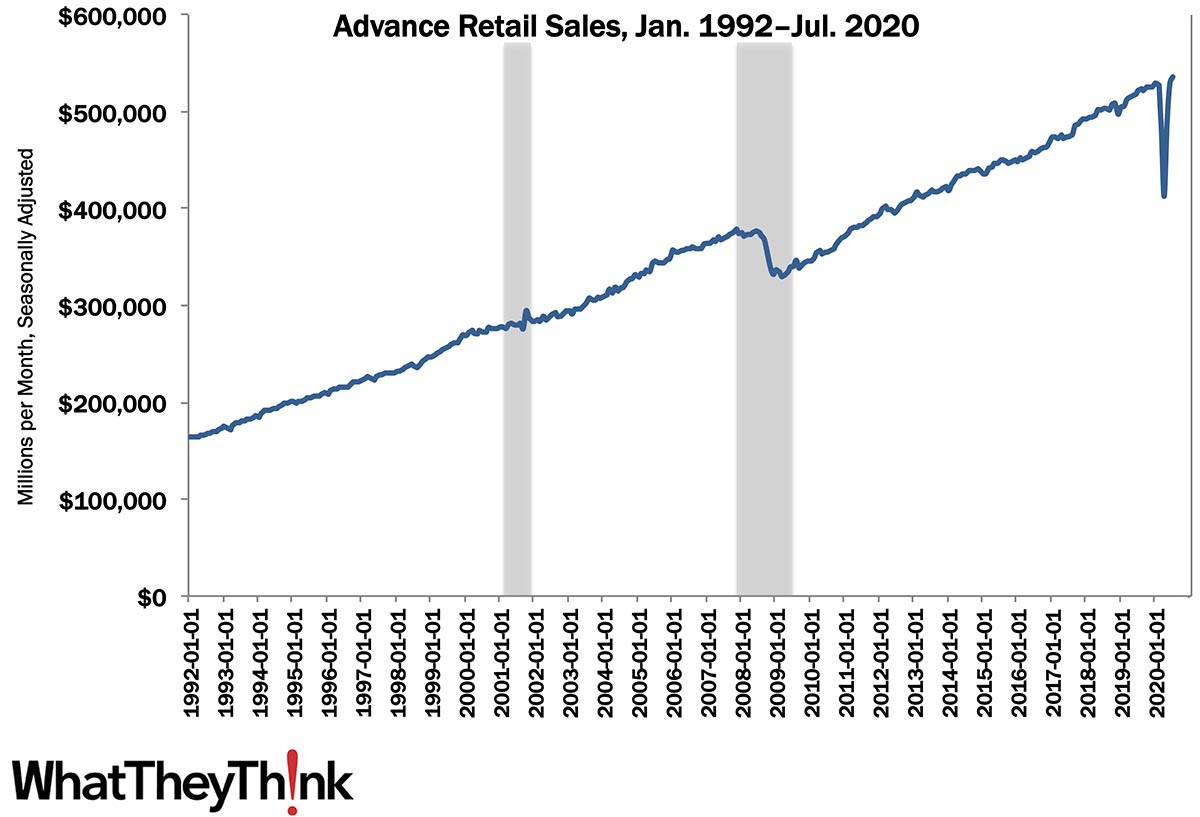
Retail Sales: A V-Shaped Recovery?
Published: September 4, 2020
The Census Bureau recently released its monthly report on retail sales, and after a dramatic plummeting, July retail sales were $536.0 billion, up 1.2% from June (seasonally adjusted), and 2.7% above July 2019. But this may paint a rosier picture of retail than is warranted. Full Analysis
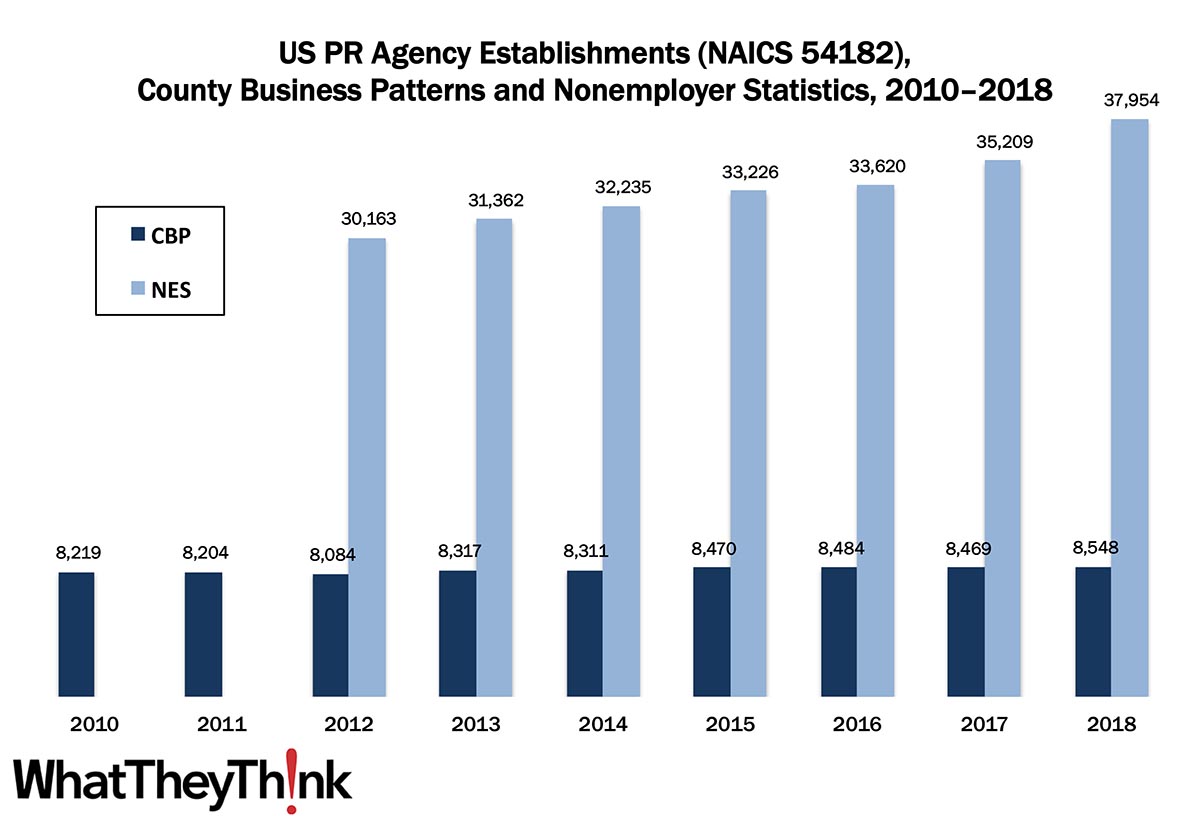
PR Agencies—2010–2018
Published: August 28, 2020
In 2010, there were 8,219 establishments in NAICS 54182 (Public Relations Agencies). After a slight contraction due to the Great Recession, PR agencies started to grow again, peaking at 8,548 establishments in 2018. In addition, we estimate there were an additional 37,954 freelance or sole proprietor PR agency establishments in 2018. In macro news: Q2 GDP revised up. Full Analysis
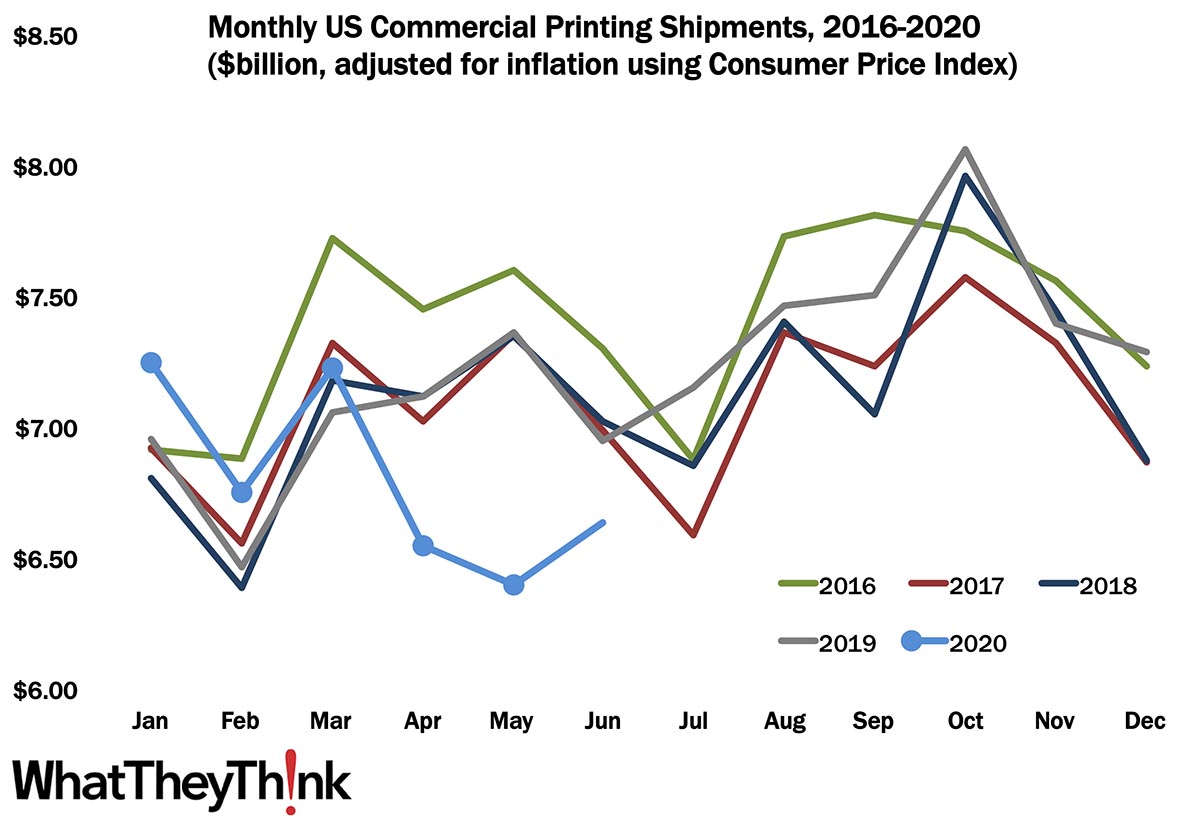
Printing Shipments On the Rebound: Will It Last?
Published: August 21, 2020
After a dismal April and May, printing shipments rebounded in June to $6.63 billion. It’s a hopeful sign, but the COVID-19 crisis is far from over. It’s going to be a tense fall. Full Analysis
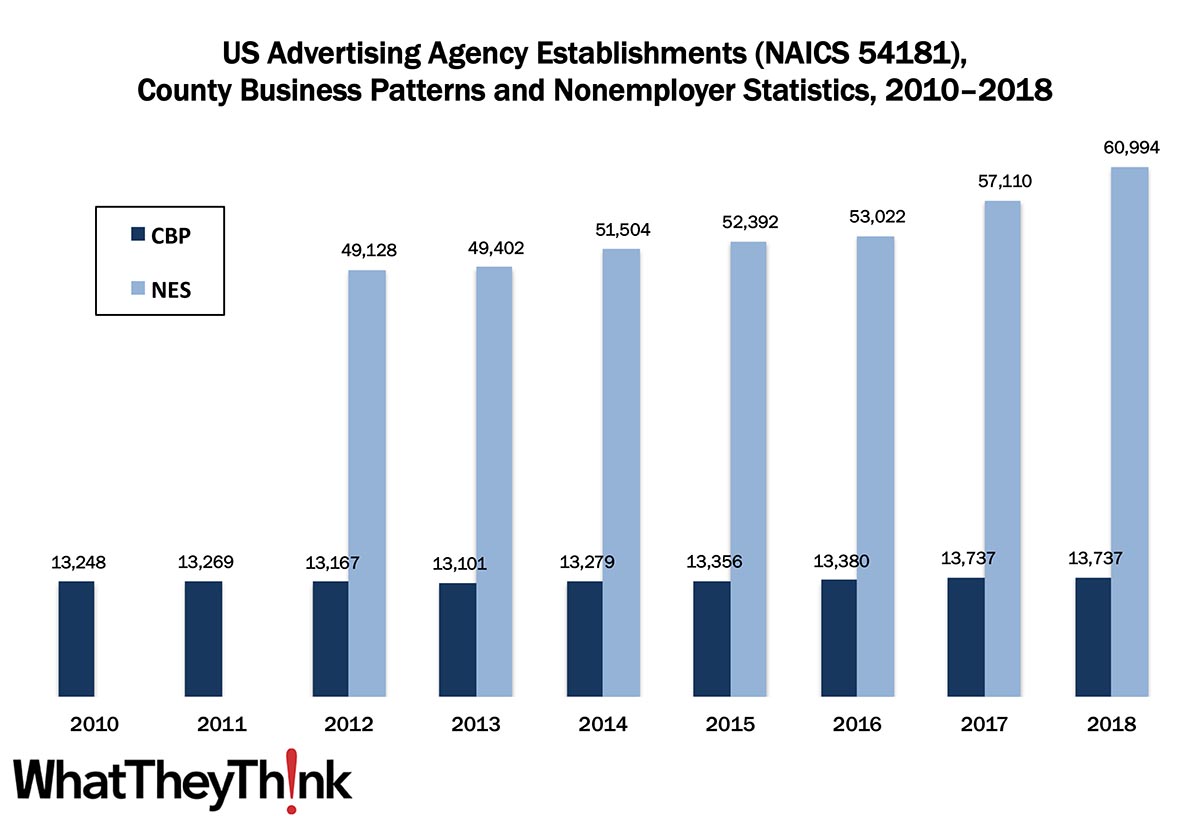
Advertising Agencies—2010–2018
Published: August 14, 2020
In 2010, there were 13,248 establishments in NAICS 54181 (Advertising Agencies). After a slight contraction due to the Great Recession, agencies started to grow again, peaking at 13,737 establishments in 2018. In addition, we estimate there were an additional 60,994 freelance or sole proprietor agency establishments in 2018. In macro news: initial unemployment claims dip below 1 million. Full Analysis
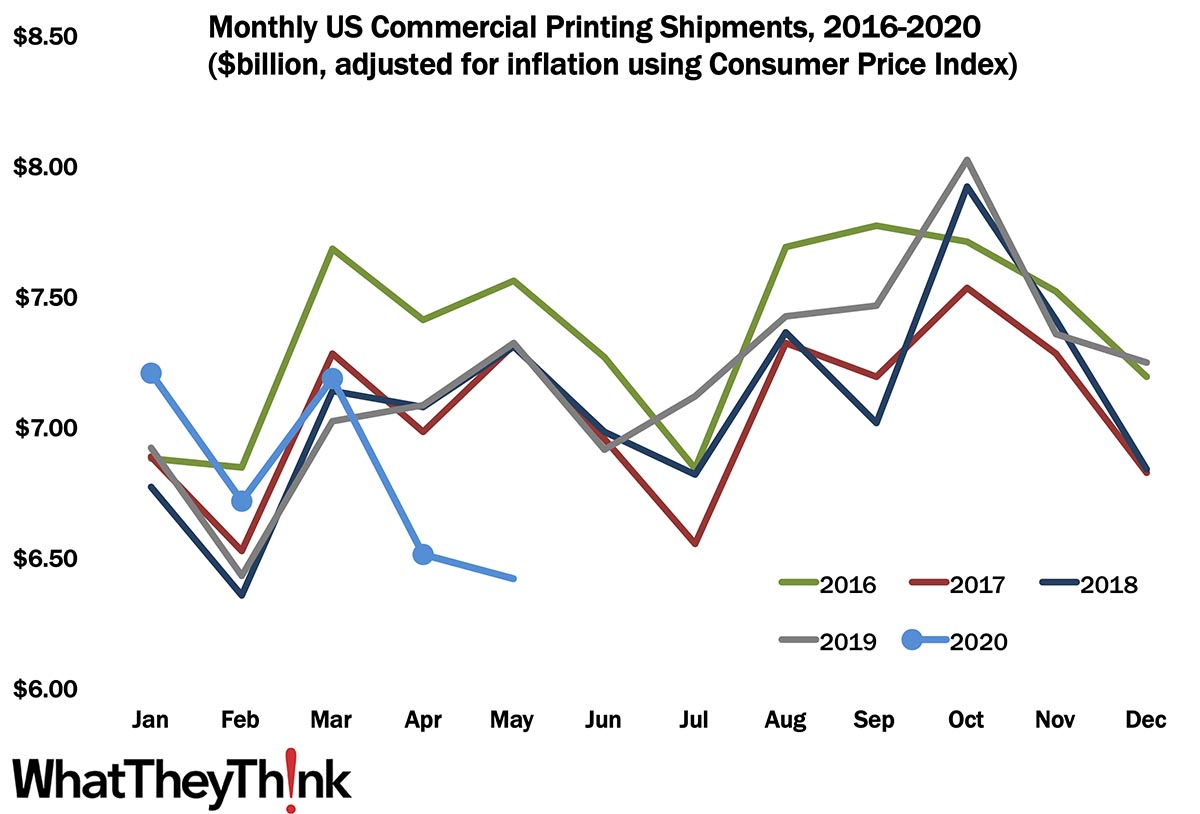
May Printing Shipments—Now It’s Serious
Published: August 7, 2020
Printing shipments for May 2020 came in at $6.42 billion, down from $6.51 in April and way down from $7.21 billion back in January. This may be as dire as shipments get, but we don’t expect to break $7 billion again for a long while. Full Analysis
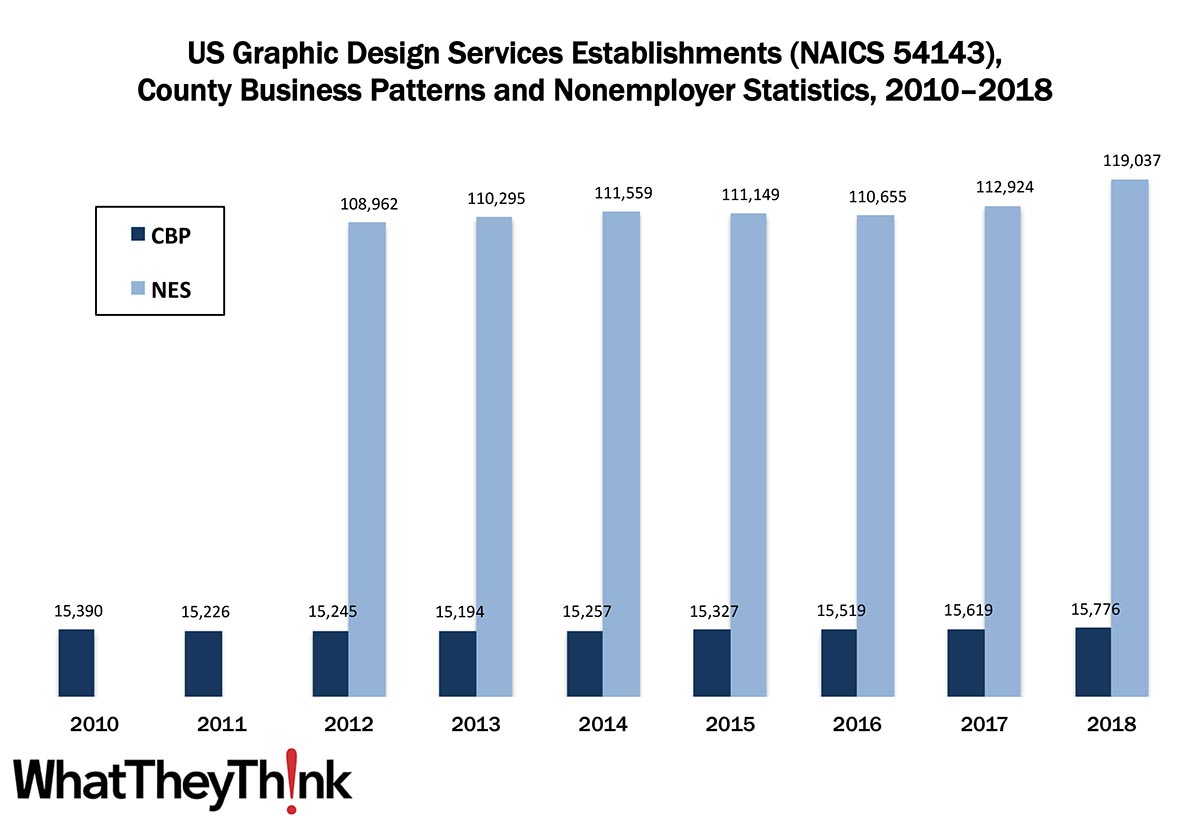
Graphic Design Services—2010–2018
Published: July 31, 2020
In 2010, there were 15,390 establishments in NAICS 54143 (Graphic Design Services). After something of a contraction due to the Great Recession, graphic design establishments started to grow again, peaking at 15,776 establishments in 2018. In addition, we estimate there were an additional 119,037 freelance graphic design establishments in 2018. In macro news: GDP falls off the cliff. Full Analysis
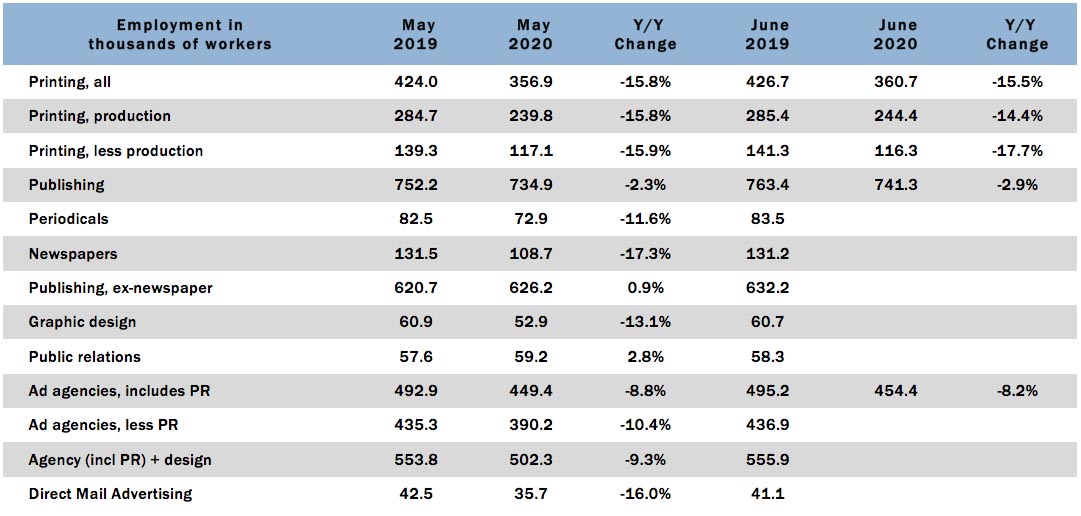
Graphic Arts Employment—June 2020
Published: July 24, 2020
As the song goes, “getting better all the time (can’t get any worse)”: in June 2020, overall printing employment is up +1.1% from May, although down -15.5% from June 2019. So a lot of the April damage is continuing to reverse itself. Full Analysis
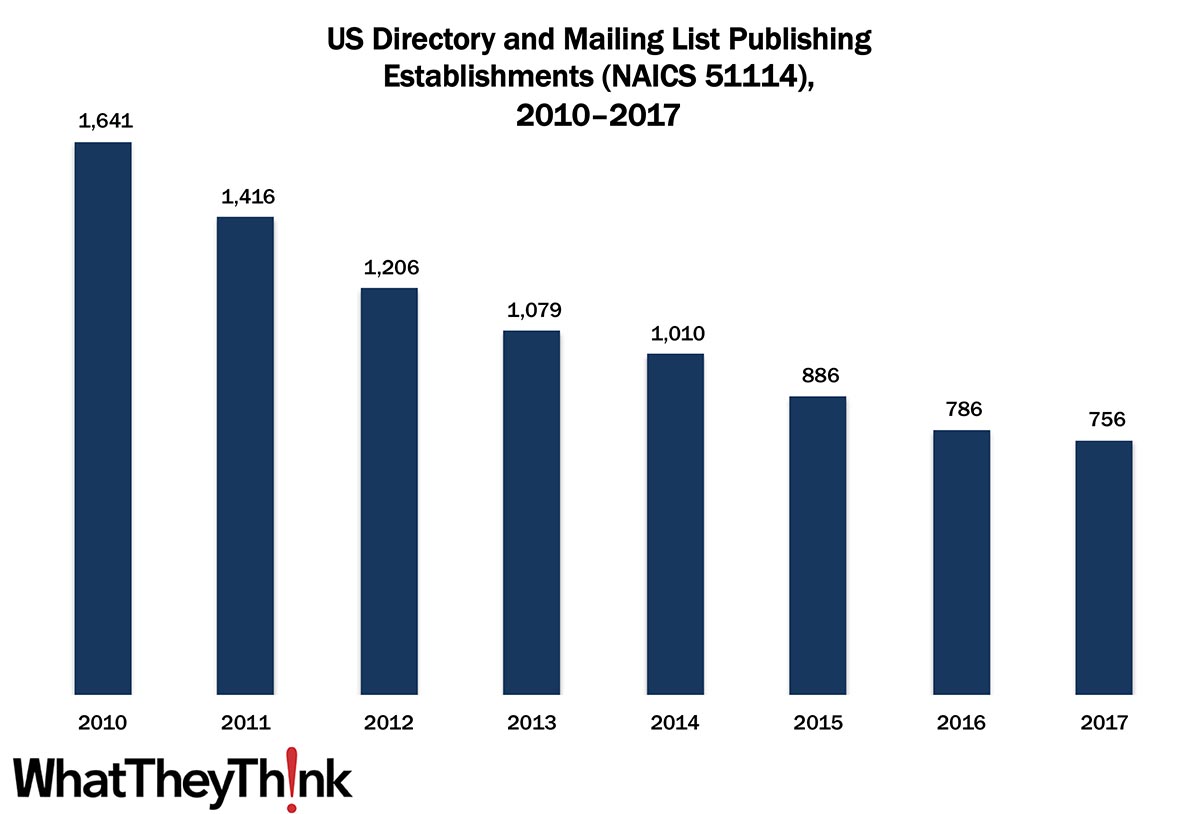
Directory and Mailing List Publishing Establishments—2010–2017
Published: July 17, 2020
In 2010, there were 1,641 US directory and mailing list publishing establishments; by 2017, that number had plummeted to 756. Full Analysis
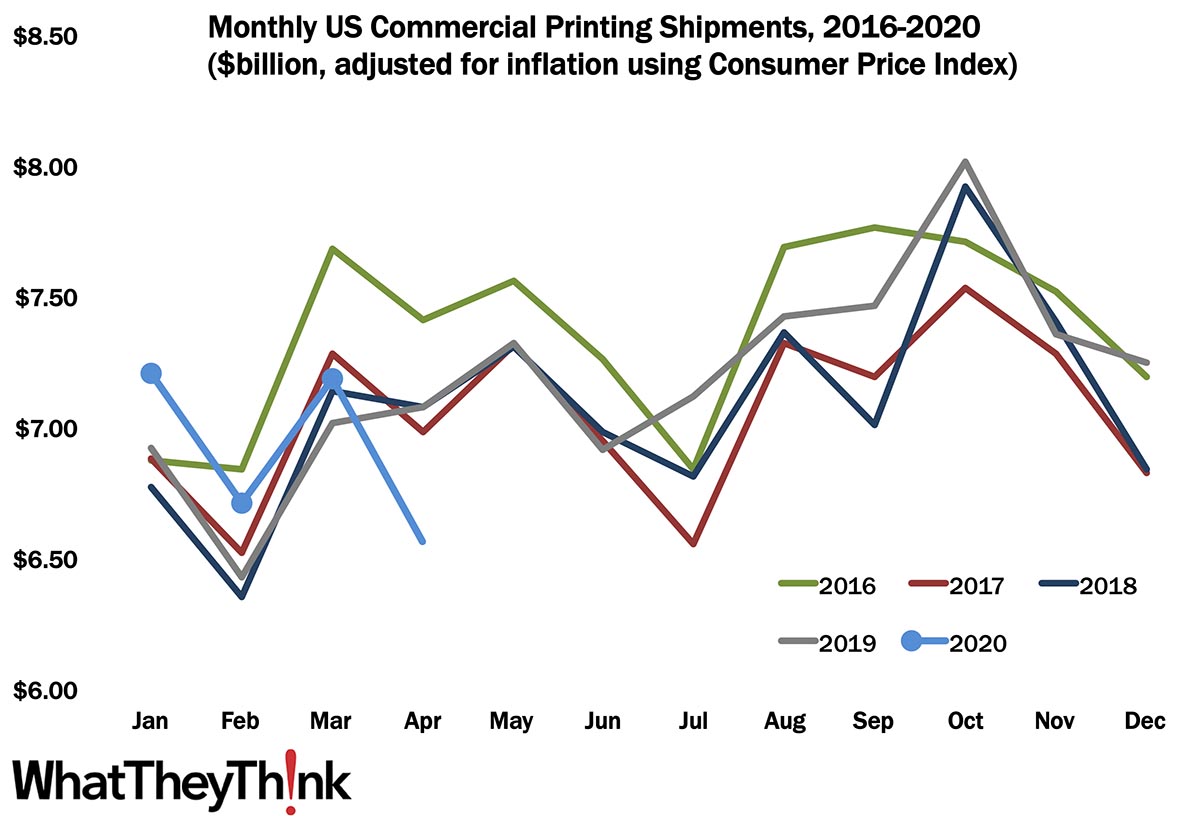
April Printing Shipments—Here We Go
Published: July 10, 2020
As we expected, April 2020 printing shipments took a tumble—falling from $7.18 billion in March down to $6.56 billion. Hmm...what could have caused that? Full Analysis
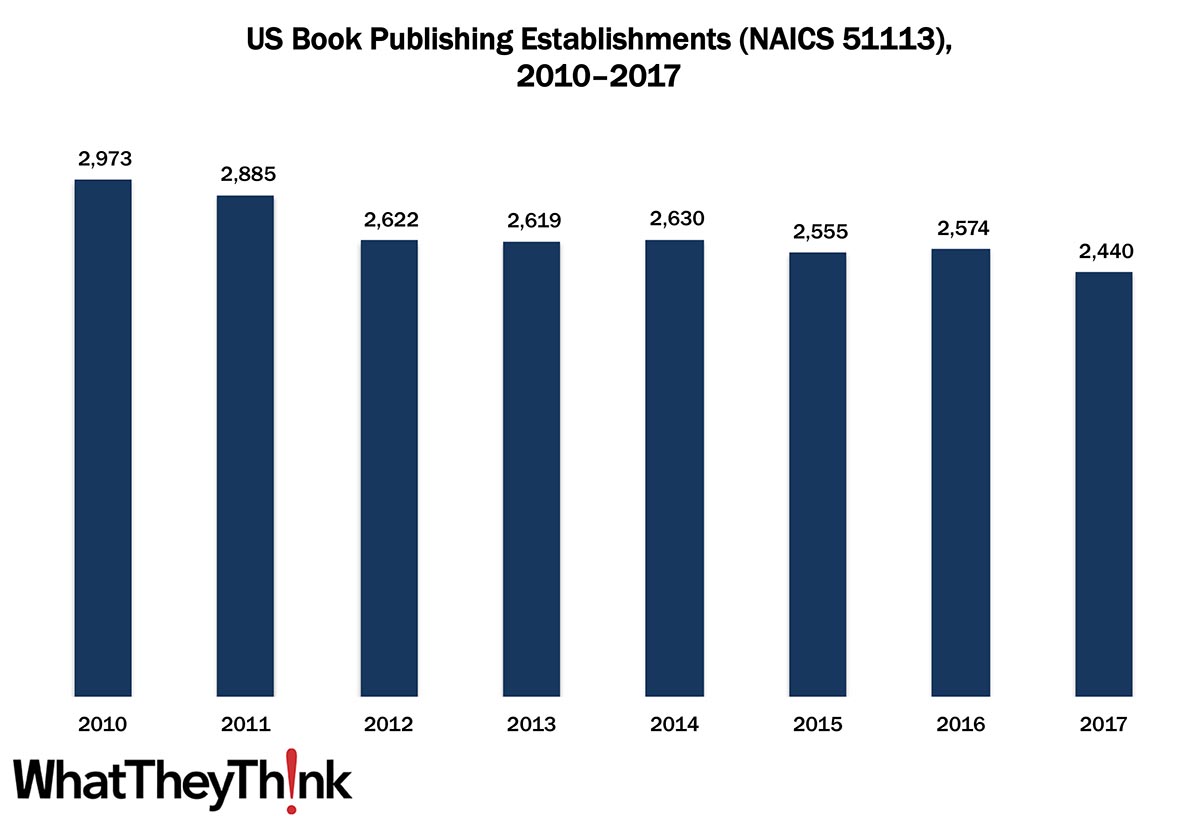
Book Publishing Establishments—2010–2017
Published: June 26, 2020
In 2010, there were 2,973 US book publishing establishments; by 2017, that number had dropped to 2,440. Book publishers are especially well-represented in Non-Employer Statistics. Full Analysis

A Tale of Two Cities: The Pandemic Years
Published: June 19, 2020
Annualized profits for Q1 2020 took a nosedive from $990 million to -$4 billion. Sure, the pandemic hit in the last three weeks of the quarter, but this is an old story that predates COVID. Full Analysis
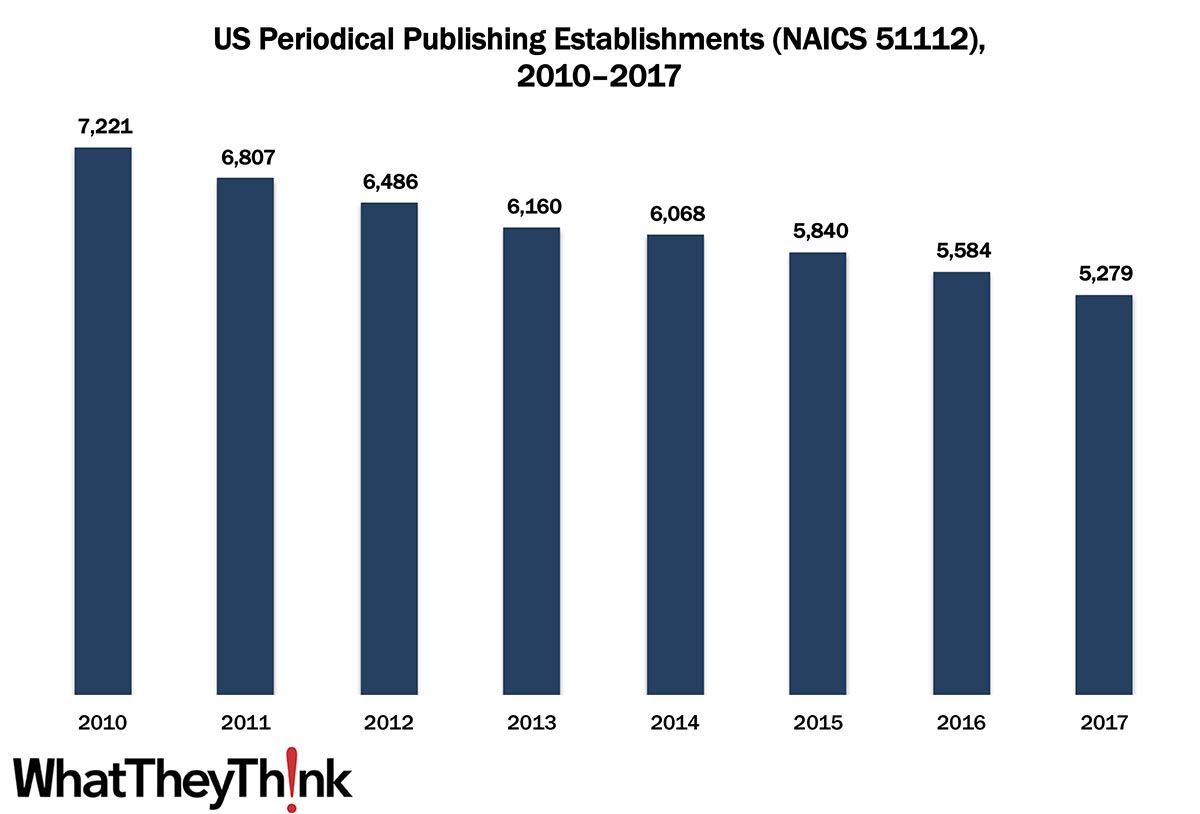
Periodical Publishing Establishments—2010–2017
Published: June 12, 2020
In 2010, there were 7,221 US periodical publishing establishments; by 2017, that number had dropped to 5,279. Magazines have been struggling in the Internet age, with closures and consolidations, but also have been seeing a shift in what constitutes “periodical publishing.” Also: we’re officially in a recession (surprise). Full Analysis
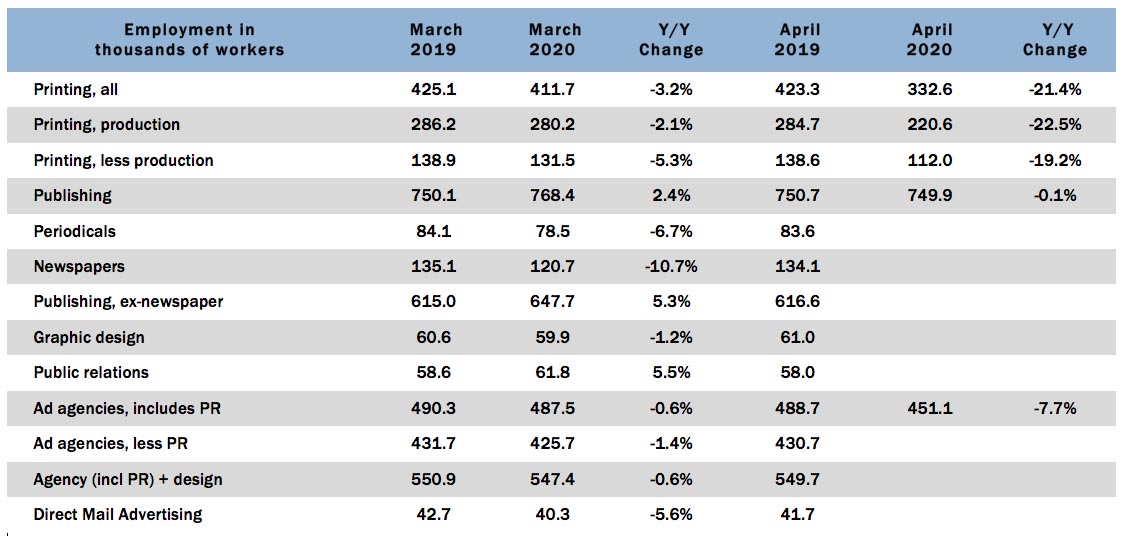
Graphic Arts Employment—April 2020
Published: June 5, 2020
Here we go: in April 2020, the overall printing employment was down -19.2% from March and down -21.4% from April 2019. We’ve been expecting this. Full Analysis
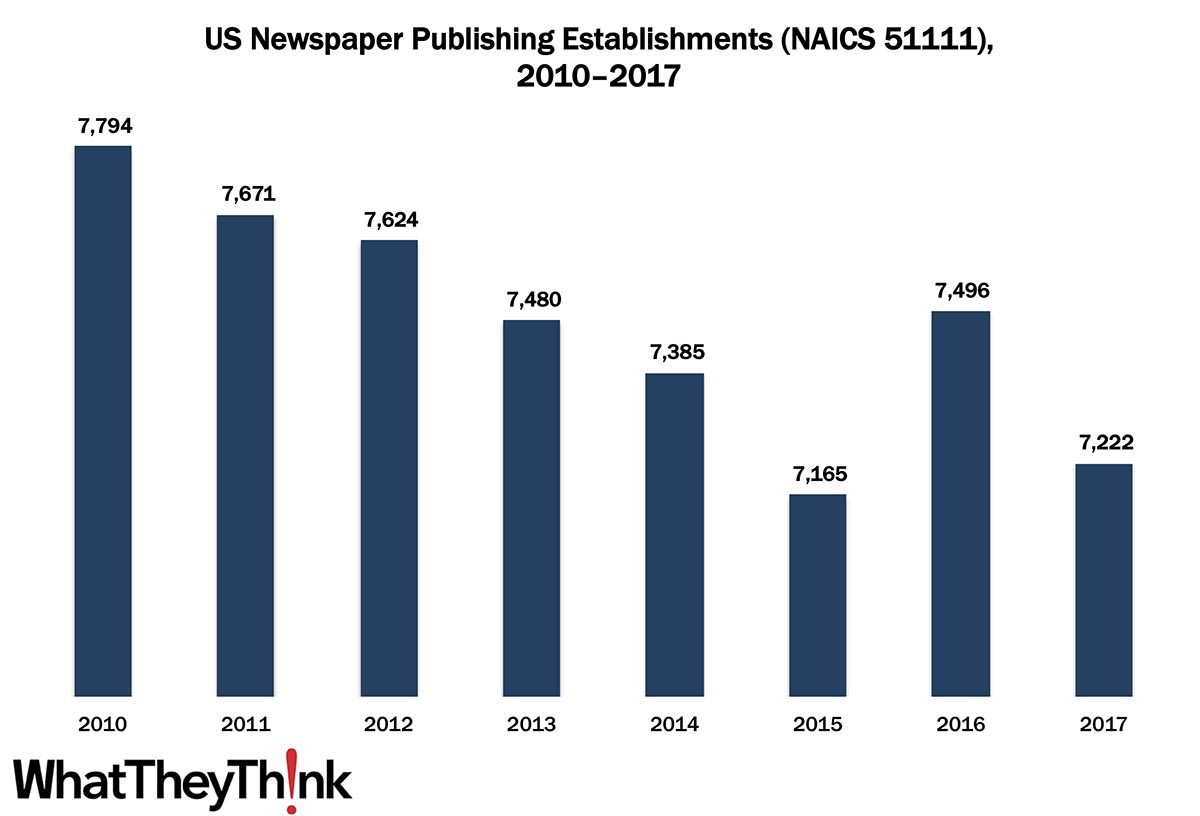
Newspaper Publishing Establishments—2010–2017
Published: May 29, 2020
In 2010, there were 7,794 US newspaper publishing establishments; by 2017, that number had dropped to 7,222. The newspaper industry’s woes have been well-documented, but the trouble started well before the Internet era. Also: Q1 GDP revised down. Full Analysis
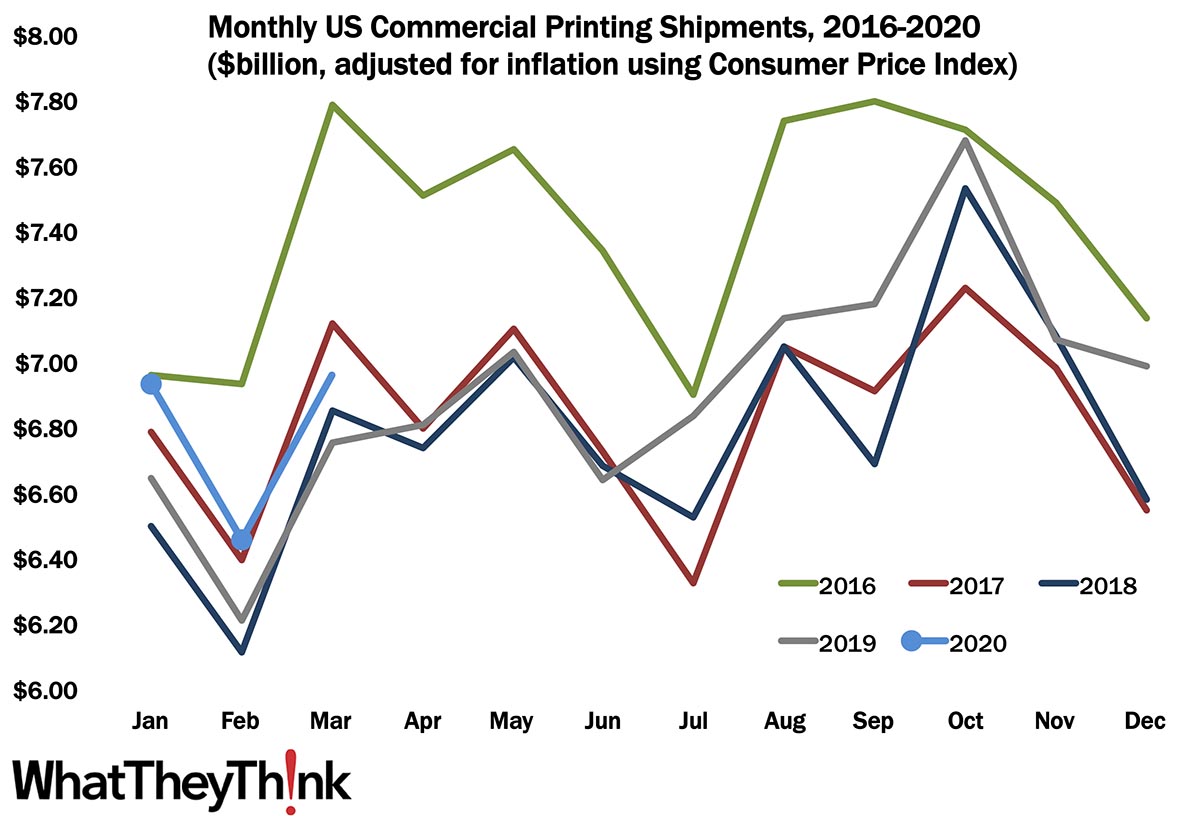
March Shipments—Crest of a Wave
Published: May 22, 2020
As we kind of expected, at $6.96 billion, March shipments were up from February’s $6.48 billion, and well enough above March 2019’s $6.75 billion. Full Analysis
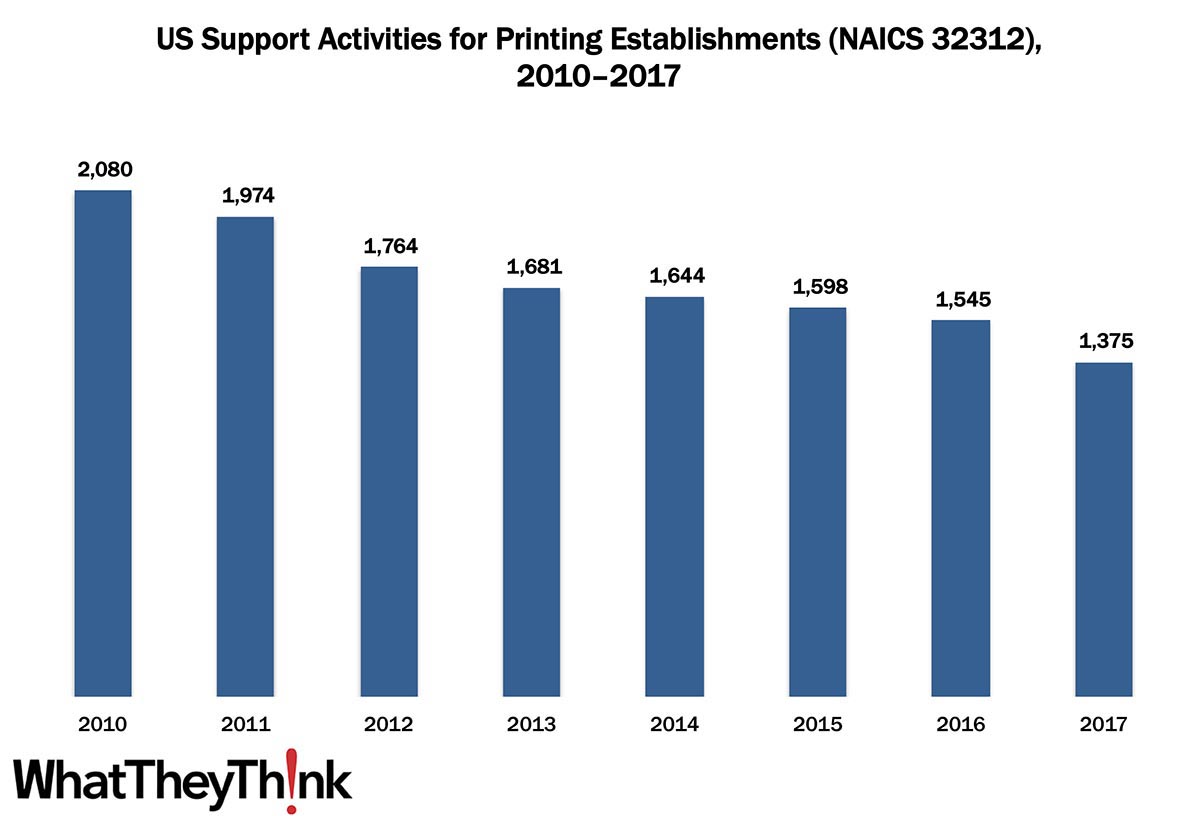
Prepress and Postpress Services Establishments—2010–2017
Published: May 15, 2020
In 2010, there were 2,080 establishments offering prepress and/or postpress services; by 2017, that number had dropped to 1,375. It’s not difficult to understand why the number of these establishments has been dropping: prepress is being absorbed into the printing process itself (especially in digital printing), and more print businesses are acquiring their own finishing capabilities. Full Analysis
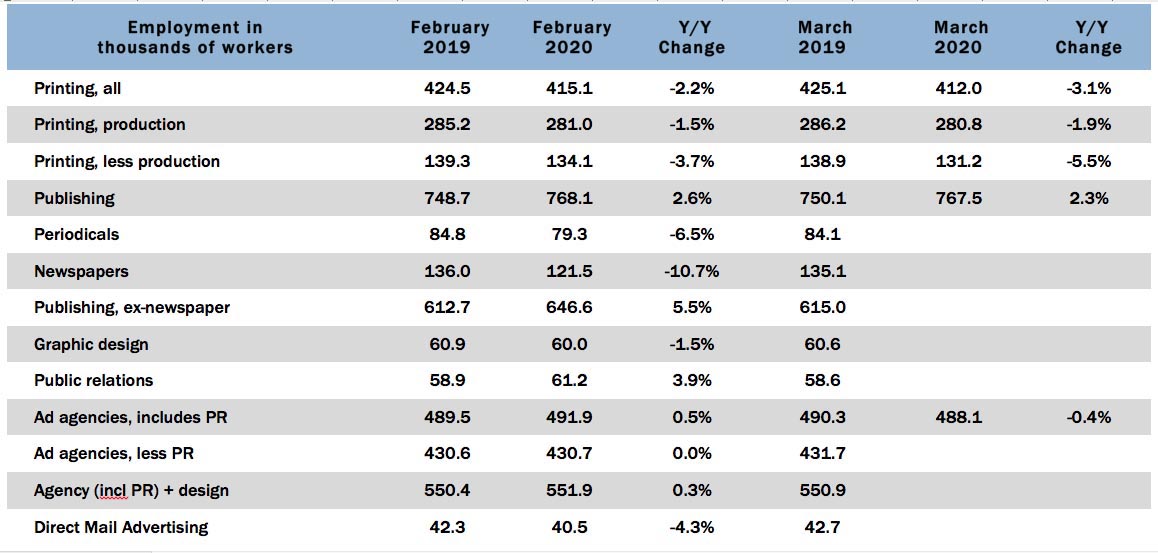
Graphic Arts Employment—March 2020
Published: May 8, 2020
Another of the Scenes from the Before Times: in March 2020, the overall printing employment was virtually unchanged from February (-0.7%) and on a year-over-year basis is down -3.1%. Obviously, this is the calm before the storm. Full Analysis
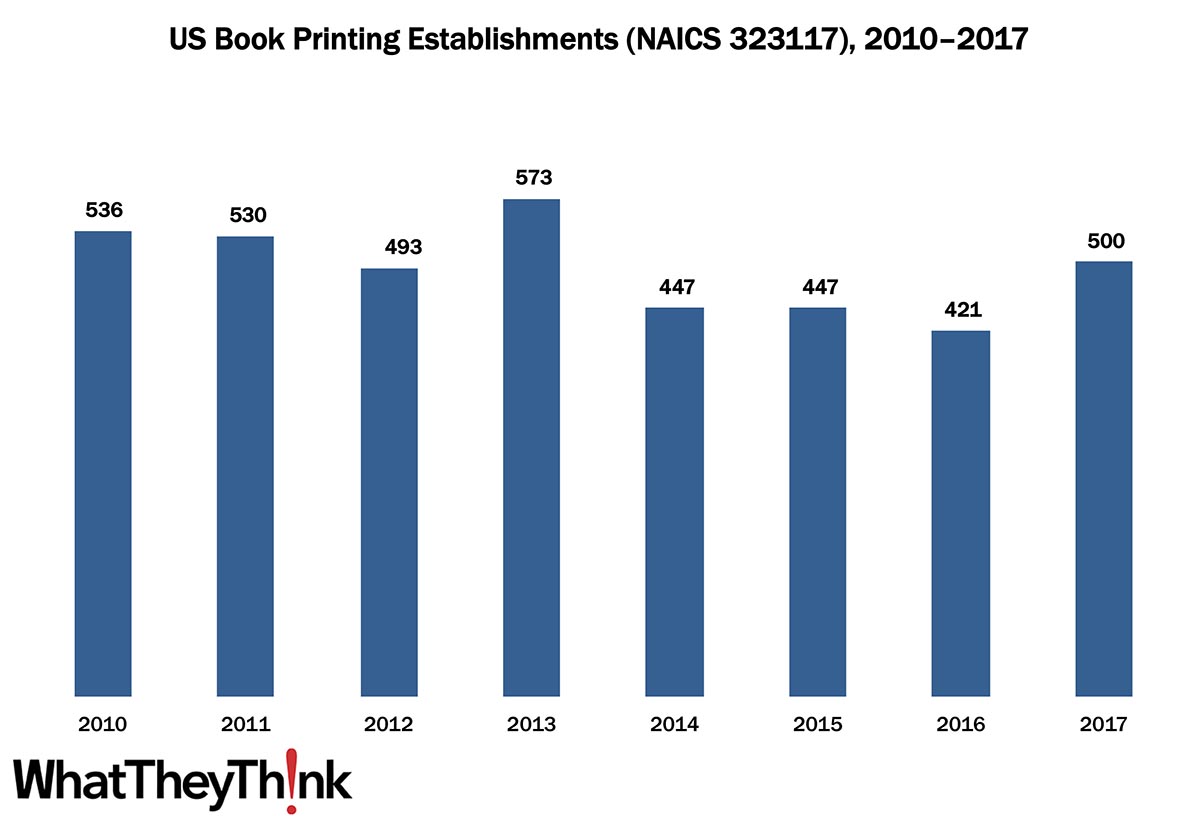
Book Printing Establishments—2010–2017
Published: May 1, 2020
According to the latest edition of County Business Patterns, in 2017 there were 500 establishments in NAICS 323117 (Book Printing Establishments). This represents an decline of -6.7% since the decade began. In other data news, the BEA released Q1 2020 GDP growth. Click on through, if you dare. Full Analysis
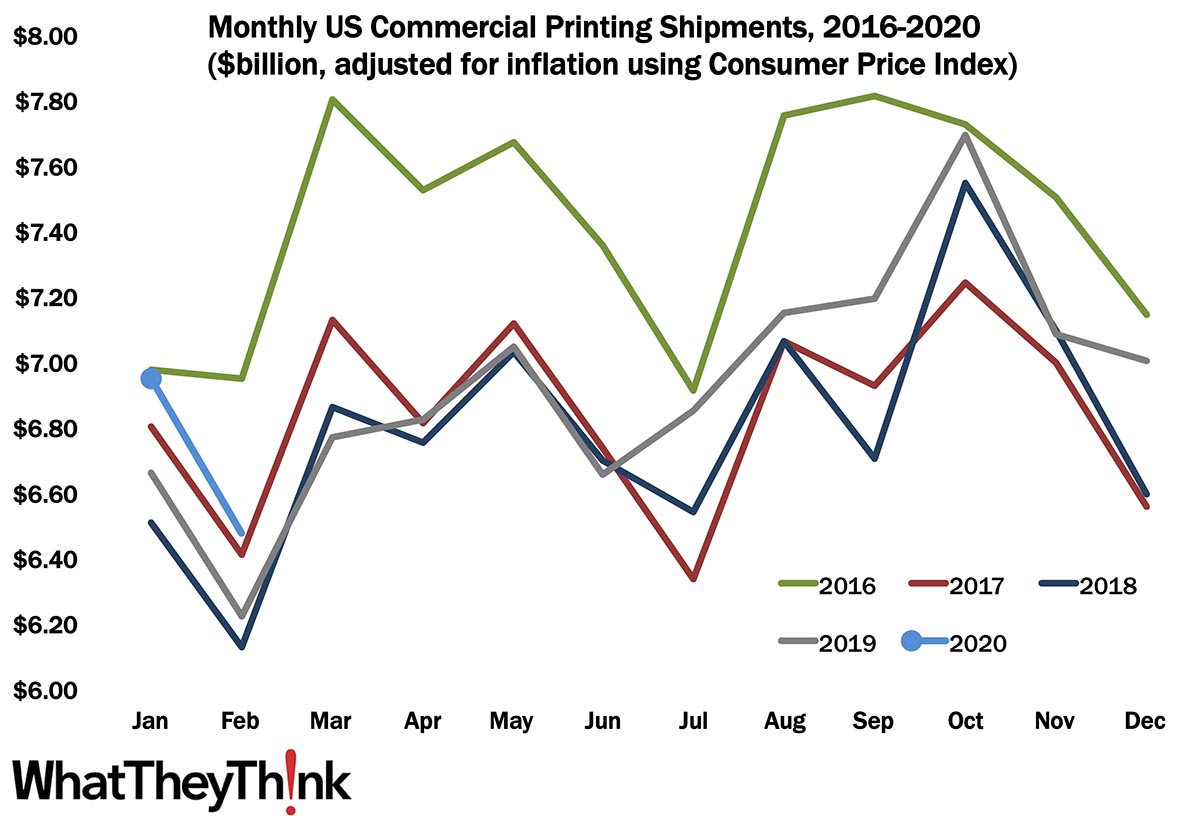
February Shipments: Tales from The Before Times
Published: April 24, 2020
At $6.48 billion, February shipments were down from January’s $6.94 billion, but well above February 2019’s $6.22 billion—and indeed was the best February we’ve had since 2016. Ah, well... Full Analysis
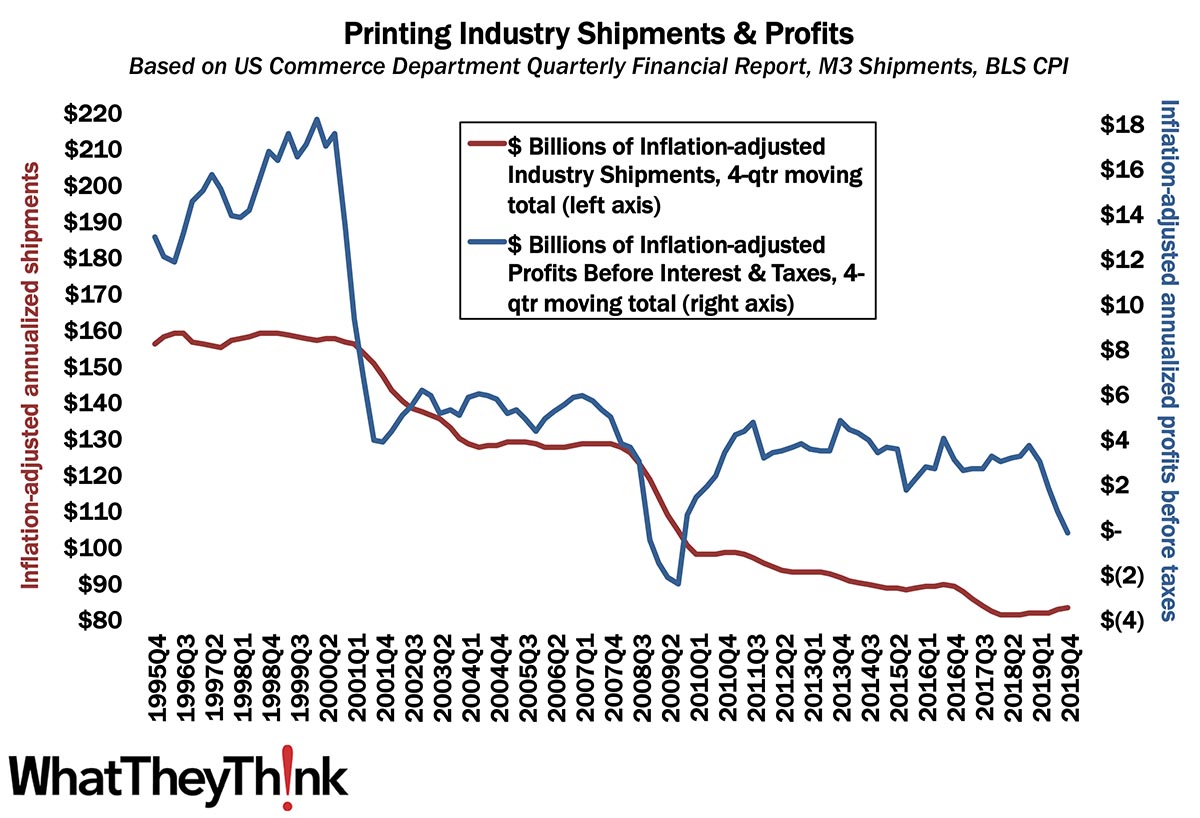
Printing Profits Plunged—Even Before the Crisis
Published: April 10, 2020
Annualized profits for Q4 2019 took a nosedive from $720 million to -$170 million in the latest chapter in our “tale of two cities” narrative, this time with the profitability gap between large and small printers narrowing. Full Analysis
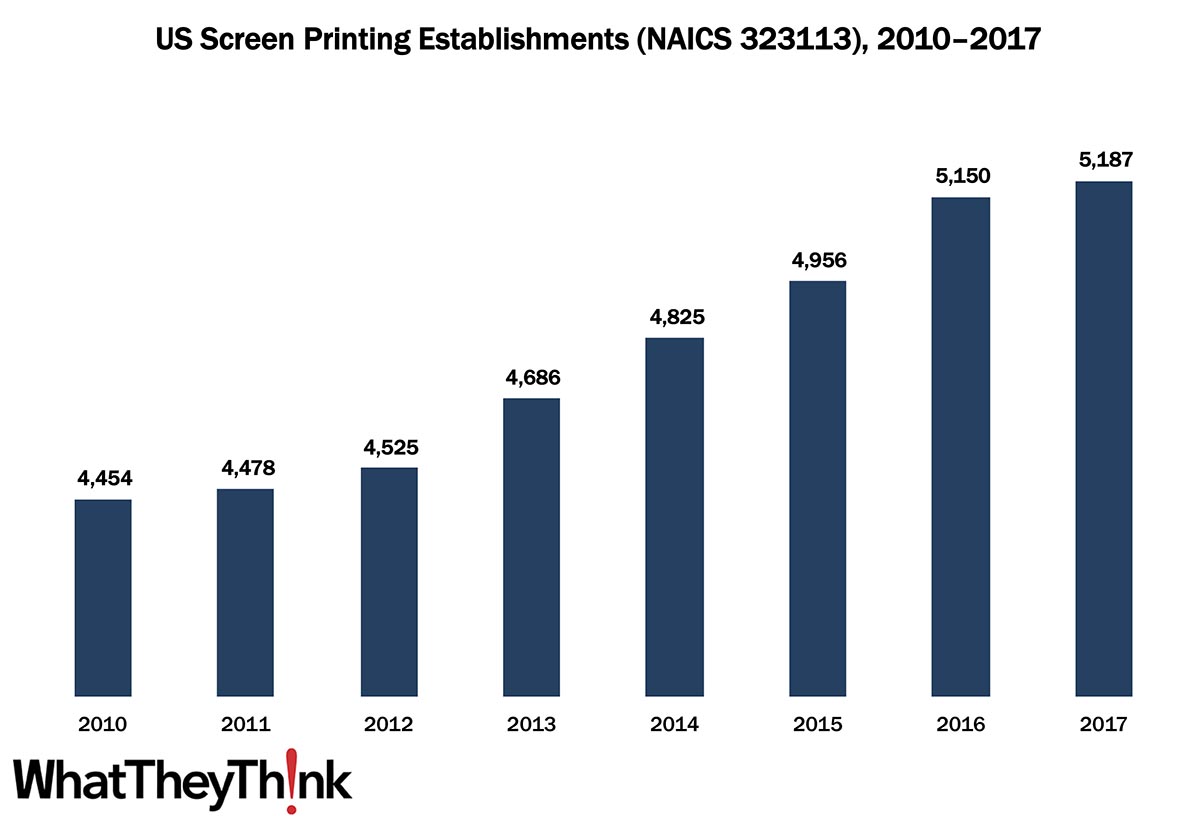
Screen Printing Establishments—2010–2017
Published: April 3, 2020
According to the latest edition of County Business Patterns, in 2017 there were 5,187 establishments in NAICS 323113 (Commercial Screen Printing). This represents an increase of +16% since the decade began. Full Analysis
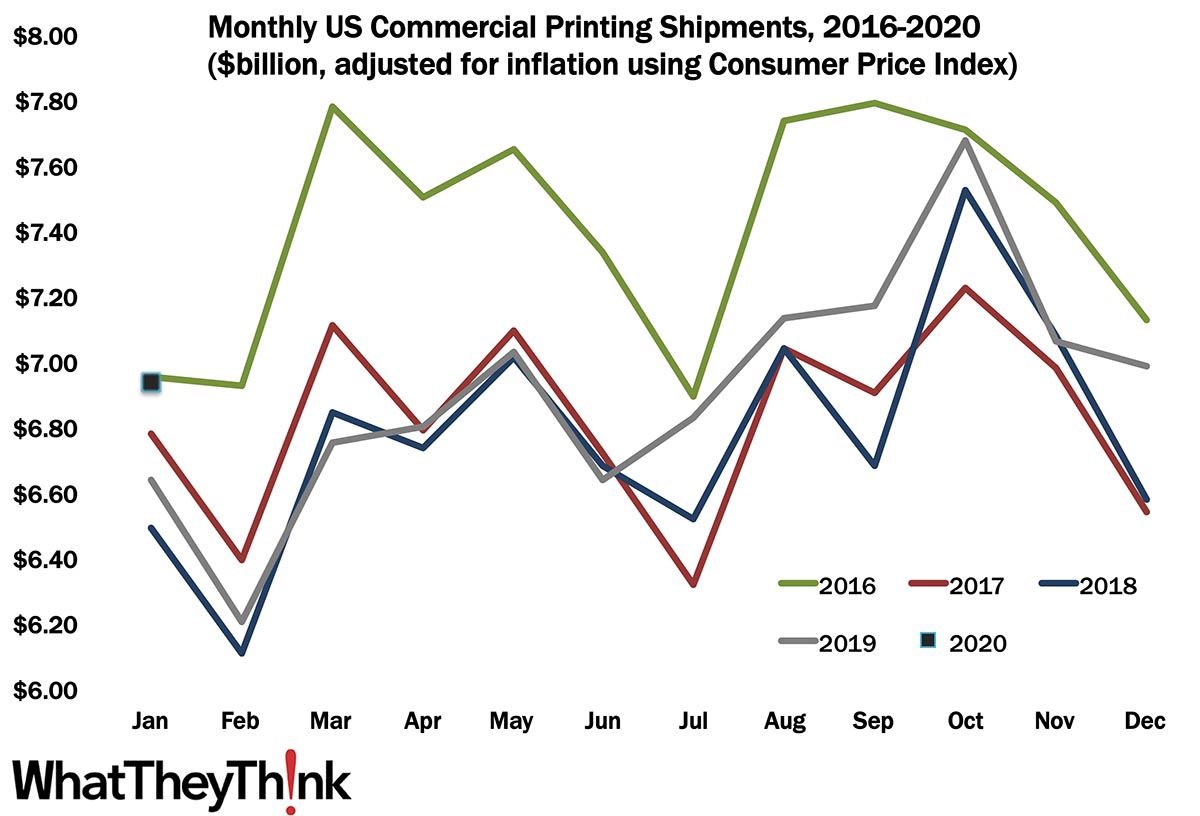
January Shipments: Well, We Started Great
Published: March 27, 2020
At $6.94 billion, January shipments were down a little from December’s $6.98 billion, but that was just slightly lower than January 2016’s $6.95 billion—the best January we have had since then. But, elephant in the room... Full Analysis
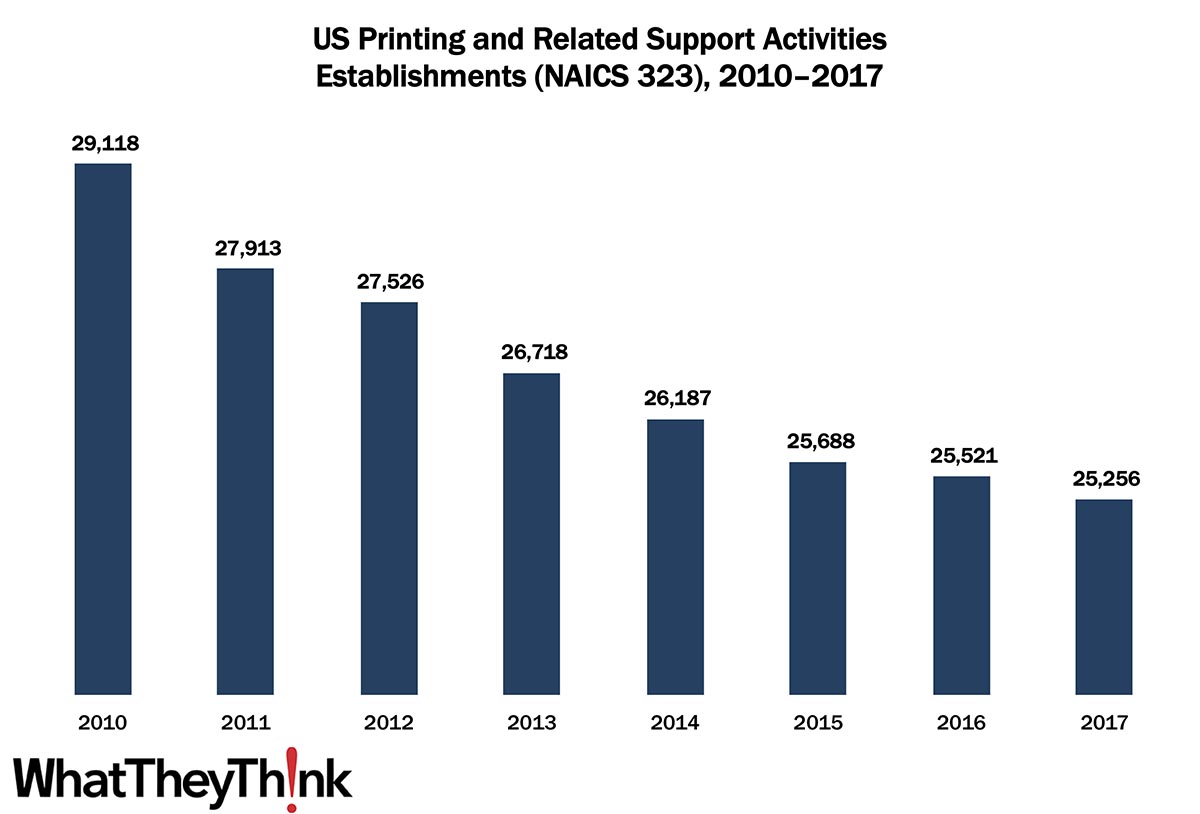
Printing Establishments—2010–2017
Published: March 20, 2020
According to the latest edition of County Business Patterns, in 2017 there were 25,256 establishments in NAICS 323 (Printing and Related Support Activities). This represents a decline of 13% since the decade began. Full Analysis
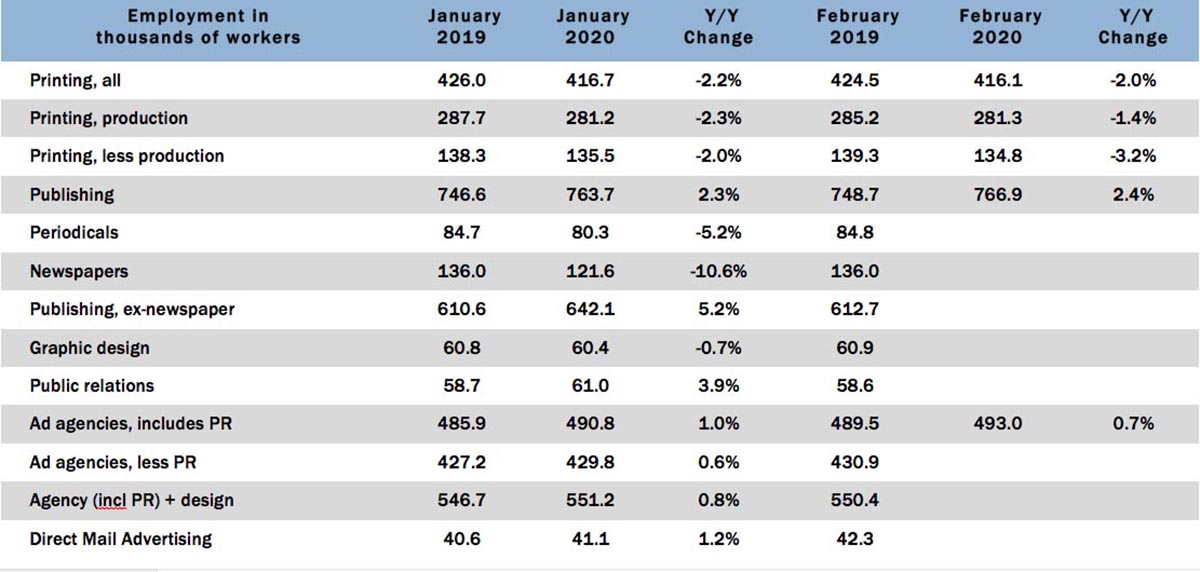
Graphic Arts Employment—February 2020
Published: March 13, 2020
In February 2020, overall printing employment was virtually unchanged from January (-0.1%) and on a year-over-year basis was down -2.0%. Interestingly, production employment was up, albeit infinitesimally. Full Analysis
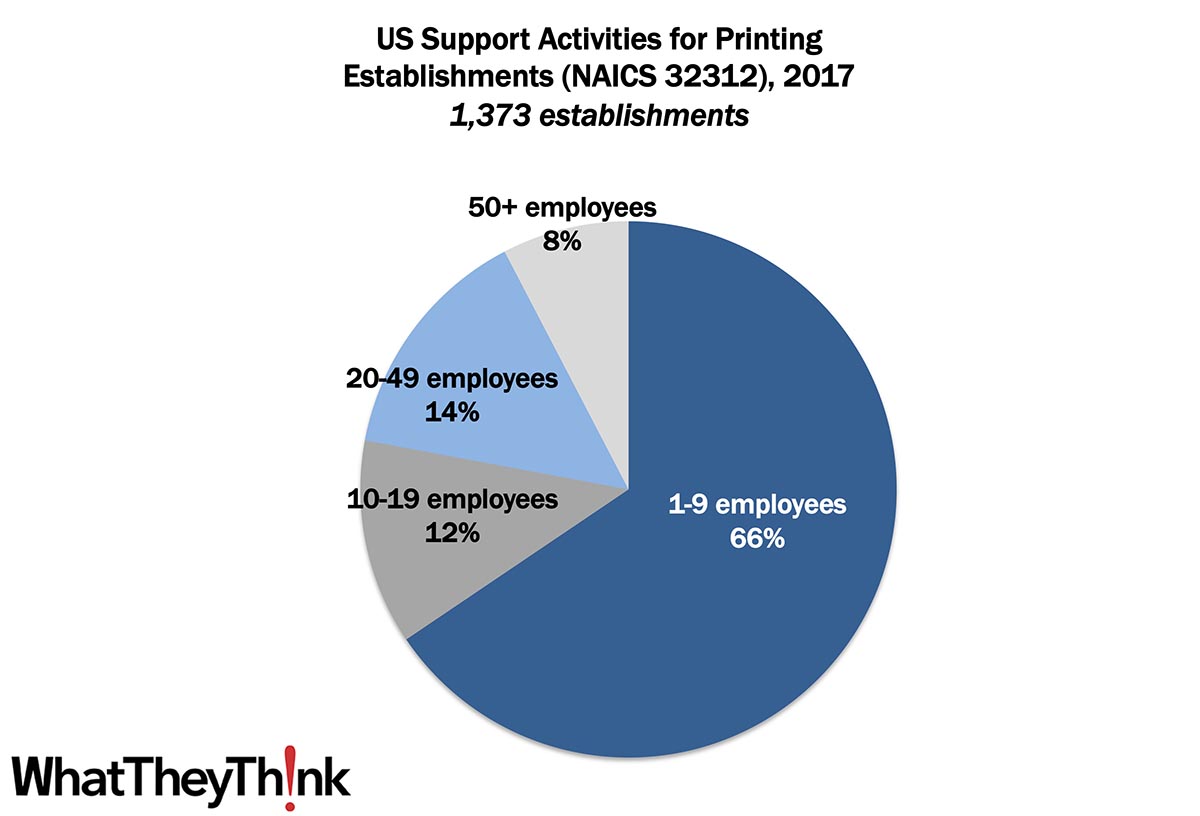
Prepress and Postpress Establishments—2017
Published: March 6, 2020
According to the latest edition of County Business Patterns, in 2017 there were 1,373 establishments in NAICS 32312 (Support Activities for Printing). The majority of these establishments (66%) had fewer than 10 employees. Full Analysis
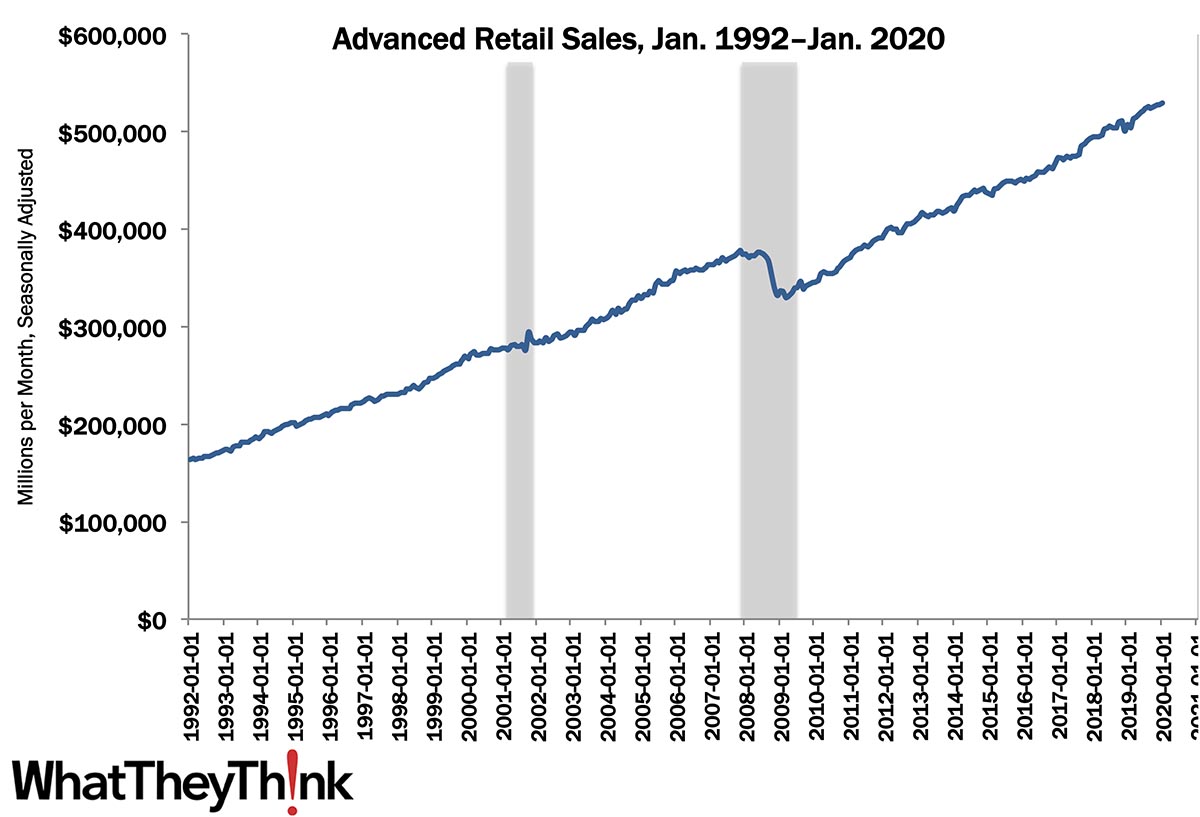
Retail Sales—January 2020
Published: February 28, 2020
Advance estimates of U.S. retail and food services sales for January 2020, adjusted for seasonal variation and holiday and trading-day differences, but not for price changes, were $529.8 billion, an increase of +0.3% (±0.4%) from the previous month, and +4.4% (±0.7%) above January 2019. Retail drives a lot of printing and packaging volume, so it’s important to keep an eye on that sector. Full Analysis
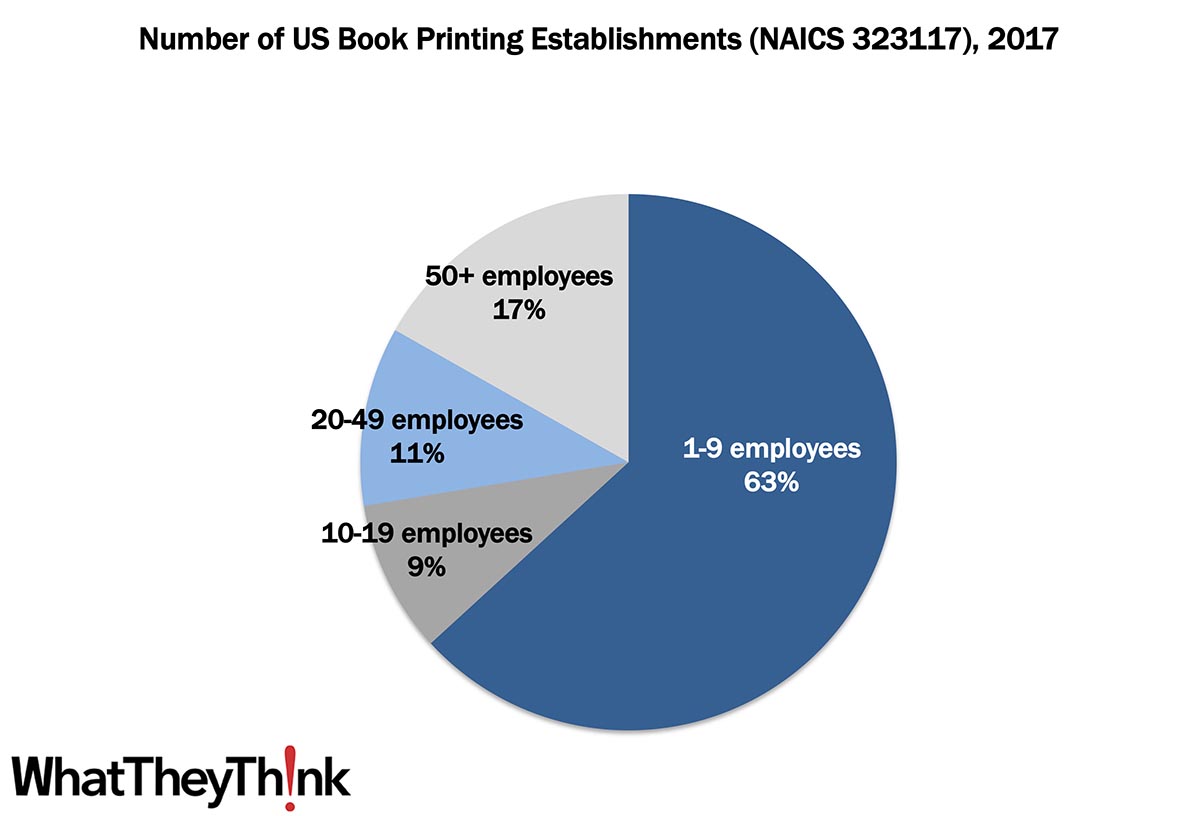
Book Printers—2017
Published: February 21, 2020
The latest edition of County Business Patterns is out, which updates number of establishments and other data to 2017. In that year, there were 500 establishments in NAICS 323117 (Book Printing). The majority of these establishments (63%) had fewer than 10 employees. Full Analysis
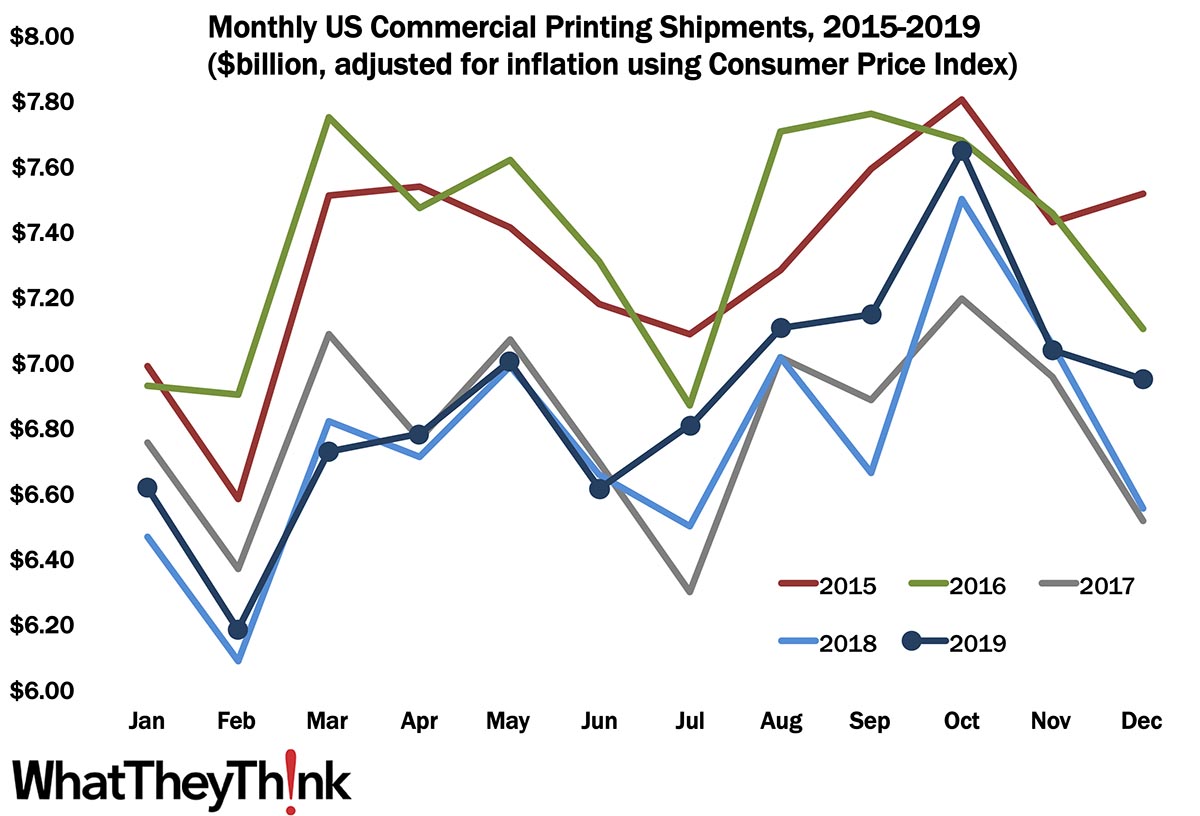
December Shipments: Ending 2019 on a High Note
Published: February 14, 2020
The value of printing shipments for December 2019 was down from November—as we expected it would be—but not down as much as been the case in recent years. At $6.95 billion, December shipments were down from November’s $7.03 billion, but far above the depths of 2017 and 2018. Full Analysis
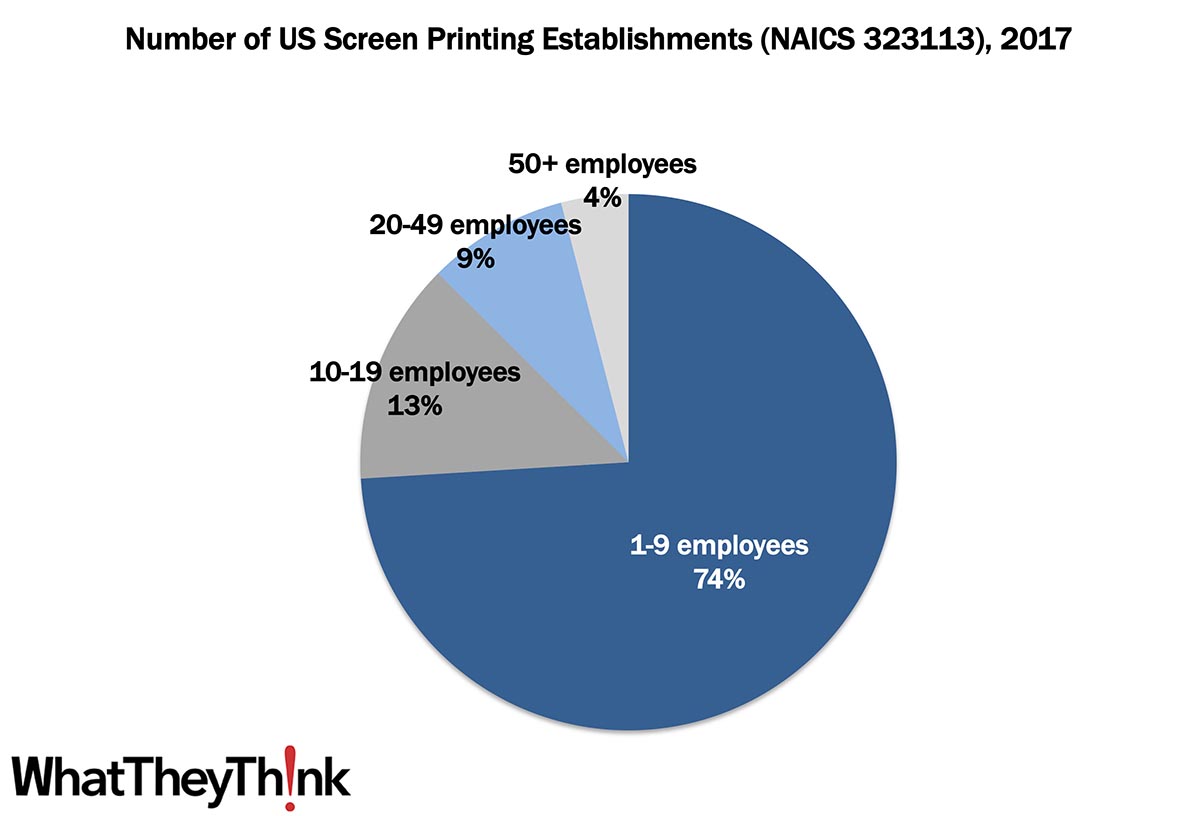
Screen Printing Establishments—2017
Published: February 7, 2020
The latest edition of County Business Patterns is out, which updates number of establishments and other data to 2017. In that year, there were 5,186 establishments in NAICS 323113 (Commercial Screen Printing). The majority of these establishments (74%) had fewer than 10 employees. Full Analysis
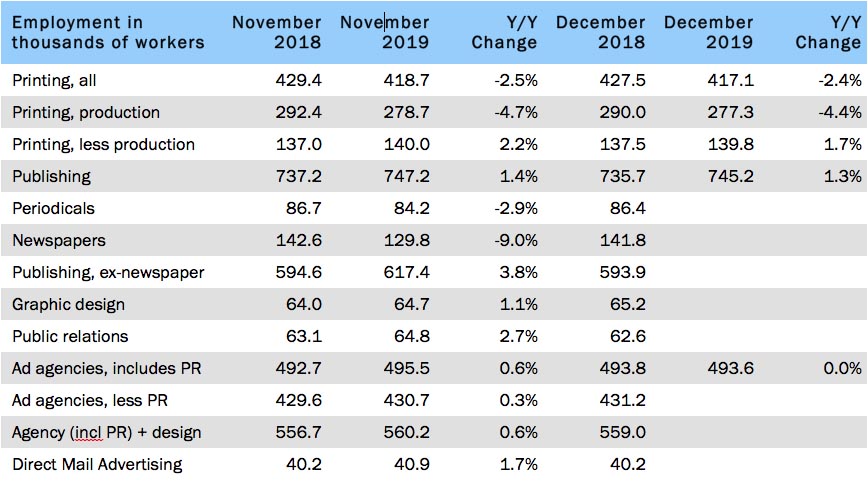
Graphic Arts Employment—December 2019
Published: January 31, 2020
In December 2019, overall printing employment dropped -0.2% from November, and on a year-over-year basis, it is down -2.4%. Production employment was down -0.5% from November to December (and -4.4% Y/Y) while non-production employment was down -0.1% from November to December—but actually up +1.7% Y/Y. Full Analysis
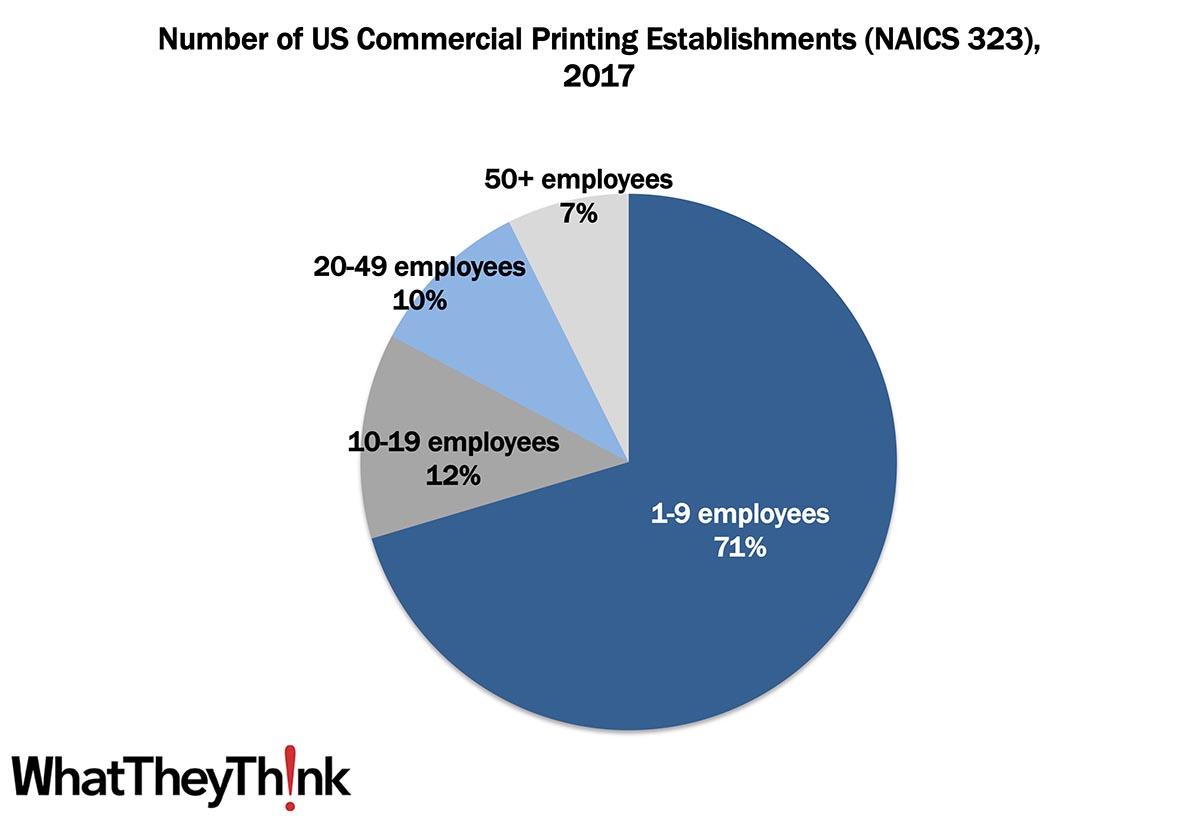
Commercial Printing Establishments—2017
Published: January 24, 2020
The latest edition of County Business Patterns is out, which updates the number of establishments and other data. In 2017, there were 25,256 establishments in NAICS 323 (Printing and Related Support Activities). The majority of these establishments (71%) have fewer than 10 employees. Full Analysis
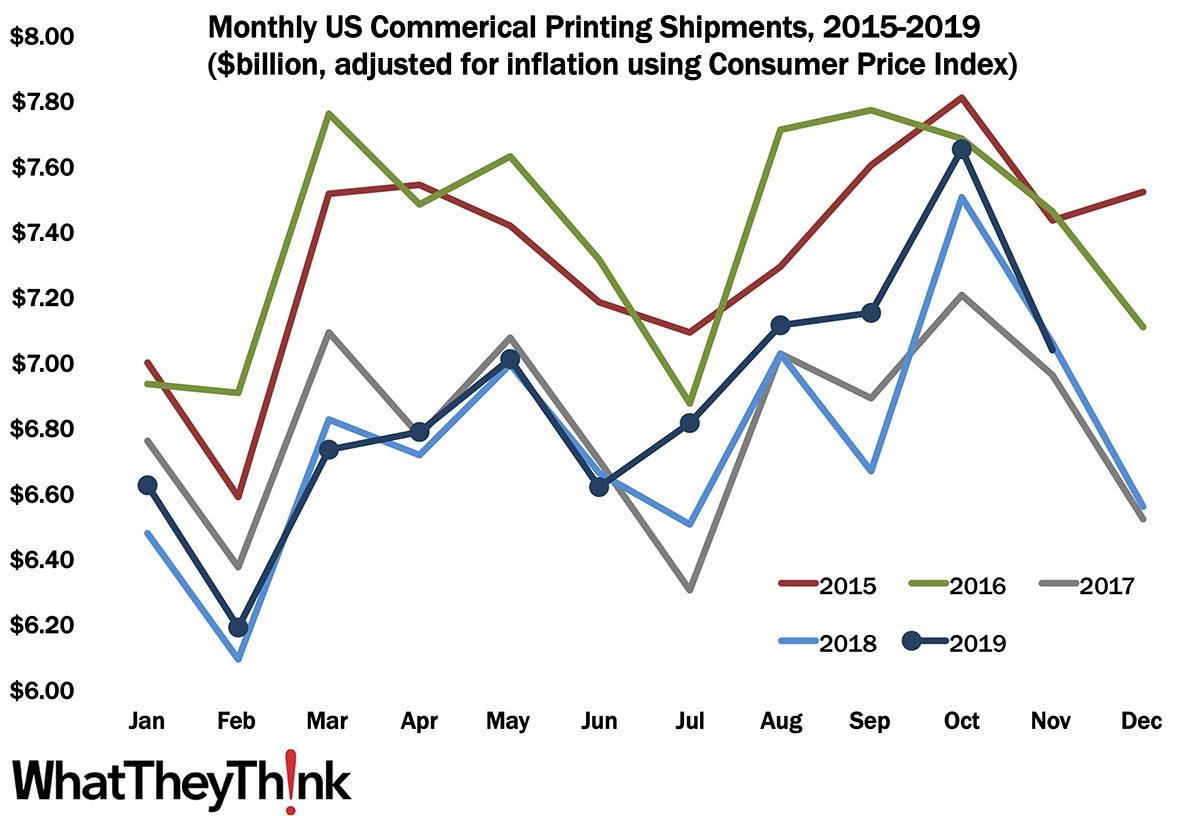
November Printing Shipments: Off for the Holidays
Published: January 17, 2020
The value of printing shipments for November 2019 was $7.03 billion—a pretty big drop from October’s $7.65 billion, but we kind of expected it, as November and December see business slow down for the holidays. Full Analysis
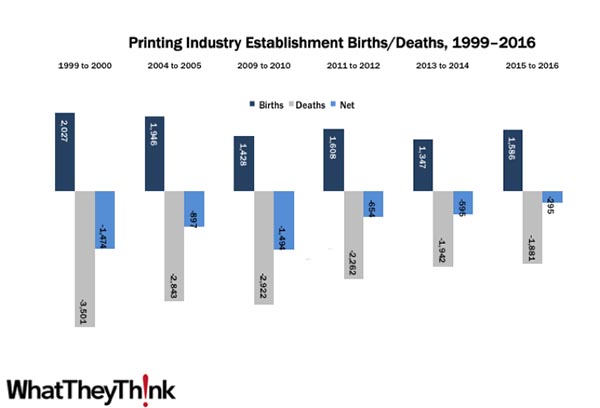
Establishment Births/Deaths: Industry Attrition Continues to Slow
Published: January 10, 2020
From 2015 to 2016, there had been an increase of 1,586 establishments, but a decrease of -1,881 establishments, for a net loss of -295 establishments. That’s a smaller percentage change than previous years, which reflects somewhat of a deceleration in industry consolidation. Full Analysis
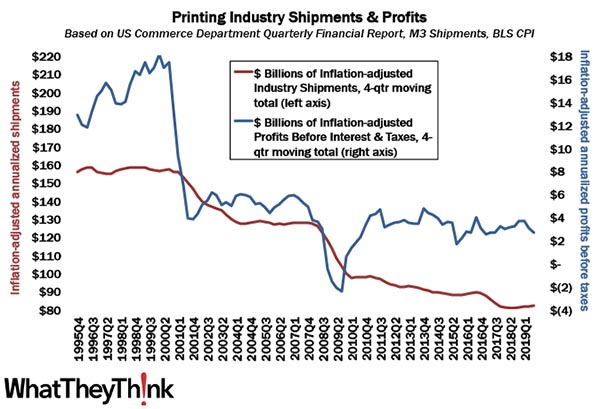
The Next Chapter in the Printing Profits “Tale of Two Cities”
Published: December 20, 2019
Industry profits data for the third quarter of 2019 were down from $3.05 billion in Q2 to $2.65 billion. Large printers continue to be the trouble spot. Full Analysis
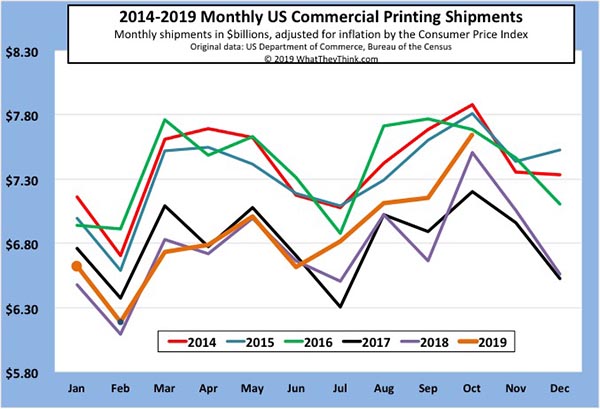
October Printing Shipments: Raise a Glass of Holiday Cheer
Published: December 13, 2019
The value of printing shipments for October 2019 was $7.65 billion—a pretty big jump from September’s $7.14 billion. October has become the biggest month of the year, and this is the best October the industry has had since 2016. Full Analysis
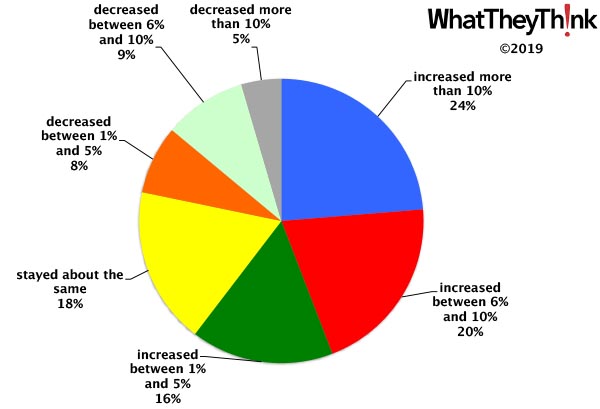
First Look: Industry Business Conditions 2019
Published: December 6, 2019
Preliminary results from our 2019 Business Outlook Survey show that one-fourth (24%) of survey respondents reported that, compared to 2018, revenues for 2019 were up more than 10%. That’s the highest this has been since we started our annual survey in 2015. Elsewhere, though, things are a bit more muted. Full Analysis
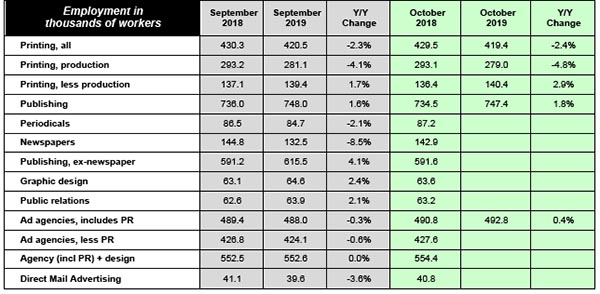
October Jobs: Production Down, Managerial Up
Published: November 22, 2019
In October, overall printing employment dropped -0.3% from September. On a year-over-year basis, though, it was down -2.4%. Production employment was down -0.7% from September to October, but year-over-year was down -4.8%. On the other hand, non-production employment was up +0.7% from September to October, and year-over-year was up +2.9%. Full Analysis
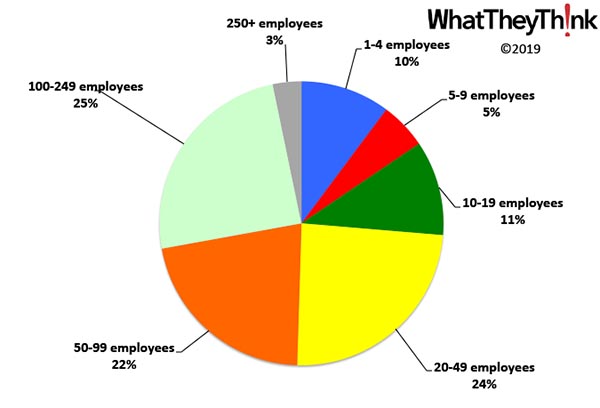
Paperboard Container Manufacturing Establishments—2016
Published: November 15, 2019
In 2016, there were 1,971 establishments in NAICS 32221 (Paperboard Container Manufacturing). One-half of these establishments have 50 or more employees, and three-fourths have 20 or more employees. Full Analysis
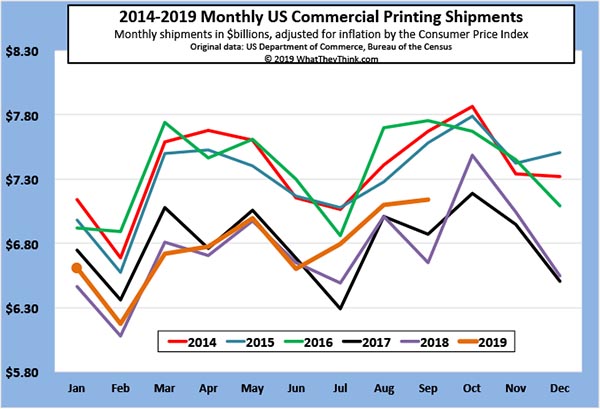
No Fall for Printing Shipments
Published: November 8, 2019
Heading into Fall 2019, the value of printing shipments for September 2019 was $7.14 billion—up from August’s $7.10 billion. It’s not a huge rise, but given that for the last few years September shipments declined from August’s, we’ll take it. Full Analysis
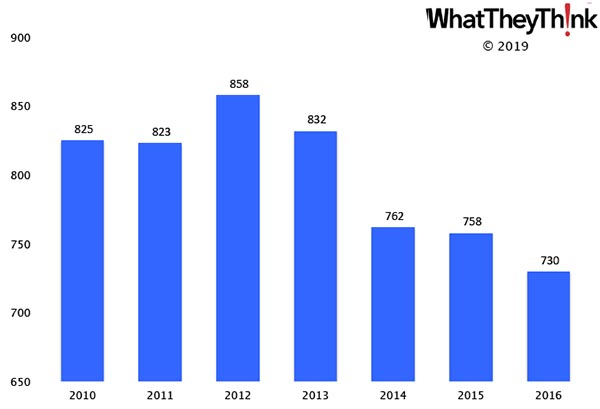
Paper Bag and Coated and Treated Paper Manufacturing—2010–2016
Published: November 1, 2019
In 2010, there were 825 establishments in NAICS 32222 (Paper Bag and Coated and Treated Paper Manufacturing). By 2016, that number had declined for a net loss of -12% to 730. Full Analysis
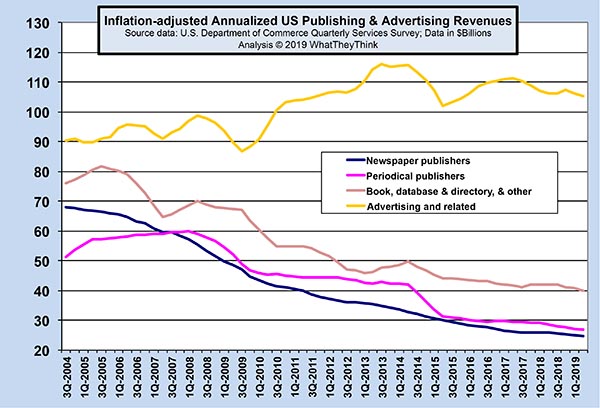
The View from the Other Side: Print Buyers’ Revenues
Published: October 25, 2019
Publishing and advertising are among the biggest print-buying markets. Last month, the Census Bureau released its Quarterly Services Survey, which reported revenues for these markets. Publishers’ revenues continue their long decline, while the up-and-down of advertising revenues indicate the extent to which the nature of advertising is changing. Full Analysis
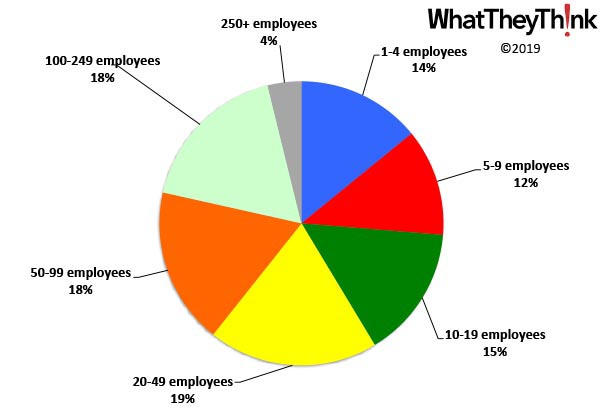
Paper Bag and Coated and Treated Paper Manufacturing Establishments—2016
Published: October 18, 2019
In 2016, there were 730 establishments in NAICS 32222 (Paper Bag and Coated and Treated Paper Manufacturing). Nearly four out of 10 (39%) have 50 or more employees, and 59% have 20 or more employees. Full Analysis
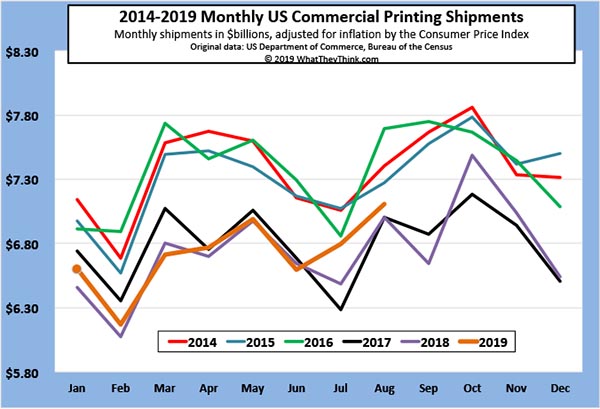
Printing Shipments: The Dog Days of Summer Didn’t Bite
Published: October 11, 2019
The value of printing shipments for August 2019 was $7.1 billion—up from July’s $6.8 billion. As we head into the autumn, 2019 is shaping up to be the best year for the industry in three years. Full Analysis
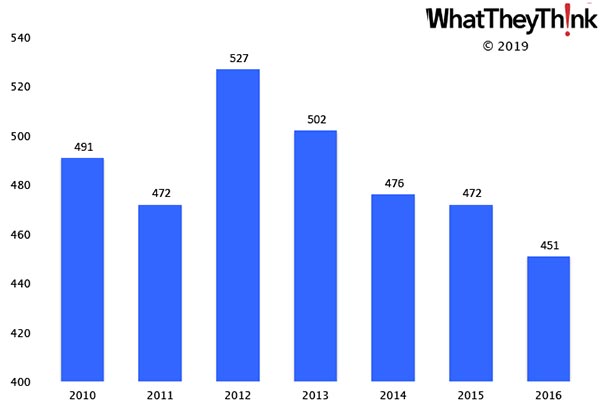
Folding Paperboard Box Manufacturing Establishments—2010–2016
Published: October 4, 2019
In 2010, there were 491 establishments in NAICS 322212 (Folding Paperboard Box Manufacturing). By 2016, that number had declined for a net loss of -8% to 451. Full Analysis
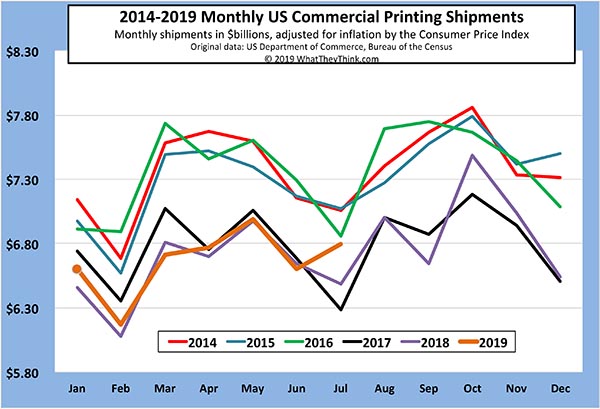
Printing Shipments: Summer Surprise
Published: September 27, 2019
The value of printing shipments for July 2019 was $6.8 billion—up from June’s $6.6 billion. Breaking with seasonality, what has typically been one of the lowest months of the year for printing shipments actually came in pretty good. Full Analysis
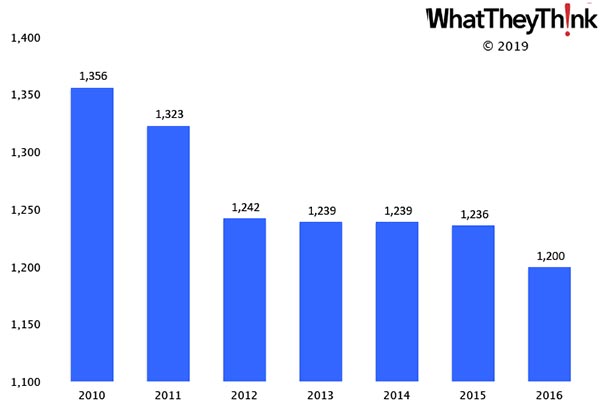
Corrugated and Solid Fiber Box Manufacturing Establishments—2010–2016
Published: September 20, 2019
In 2010, there were 1,356 establishments in NAICS 322211 (Corrugated and Solid Fiber Box Manufacturing). By 2016, that number had declined -12% to 1,200. Full Analysis
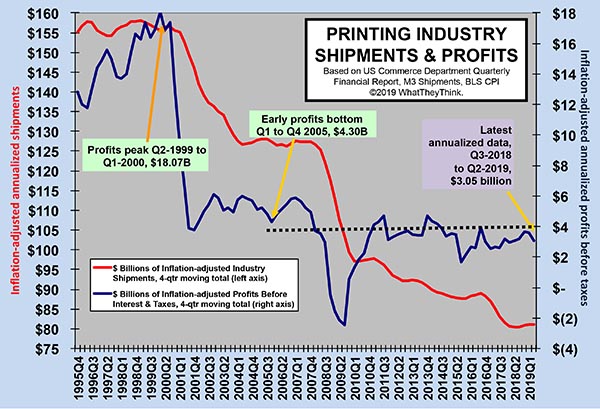
Industry Profits: Mind the Gap
Published: September 13, 2019
Annualized profits for the second quarter of 2019 were down from $3.61 billion in Q1 to $3.05 billion. However, the gap between large and small printers has only narrowed very slightly. Full Analysis
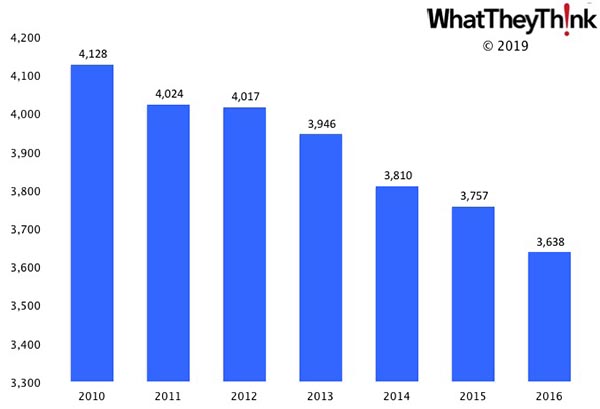
Converted Paper Product Manufacturing Establishments—2010–2016
Published: September 6, 2019
In 2010, there were 4,128 establishments in NAICS 3222 (Converted Paper Product Manufacturing). By 2016, that number had declined -12% to 3,638. Full Analysis
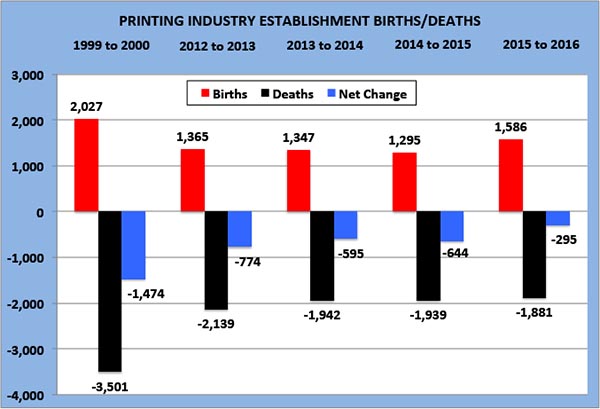
Printing Establishment Births and Deaths
Published: August 30, 2019
From 2015 to 2016, there was an increase of +1,586 printing establishments and a decrease of -1,881 establishments, for a net loss of -295 establishments. Full Analysis
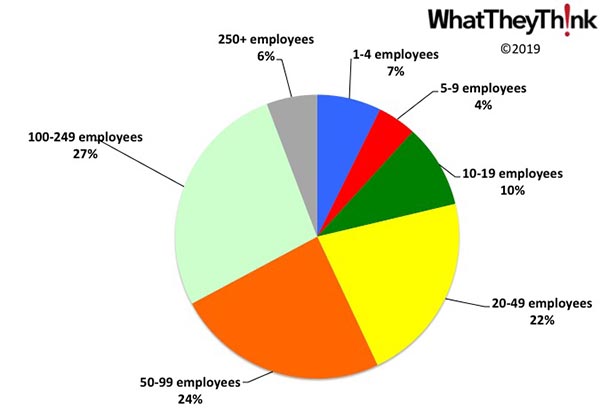
Folding Paperboard Box Manufacturing Establishments—2016
Published: August 23, 2019
In 2016, there were 451 establishments in NAICS 322212 (Folding Paperboard Box Manufacturing). More than half of these establishments (57%) have 50 or more employees and more than three-fourths (79%) have 20 or more employees. Full Analysis
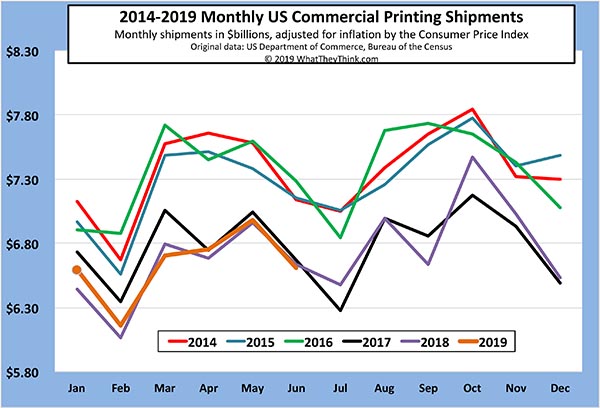
June Printing Shipments: The Dog Days of Summer Begin
Published: August 16, 2019
Printing shipments for June 2019 were—as expected—down from May, and came in slightly below June 2018. Full Analysis
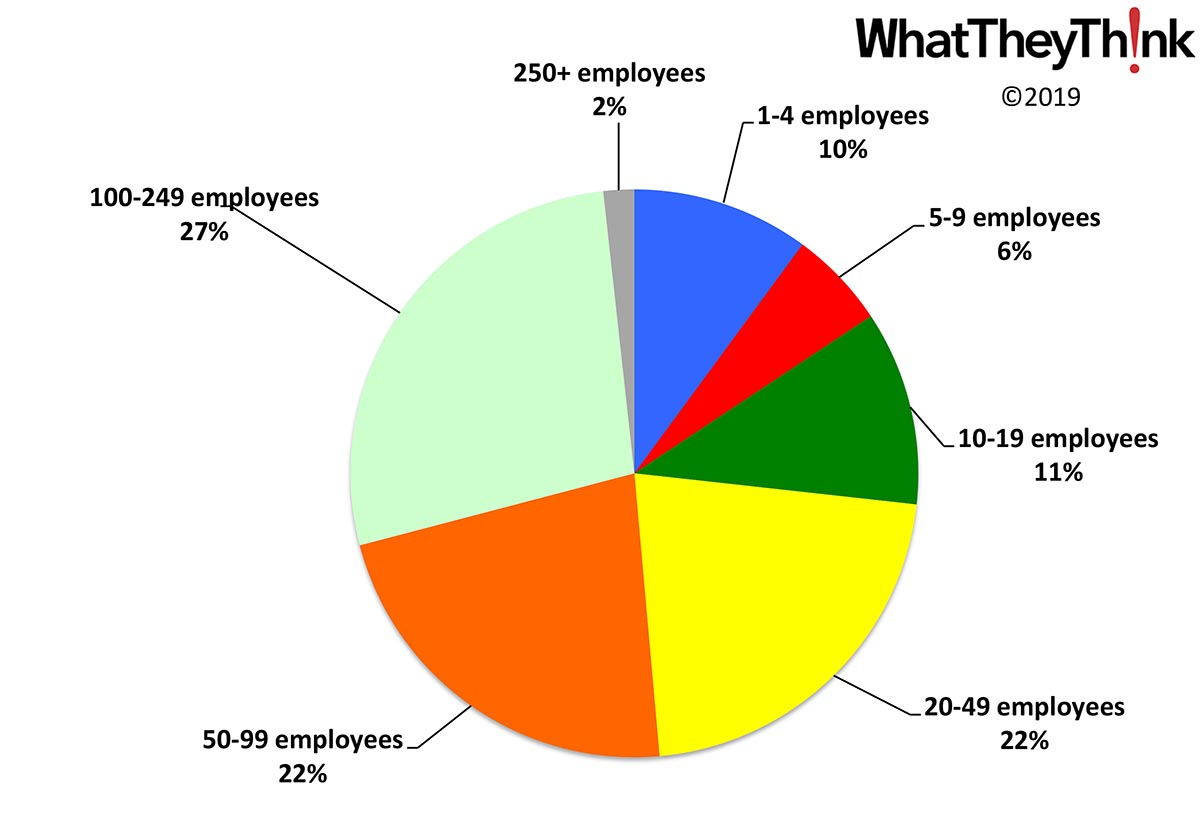
Corrugated and Solid Fiber Box Manufacturing Establishments—2016
Published: August 9, 2019
in 2016, there were 1,200 establishments in NAICS 322211 (Corrugated and Solid Fiber Box Manufacturing). About half of these establishments (49%) have 50 or more employees and more than two-thirds (71%) have 20 or more employees. Full Analysis
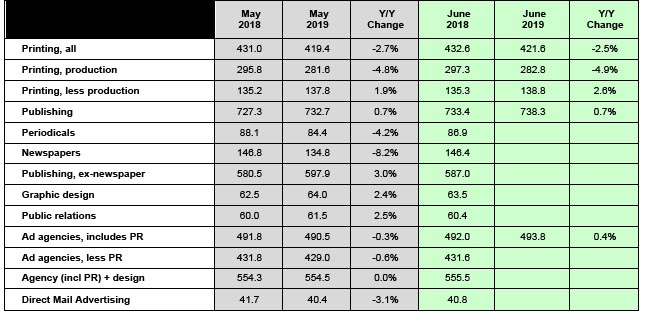
June Jobs: Up in the Short Term, Down in the Long Term
Published: August 2, 2019
In June, overall printing employment grew +0.5% from May to June 2019. On a year-over-year basis, it is down -2.5%. Production employment was up +0.4% from May to June, but year-over-year was down -4.9%. Non-production employment was up +0.7% from May to June, and year-over-year was up +2.6%. Full Analysis
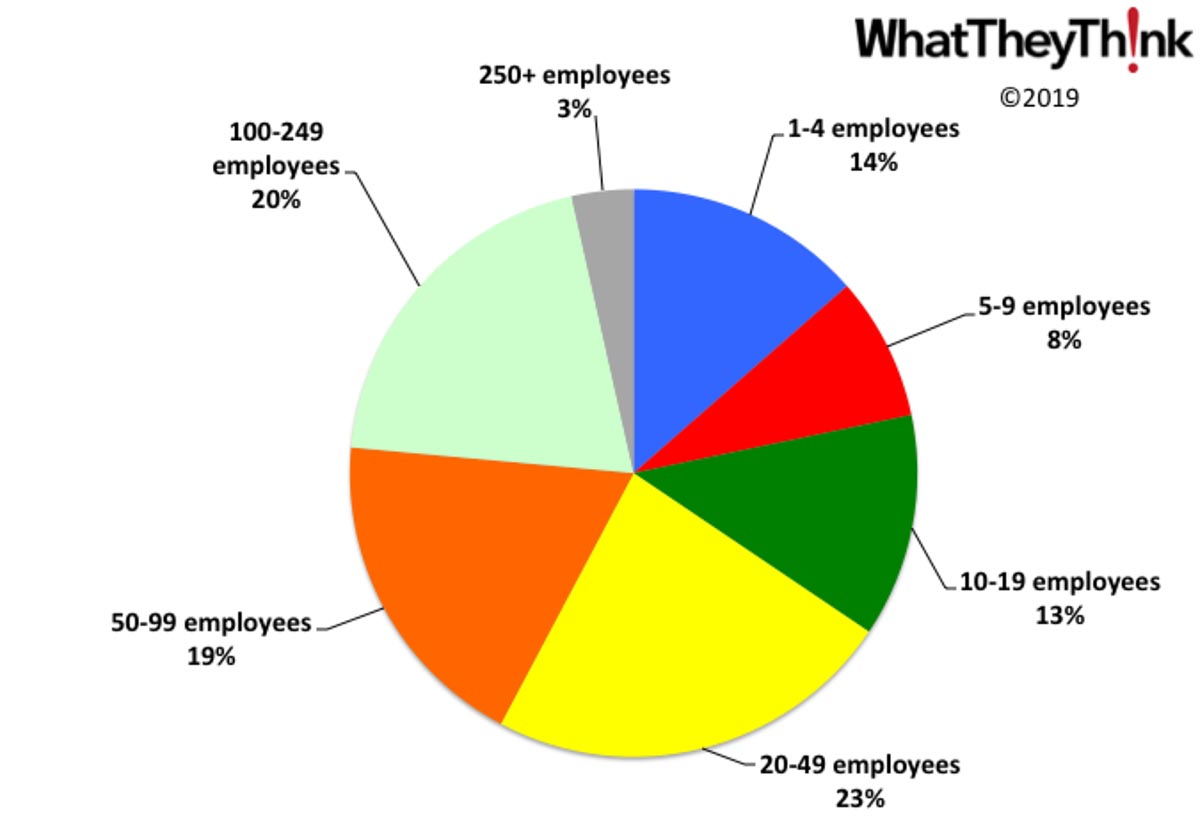
Converted Paper Product Manufacturing Establishments—2016
Published: July 26, 2019
in 2016, there were 3,638 establishments in NAICS 3222 (Converted Paper Product Manufacturing). More than four out of 10 of these establishments (42%) have 50 or more employees and two-thirds (65%) have 20 or more employees. Full Analysis
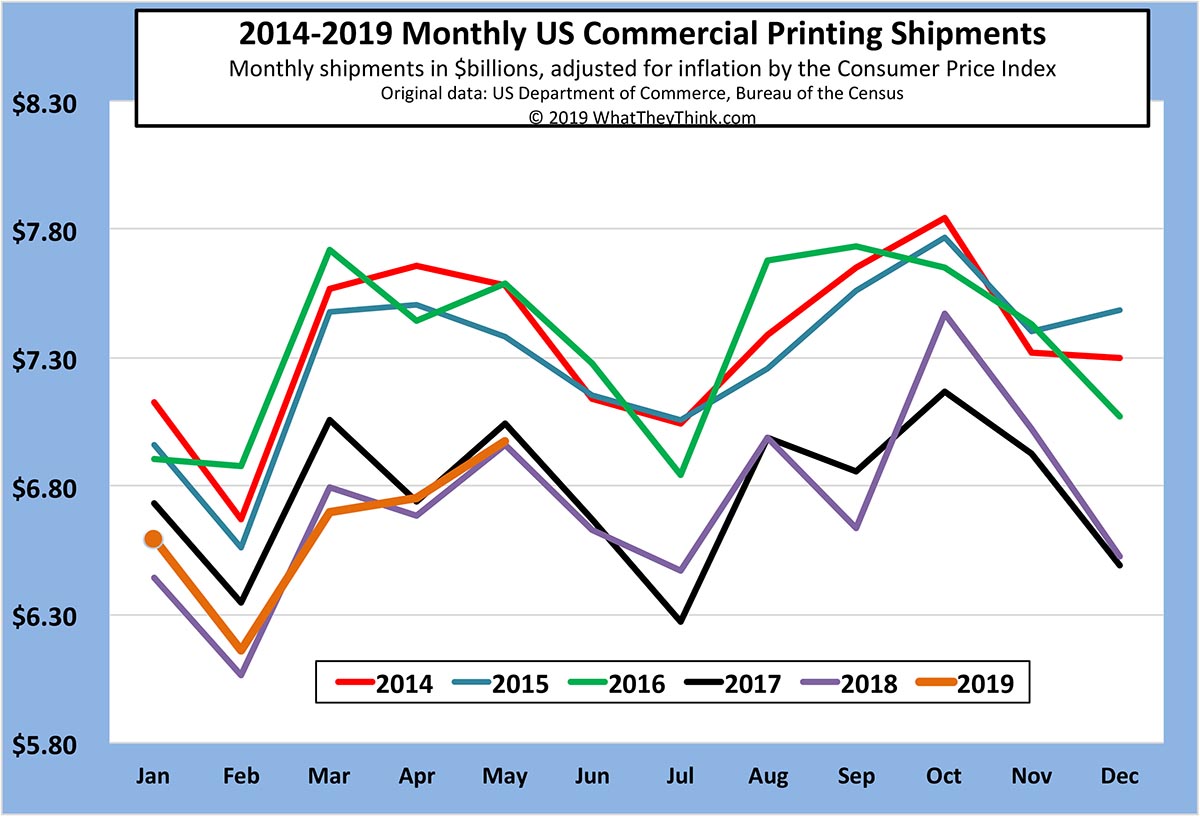
May Printing Shipments Up from April
Published: July 19, 2019
Printing shipments for May 2019 were up from April—and even came in above May 2018 shipments, albeit only very slightly. Full Analysis
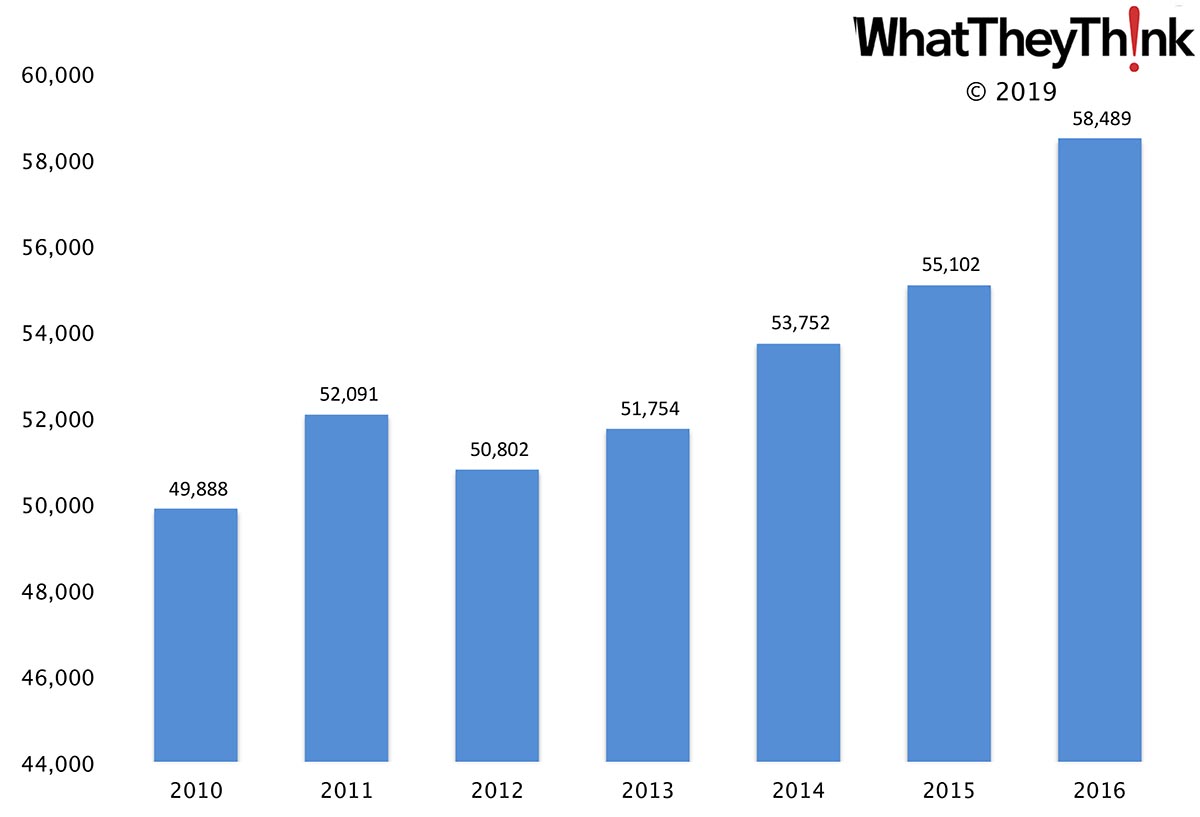
PR Agency Employees—2010–2016
Published: July 12, 2019
In 2016, there were 58,489 employees in establishments in NAICS 54182 (Public Relations Agencies). Employment in this category has grown +17% from 2010 to 2016. Full Analysis
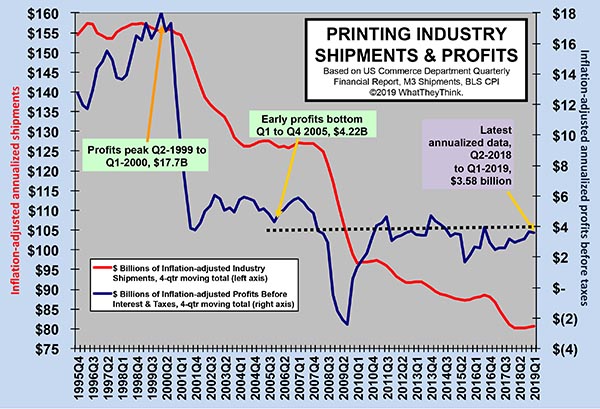
Printing Industry Profits: What Goes Up...
Published: June 28, 2019
Industry profits data came out earlier this month, and overall profits slipped a little. Annualized profits for Q1 2019 were $3.58 billion, down slightly from $3.66 billion in Q4 of last year. Again, it’s the large printers that are dragging down overall industry profitability. Full Analysis
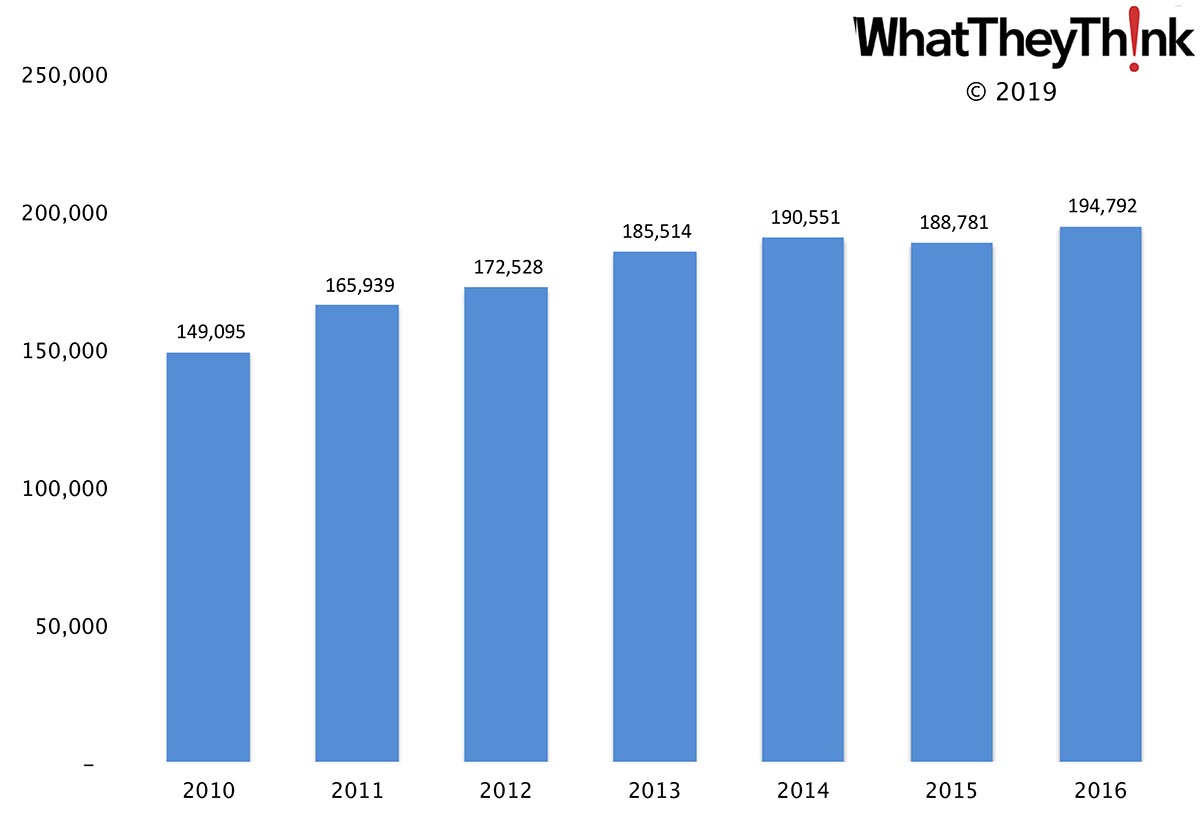
Advertising Agency Employees—2010–2016
Published: June 21, 2019
In 2016, there were 194,792 employees in establishments in NAICS 54181 (Advertising Agencies). Employment in this category has grown +31% from 2010 to 2016. Full Analysis
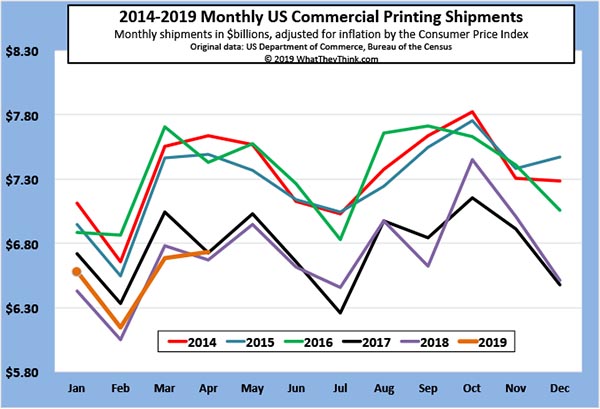
April Printing Shipments—A New Season?
Published: June 14, 2019
Printing shipments for April were up from March, happily disrupting what has become the usual seasonal pattern. Even better, April 2019 shipments came in above April 2018 shipments. Full Analysis
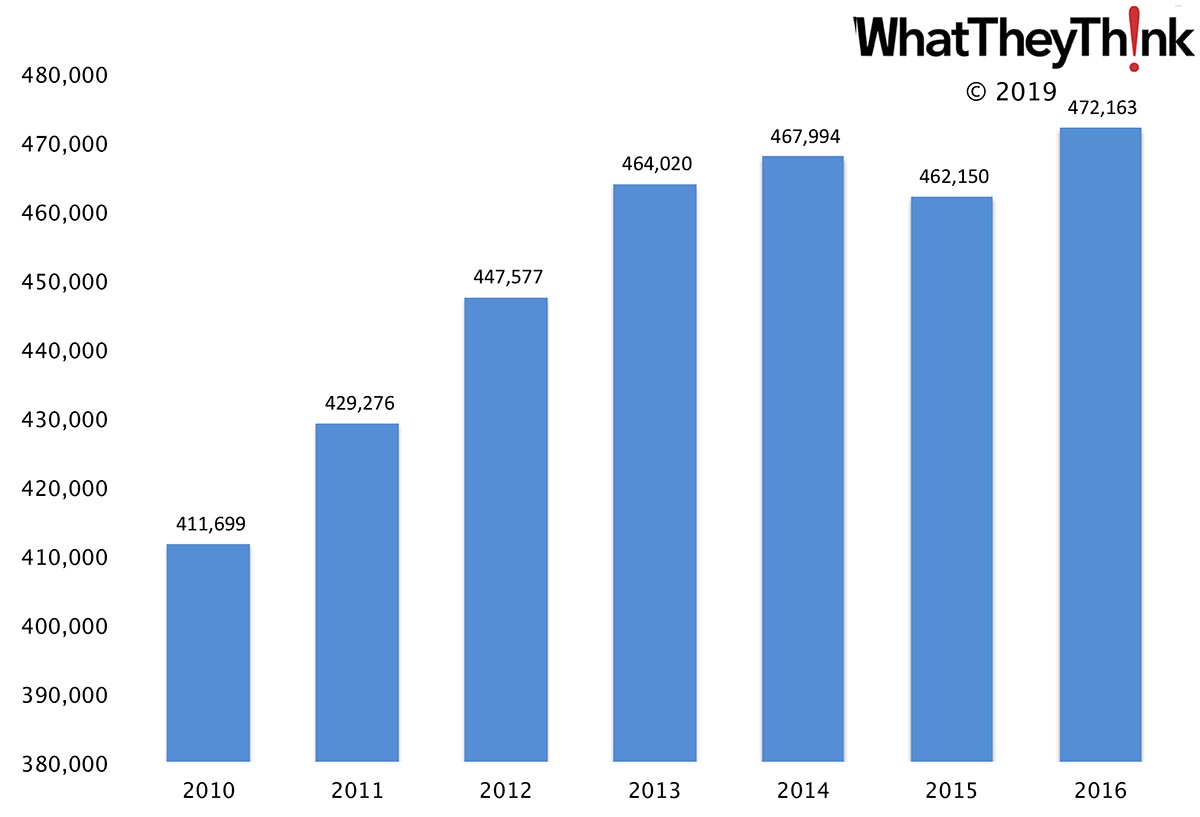
Advertising, Public Relations, and Related Services Employees—2010–2016
Published: June 7, 2019
In 2016, there were 472,163 employees in establishments in NAICS 5418 (Advertising, Public Relations, and Related Services). Employment in this category has grown +15% from 2010 to 2016. Full Analysis
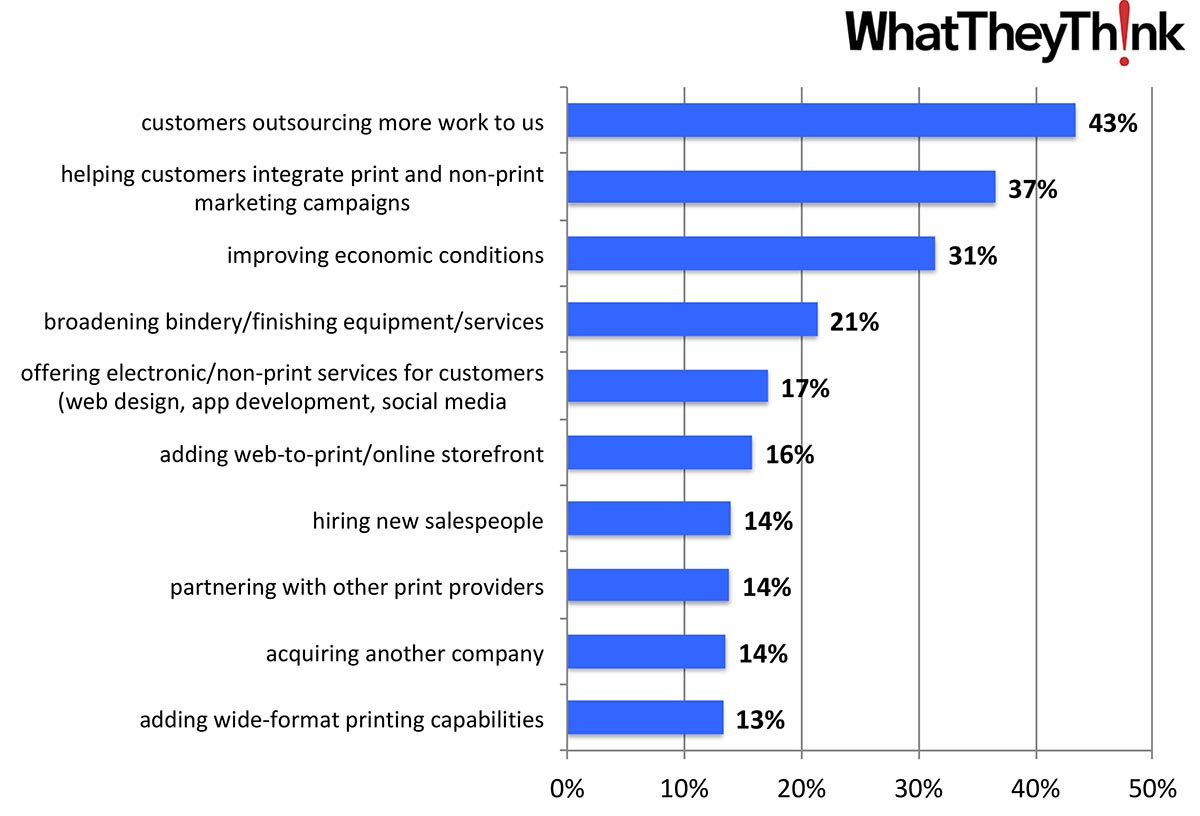
The Changing Face of Print Business Opportunities
Published: May 31, 2019
In our annual Print Business Outlook Survey, we found that the top opportunities for print businesses included some newer, proactive items, with some of the old chestnuts falling off the tree. As we saw with recent Business Challenges, could this reflect a “changing of the guard” of print business management? Full Analysis
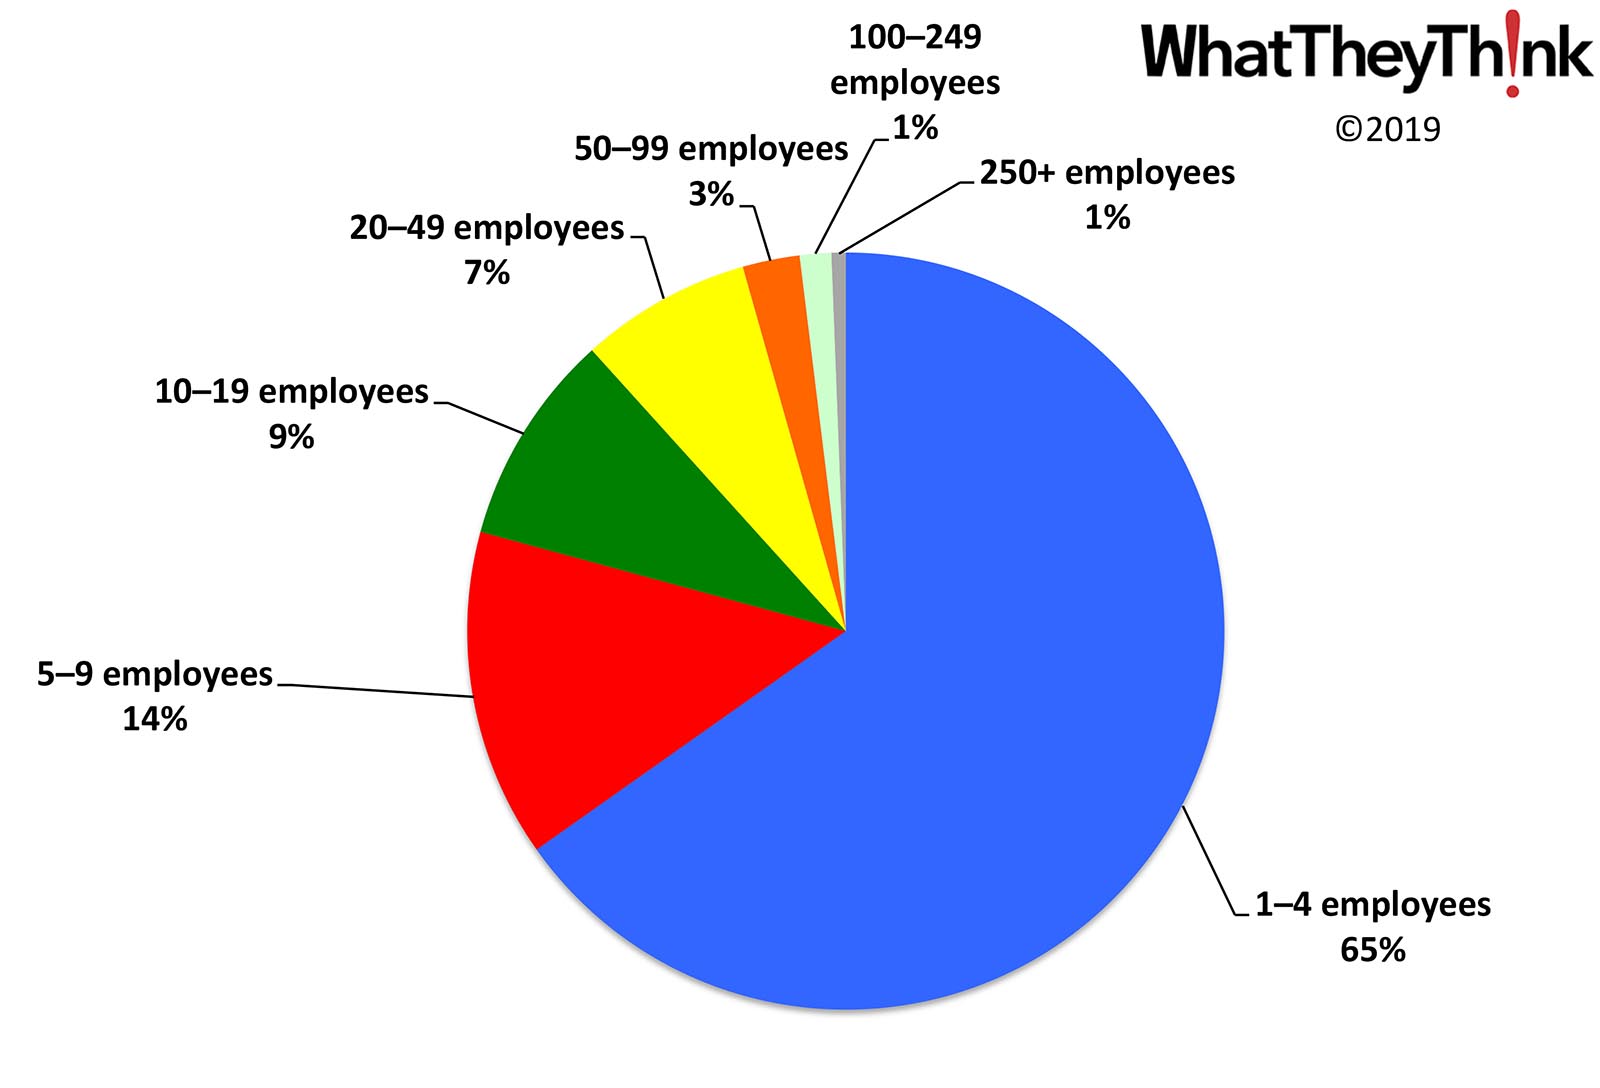
Advertising, Public Relations, and Related Services Establishments—2016
Published: May 24, 2019
in 2016, there were 37,875 establishments in NAICS 5418 (Advertising, Public Relations, and Related Services). Two-thirds of these establishments (65%) have under four employees, 79% have under 10 employees, and 88% have under 20 employees. The largest agencies (100 or more employees) only account for 2% of all establishments. Full Analysis
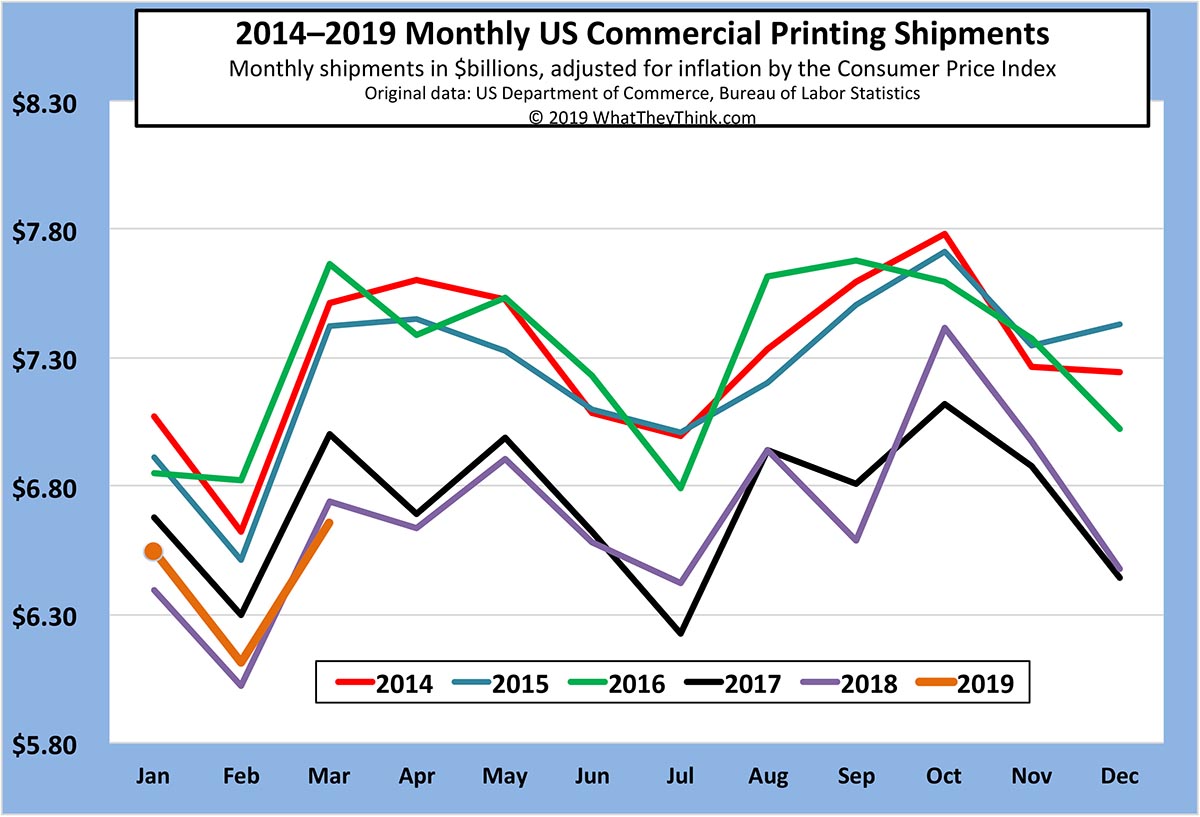
March Printing Shipments: A Day at the Races
Published: May 17, 2019
The value of printing shipments for March were up from February. However, at $6.66 billion, March 2019 shipments came in below March 2018’s $6.74 billion. That’s not a huge disappointment, but we were hoping for a better month. Full Analysis
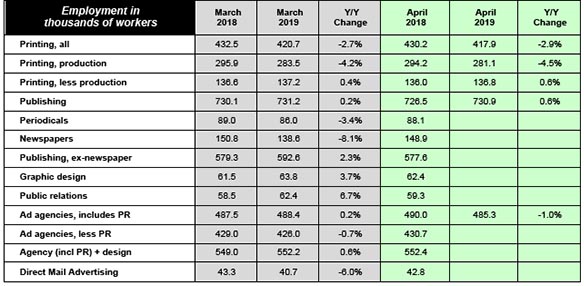
Printing’s Labor's Lost?
Published: May 10, 2019
Overall printing employment dropped -0.7% from March to April 2019 and on a year-over-year basis is down -2.9%. Production employment dropped a tad from March to April, and is down -4.5% from April 2018. Non-production employment was up +0.6% from April 2018 to April 2019. Full Analysis
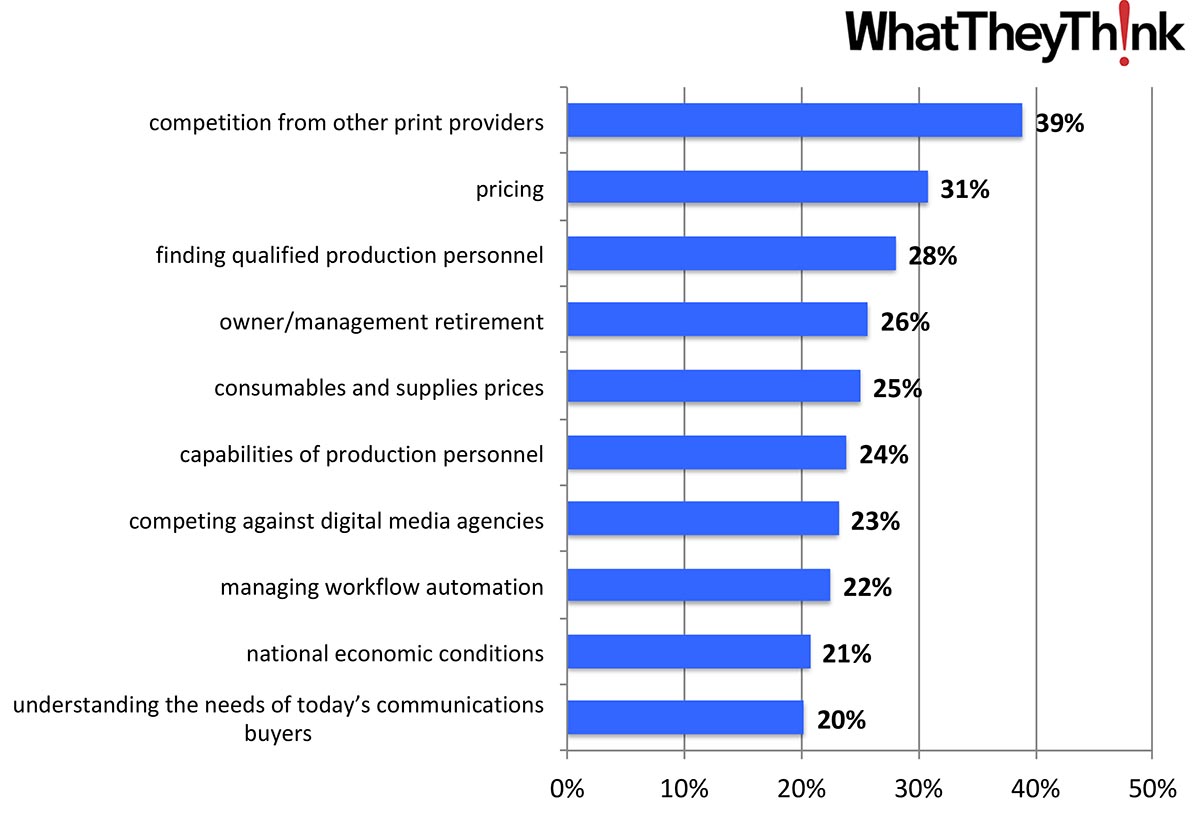
Print Business Challenges: Some Old Cares, Some New Concerns
Published: May 3, 2019
In Winter 2018/2019, we conducted our annual Print Business Outlook Survey and found that the top challenges for print businesses included some new cares and concerns with some of the old challenges falling by the wayside. Could this reflect a “changing of the guard” of print business management? Full Analysis
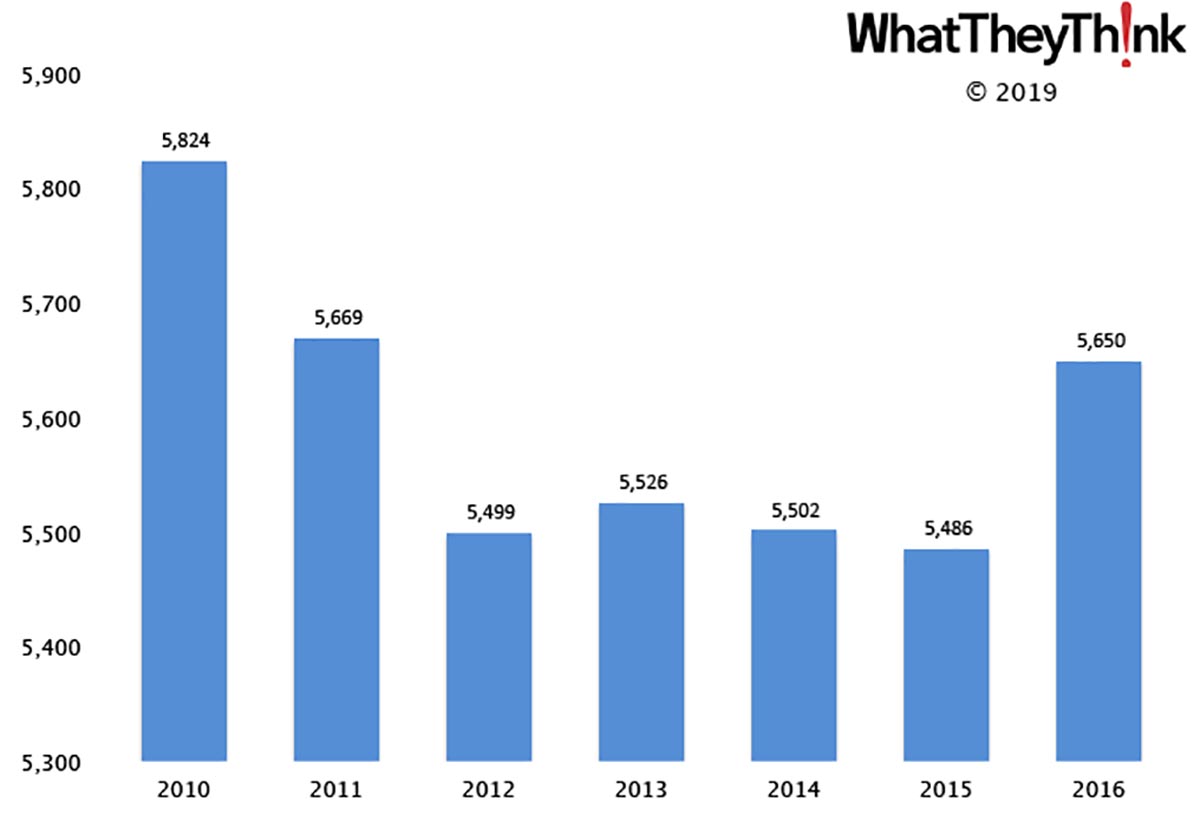
Sign Manufacturers—2010–2016
Published: April 26, 2019
In 2016, there were 5,650 Sign Manufacturing establishments (NAICS 33995). The decline and rise of sign manufacturing over the course of the 2010s reflects the impact of the Great Recession, as well as the recovery and the growth of digital printing into traditional signmaking. Full Analysis
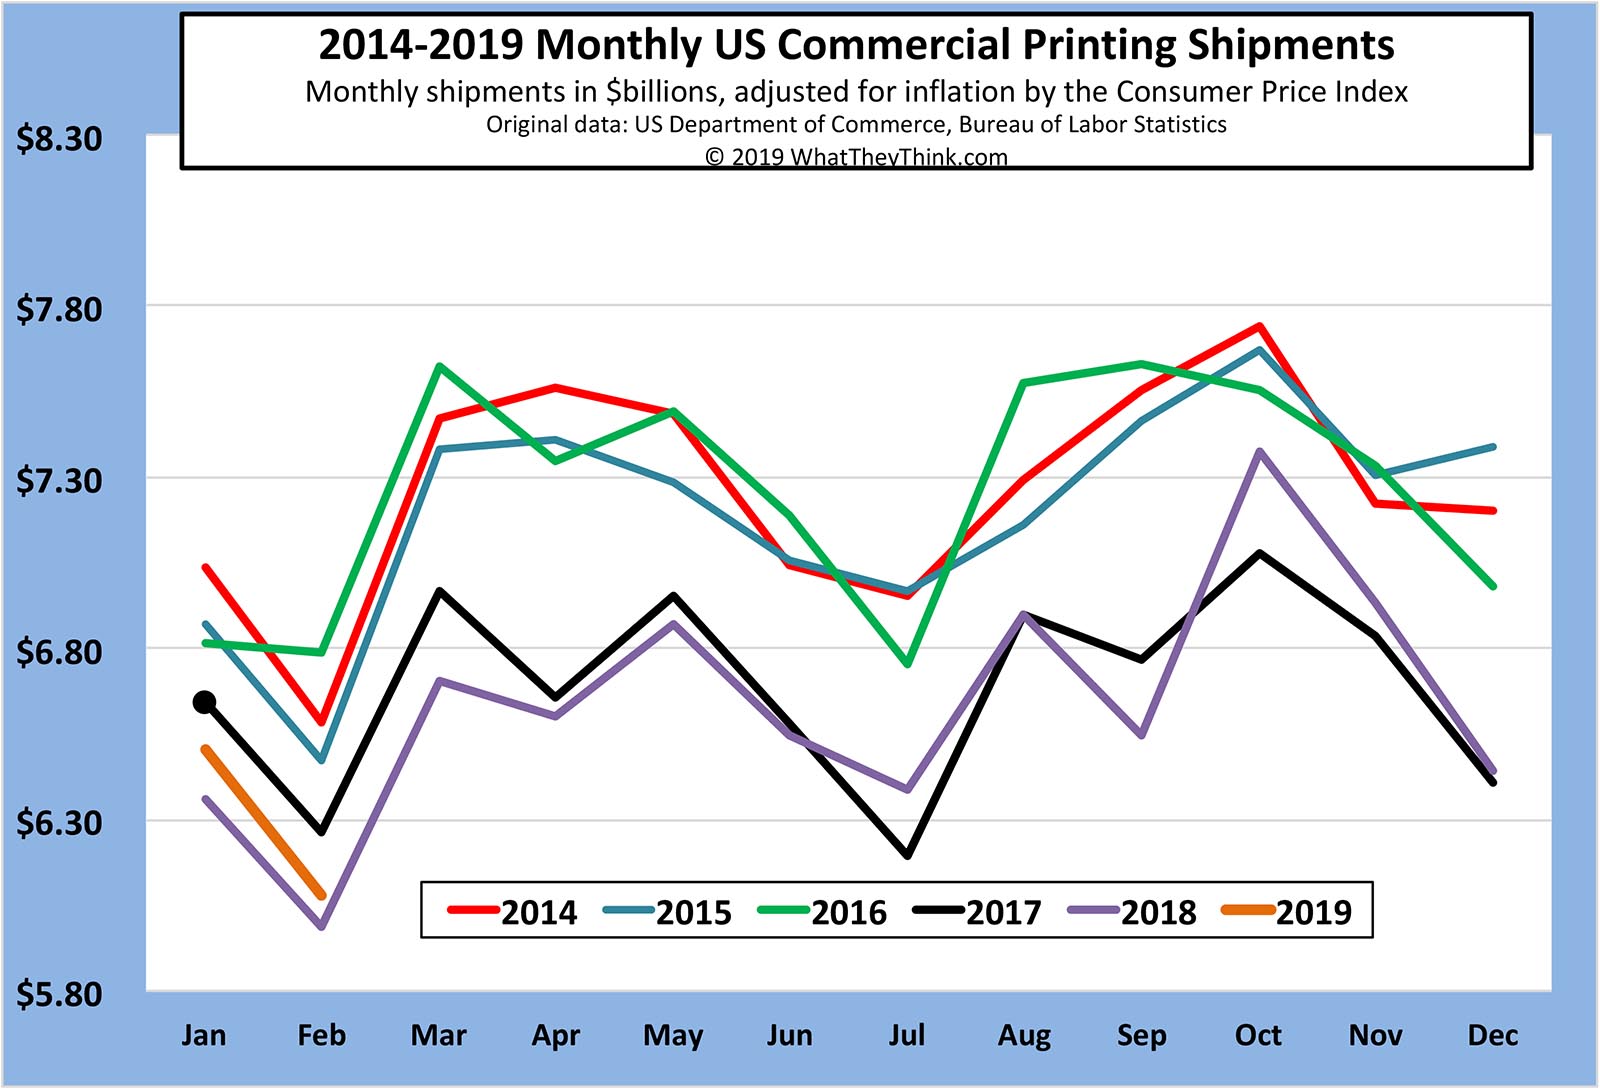
February 2019 Printing Shipments: Starting the Year Off on the Right Foot
Published: April 19, 2019
Printing shipments for February 2019 came in at $6.08 billion. In keeping with the industry’s seasonality, it’s down from January, but so far 2019 shipments are higher than 2018’s. Full Analysis
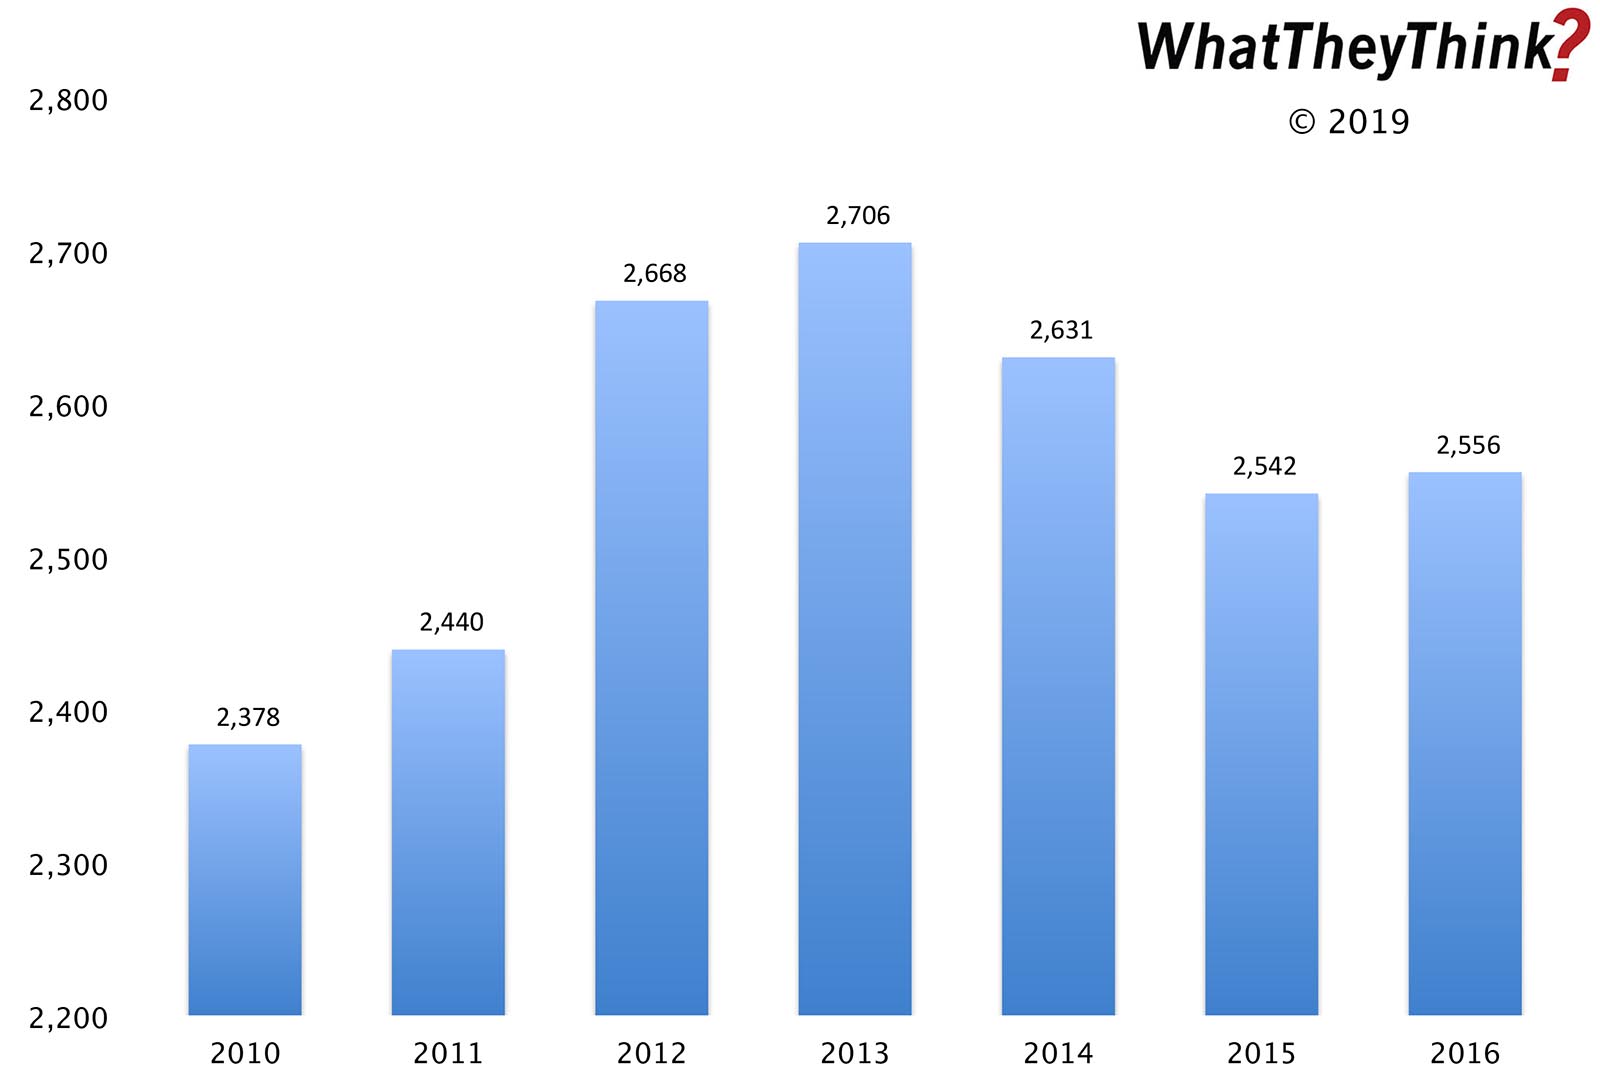
Outdoor Advertising Establishments—2010–2016
Published: April 12, 2019
In 2016, there were 2,556 establishments classified as Outdoor Advertising (NAICS 54185). In 2010, NAICS 54185 comprised 2,378 establishments—but note that the Census Bureau changed the name of this category in 2012. Full Analysis
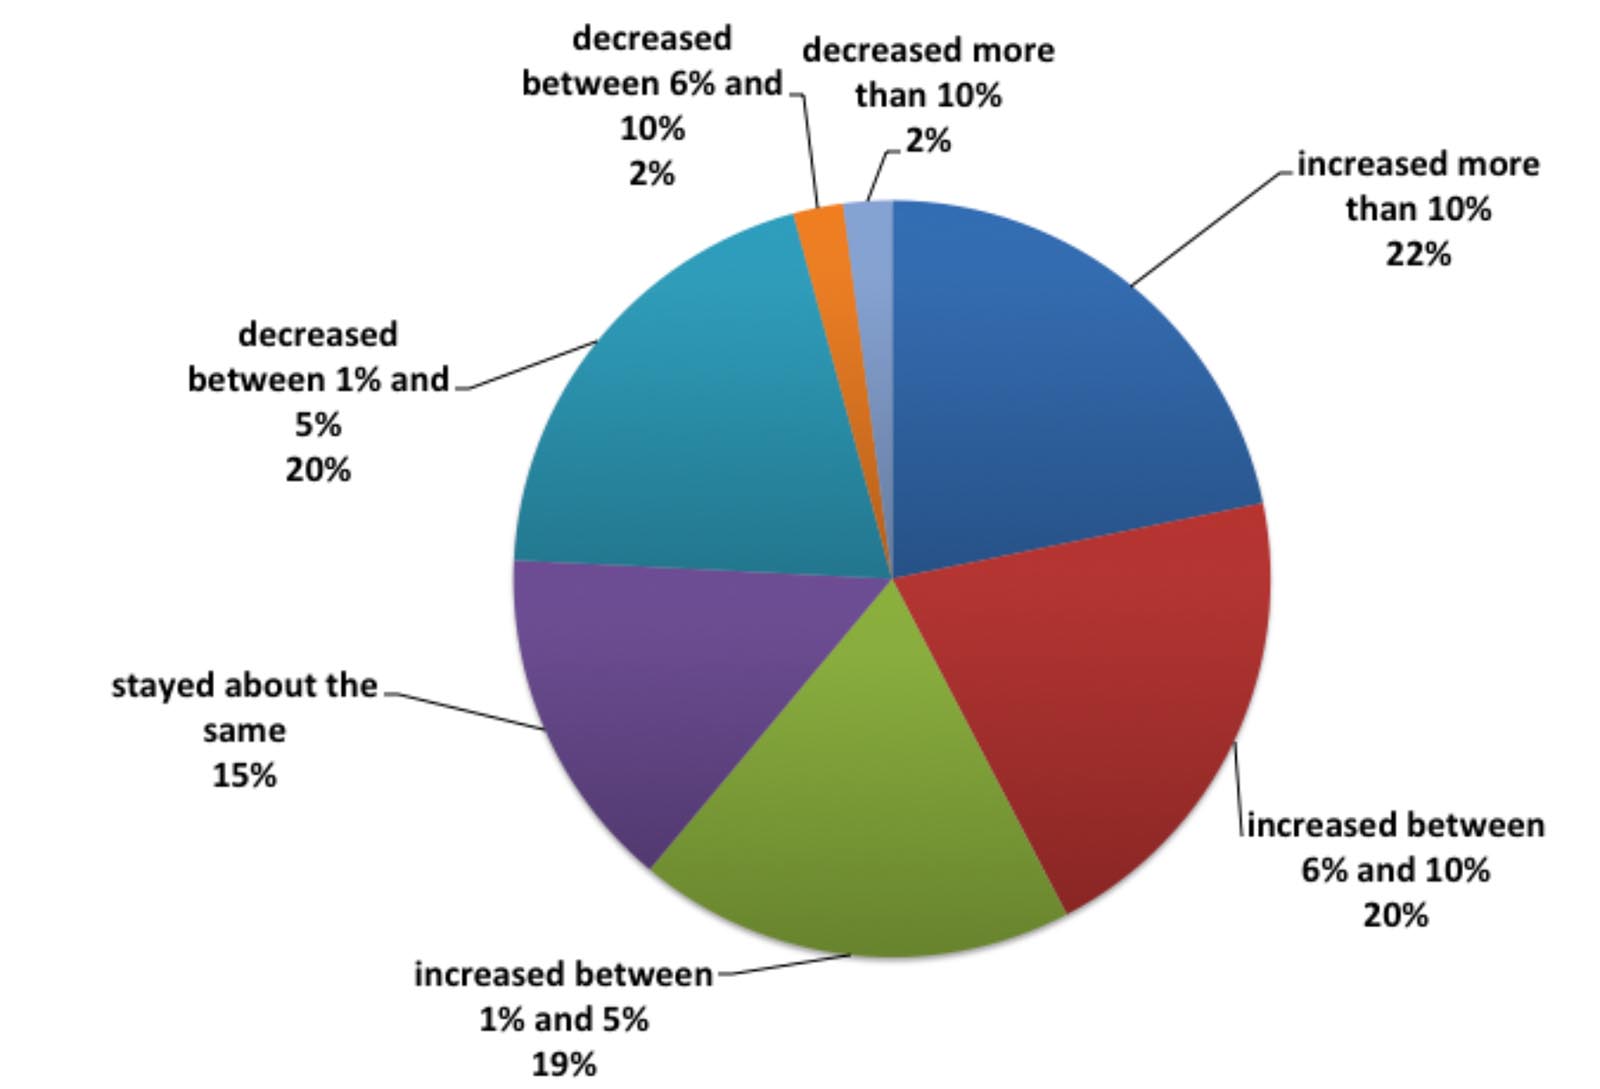
Business Conditions: Up in 2018, Optimism High for 2019
Published: April 5, 2019
In Winter 2018/2019, we conducted our annual Print Business Outlook Survey and found that business in 2018 was perceived by survey respondents as overall pretty good: 42% said that revenues had increased by six percent or more compared to 2017. Full Analysis
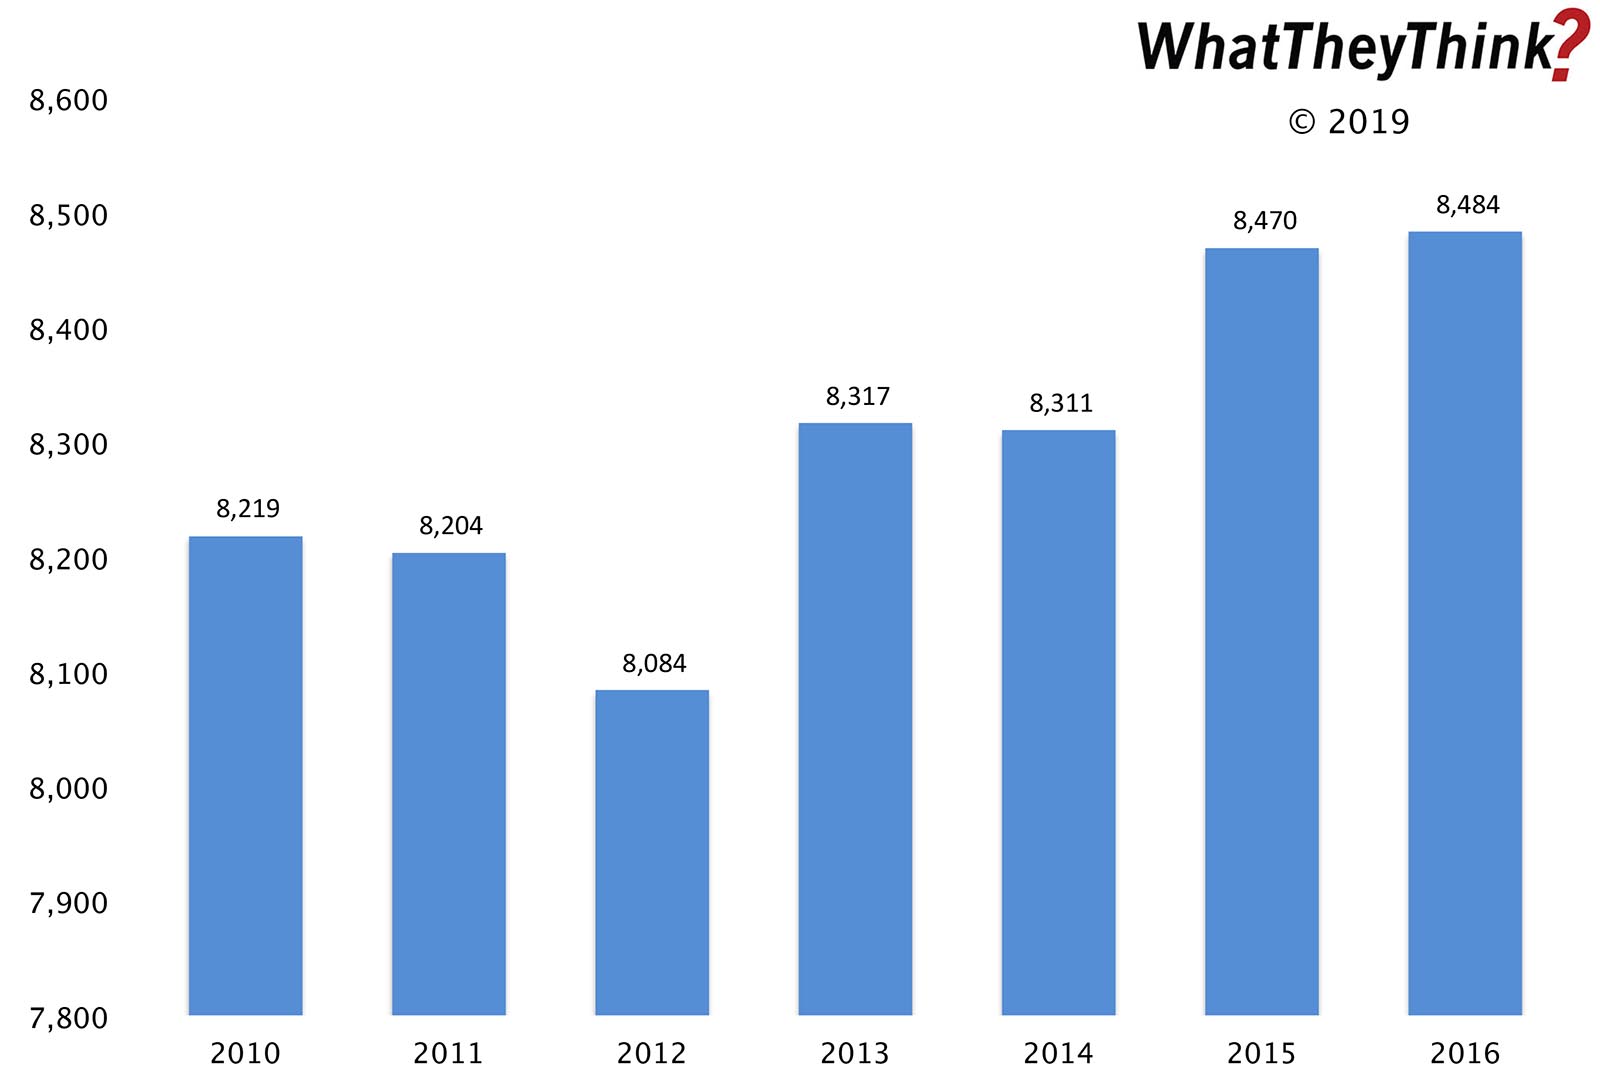
PR Establishments—2010–2016
Published: March 29, 2019
In 2010, there were 8,219 establishments classified as PR Agencies. By 2016, there had been a net gain of +3.2%. Full Analysis
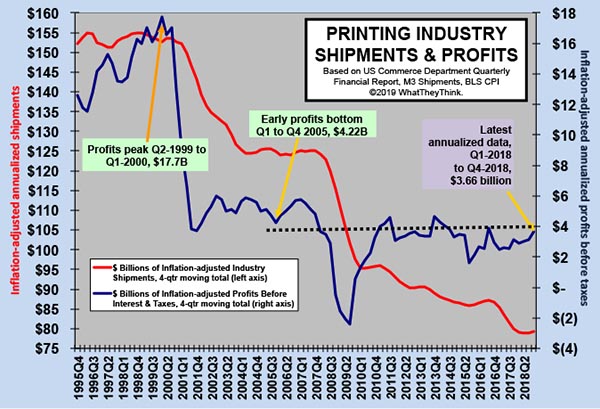
Printing Industry Profits: Urban Sprawl in the Tale of Two Cities
Published: March 22, 2019
Overall, annualized printing industry profits for Q4 2018 were $3.66 billion—not a massive gain from Q3 but a gain nonetheless (we’ll take it). It also appears that the “tale of two cities” trend is—at least temporarily—on hold. Full Analysis
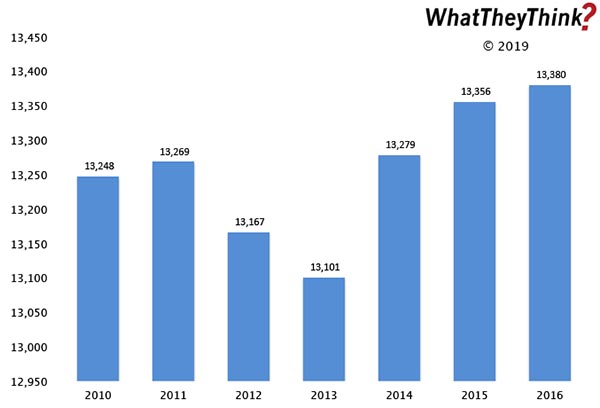
Advertising Agency Establishments—2010–2016
Published: March 15, 2019
In 2010, there were 13,248 establishments classified as Advertising Agencies. By 2016, there had been a net gain of +1.0%, the ups and downs reflecting the changing role of the ad agency. Full Analysis
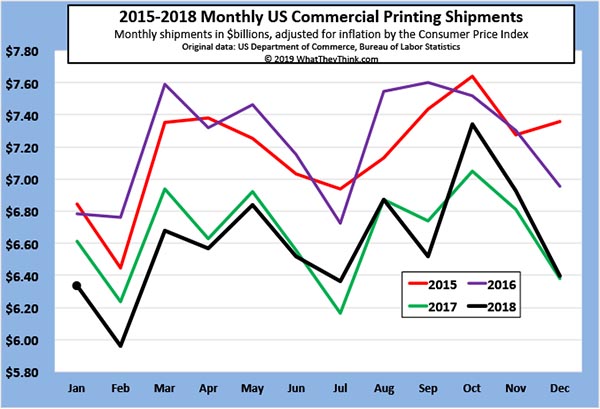
December 2018 Printing Shipments: Ending 2018 on a High(ish) Note
Published: March 8, 2019
Printing shipments for December 2018 came in at $6.40 billion. In keeping with the industry’s new seasonality, that’s down from November, but higher than December 2017—but just barely. Full Analysis
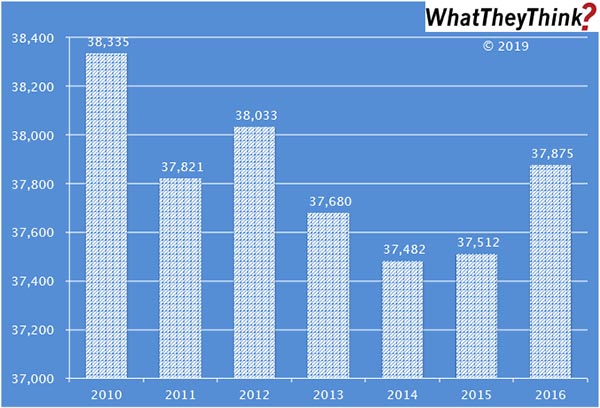
Advertising and Related Establishments—2010–2016
Published: March 1, 2019
In 2010, there were 38,335 establishments classified as Advertising, Public Relations, and Related Services. By 2016, there had been a net loss of -1.2%. This is a very broad industry classification, comprising a disparate bunch of business types, each of which has its own unique dynamics. Full Analysis
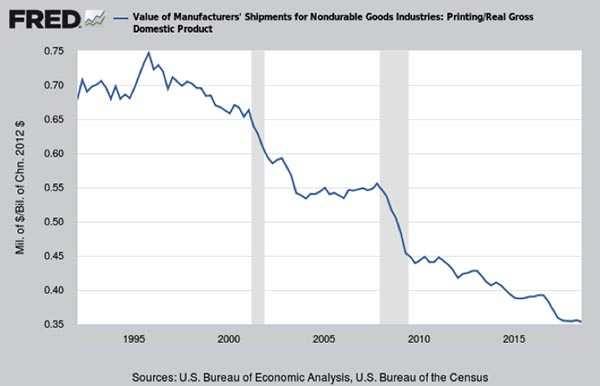
Printing Shipments as a Percentage of GDP
Published: February 22, 2019
Since 1997, the value of printing shipments went from around 0.75% of GDP all the way down to about 0.35%. So we should not be surprised that parts of the printing industry are falling off the government’s radar. Full Analysis
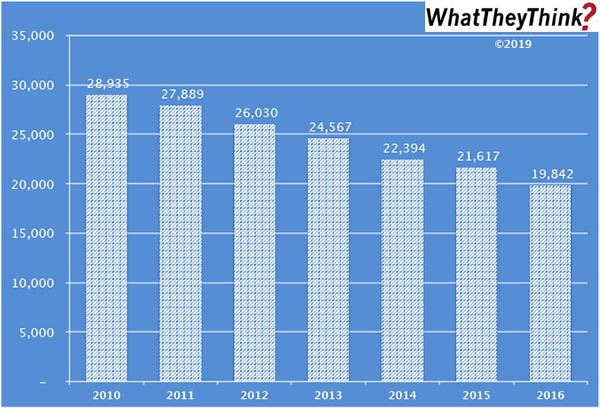
Book Printing Employees—2010–2016
Published: February 15, 2019
In 2010, there were a total of 28,935 employees in U.S. book printing establishments (NAICS 323117). By 2016, book printing employment had dropped to 19,842. Full Analysis
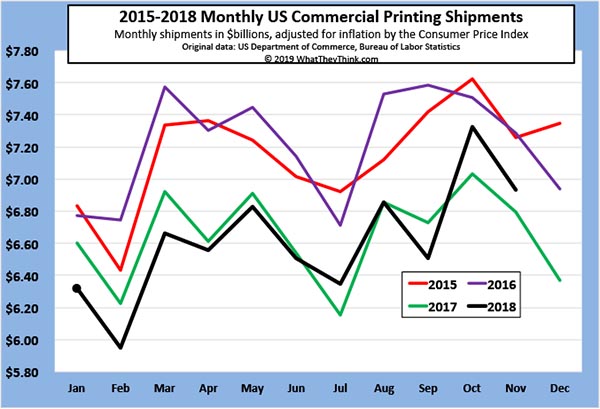
November 2018 Printing Shipments: Meeting Expectations
Published: February 8, 2019
Printing shipments for November 2018 came in at $6.93 billion. In keeping with the industry’s new seasonality, that’s down from October—but it’s still above November 2018’s $6.80 billion. Full Analysis
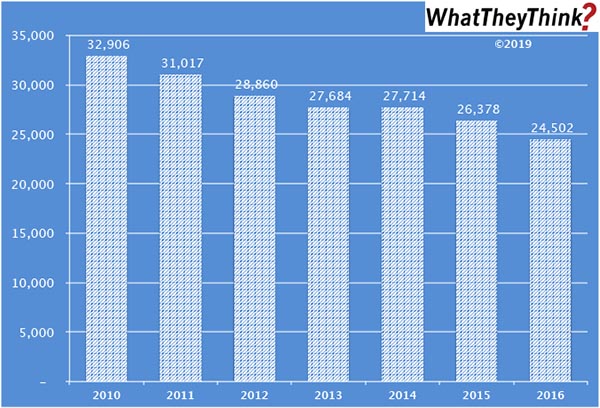
Prepress and Postpress Services Employees—2010–2016
Published: February 1, 2019
In 2010, there were a total of 32,906 employees in U.S. prepress and postpress services establishments (NAICS 32312). By 2016, “support services for printing” employment had dropped to 24,502. Full Analysis
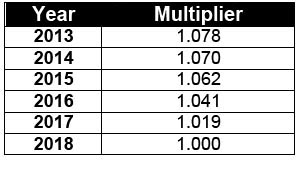
Latest Inflation Adjustment Multipliers
Published: January 25, 2019
Every January, we provide the latest inflation-adjustment multipliers so that print business owners can get a real sense of how they are performing year-over year. Full Analysis
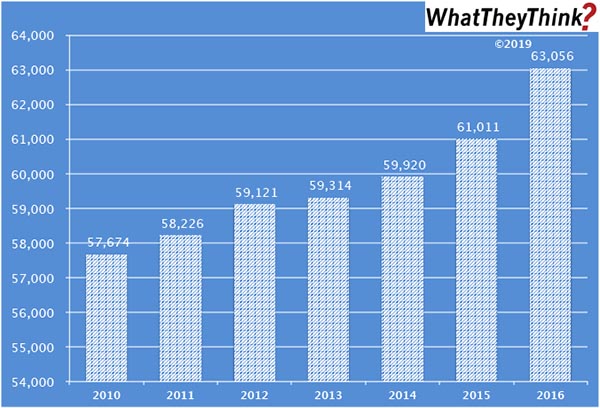
Screen Printing Employees—2010–2016
Published: January 18, 2019
In 2010, there were a total of 57,674 employees in U.S. screen printing establishments (NAICS 323113). By 2016, screen printing employment had grown to 63,056—the opposite of what we have seen in general commercial printing during that same period. Full Analysis
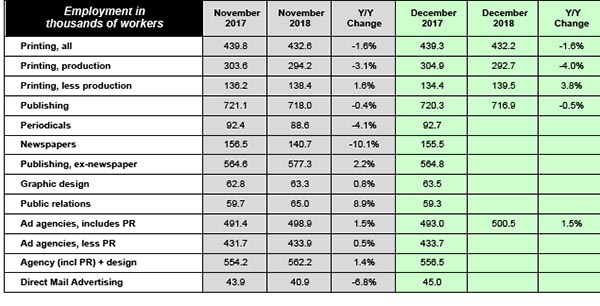
Graphic Arts Employment Held Steady in December
Published: January 11, 2019
Overall printing employment stayed roughly the same from November to December 2018, and, compared to December 2017, declined -1.6%. Non-production printing employment was up a bit in December, production employment down by about the same bit. PR employment continues to be the industry growth spot. Full Analysis
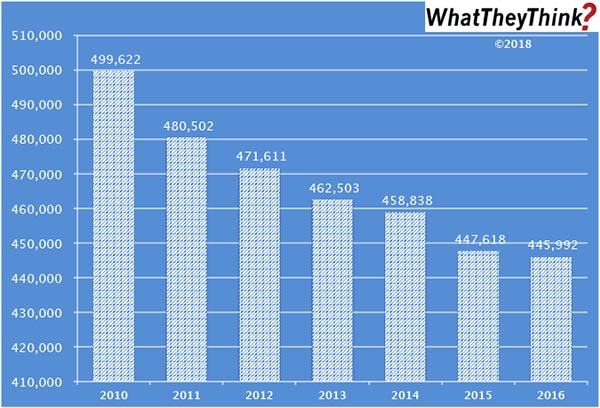
Commercial Printing Employees—2010–2016
Published: December 21, 2018
In 2010, there were a total of 499,622 employees in all commercial printing and related support businesses (NAICS 323). By 2016, overall industry employment had dropped to 445,992. Full Analysis
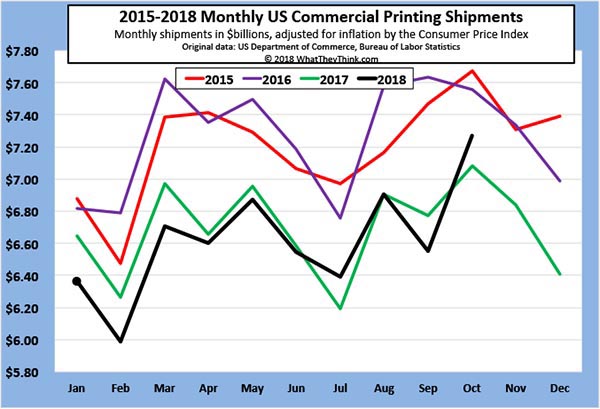
October 2018 Printing Shipments: Suitable for Framing
Published: December 14, 2018
Printing shipments for October 2018 came in at $7.27 billion. That’s up from September—and it’s well above October 2018’s $7.08 billion. Welcome to the new seasonality. Full Analysis
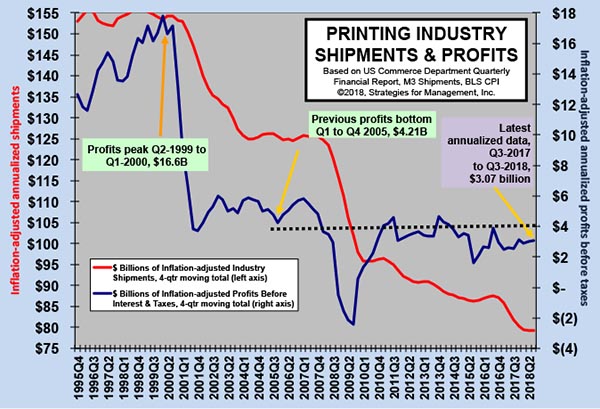
Printing Industry Profits: The Tale of Two Cities Continues
Published: December 7, 2018
Industry profits data came out earlier this week, and it was good and bad news. Overall, annualized profits for Q3 2018 were $3.07 billion—not a huge gain from Q2, but a gain nonetheless. But it’s the ongoing saga of the low profitability of large printers dragging down average industry profitability. Full Analysis
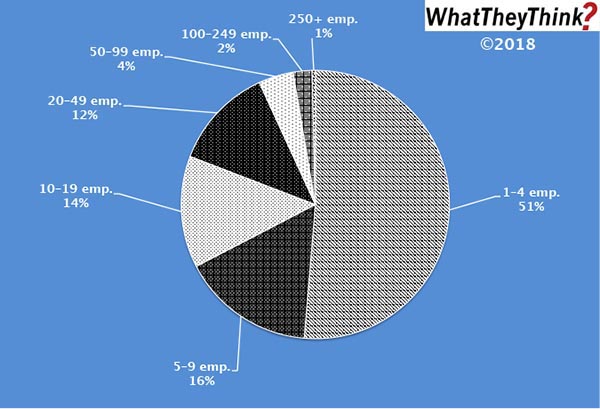
Prepress and Postpress Services Establishments—2016
Published: November 30, 2018
In 2016, there were 1,545 total U.S. establishments offering prepress and/or postpress services (NAICS 32312); 51% of these establishments had fewer than 10 employees. Full Analysis
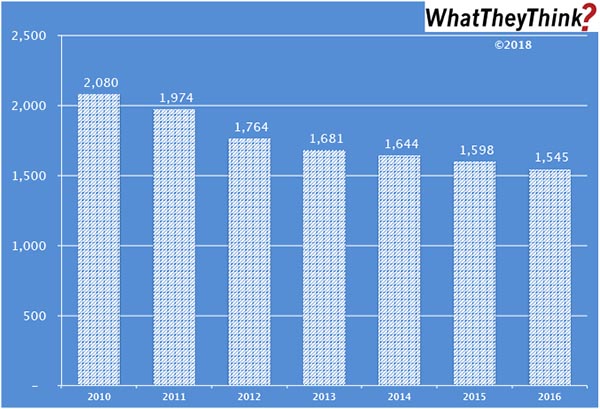
Prepress and Postpress Services Establishments
Published: November 16, 2018
In 2010, there were 2,080 establishments offering prepress and/or postpress services; by 2016, that number had dropped to 1,545. (The Census Bureau stopped breaking out prepress and postpress establishments separately in 2012.) It’s not difficult to understand why the number of these establishments has been dropping; prepress is being absorbed into the printing process itself (especially in digital printing), and more print businesses are acquiring their own finishing capabilities. Full Analysis
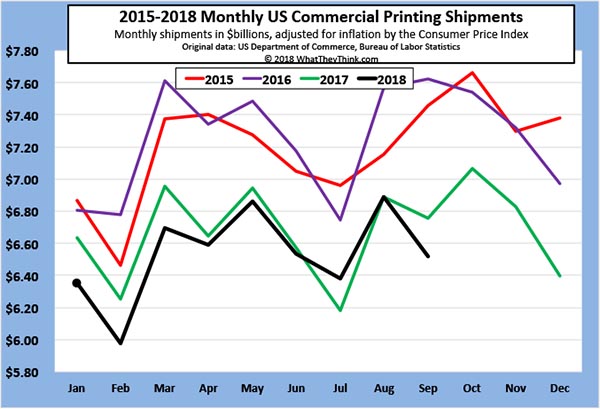
End of the Season? September 2018 Printing Shipments
Published: November 9, 2018
Printing shipments for September 2018 came in at $6.52 billion. That’s down from August—and it’s well below August 2017’s $6.76 billion. Are we seeing a new seasonality in the printing industry—or the end of any seasonality? Full Analysis
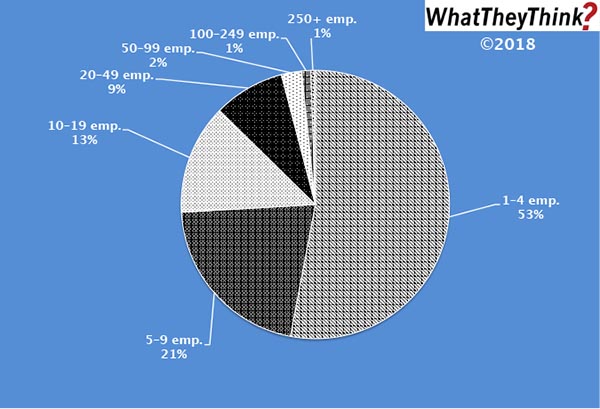
Screen Printers—2016
Published: November 2, 2018
In 2016, there were 5,150 total U.S. commercial screen printing establishments. As with most printing categories, the majority have under 10 employees, but screen shops tend to be smaller than other kinds of printing establishments. Full Analysis
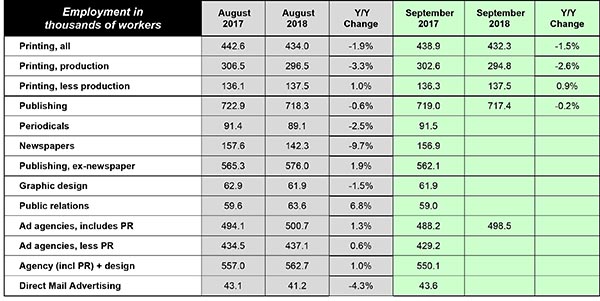
Graphic Arts Employment Continues to Decline; PR Employment Continues to Grow
Published: October 26, 2018
Overall printing employment dropped from August to September 2018, and on a year-over-year basis is down -1.5%. Non-production printing employment was up slightly, indicating that production staff are the hardest employees to find. PR employment is again the industry bright spot, employment-wise. Full Analysis
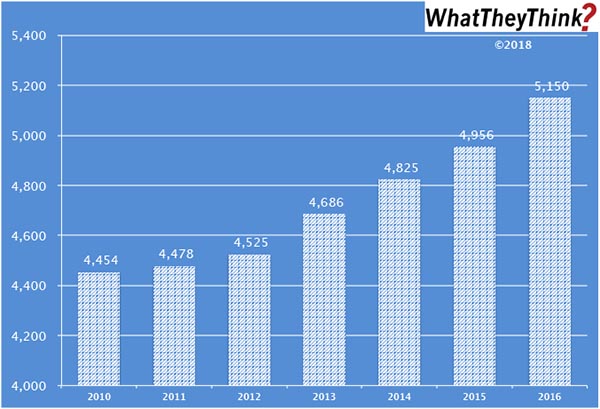
Screen Printers 2010–2016
Published: October 19, 2018
From 2010 to 2016, the number of U.S. commercial screen printing establishments increased from 4,454 to 5,150. Growth in screen printing establishments has been consistent from year to year. Chalk this up to the rise of specialty printing. Full Analysis
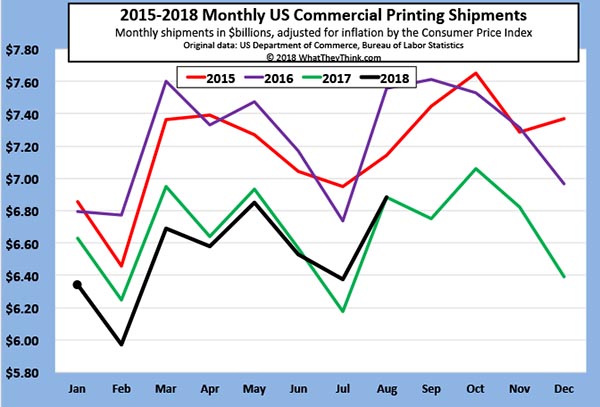
Dead Heat: August 2018 Printing Shipments
Published: October 12, 2018
Printing shipments for August 2018 came in at $6.89 billion. That’s essentially even with August 2017’s $6.88 billion on an inflation-adjusted basis. Full Analysis
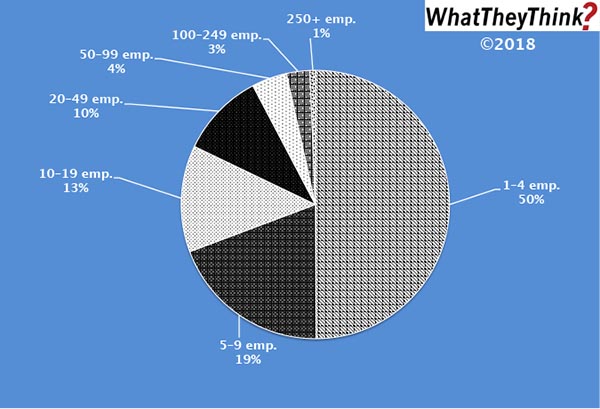
Commercial Printers—2016
Published: October 5, 2018
In 2016, there were 18,405 total commercial printing establishments (excluding screen and book printers). Half of them have fewer than 5 employees. Full Analysis
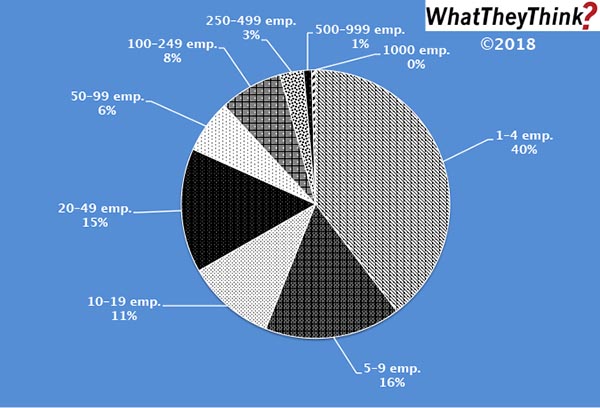
Book Printers—2016
Published: September 28, 2018
In 2016, there were 421 total book printing establishments. The majority have under 10 employees. This is similar to what we find in general commercial printing—yet different. Full Analysis
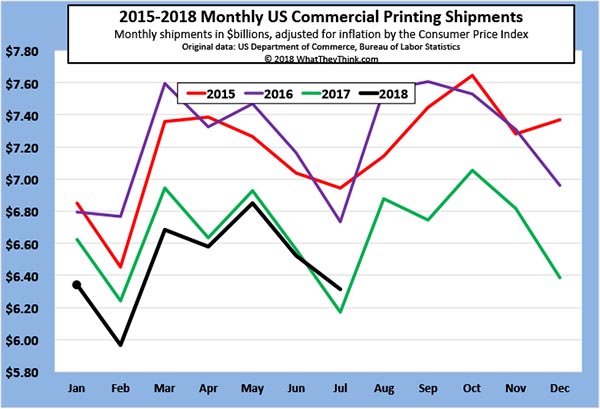
July 2018 Printing Shipments: We Have Some Good News and Some Bad News
Published: September 21, 2018
Printing shipments for July 2018 came in at $6.31 billion—that’s down -3.4% from June, but it’s up +2.3% from July 2017. We’ll take whatever victories we can. Full Analysis
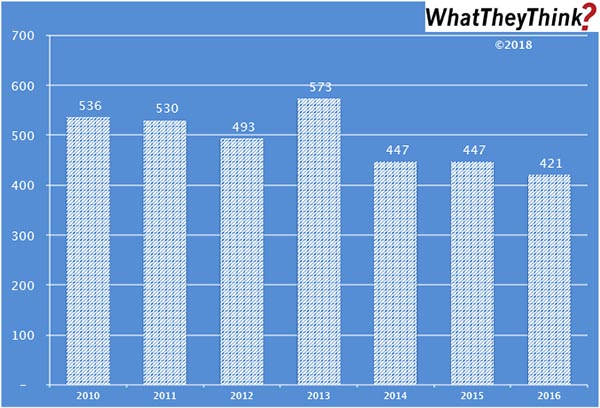
Book Printers—2010–2016
Published: September 14, 2018
In 2010, there were 536 book printing establishments. In the ensuing six years, the establishment count would drop -21%. So says our Commercial Printing Establishments tracker. Full Analysis
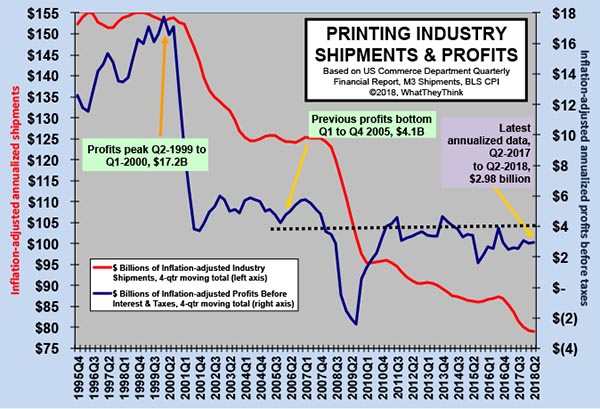
Words of the Profits
Published: September 7, 2018
Looking at the most recent industry profits data that came out earlier this week, we continue to tell the “tale of two cities.” Low profitability of large printers is dragging down average industry profitability. For the industry as a whole, cracking—or re-cracking—$4 billion in profits is proving to be an elusive goal. Full Analysis
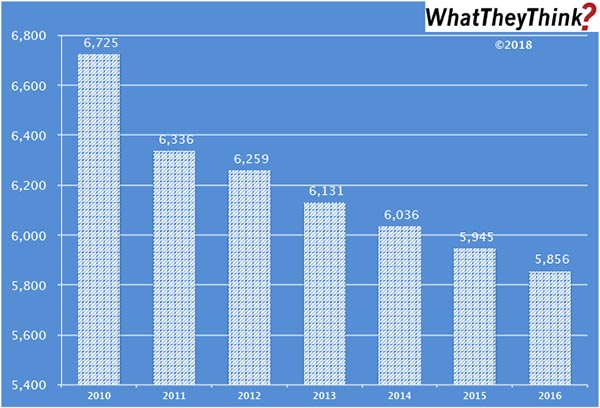
Mid-Size Establishments—2010–2016
Published: August 31, 2018
In 2010, there were 6,725 10–19-employee commercial printing establishments. Among this demographic category, there was the most precipitous drop from 2010 to 2011—the fallout from the Great Recession which started to take its toll after 2009. By 2012, the bleeding had been largely stanched, and the year-to-year declines were more modest. So says our recently launched Commercial Printing Establishments tracker. Full Analysis
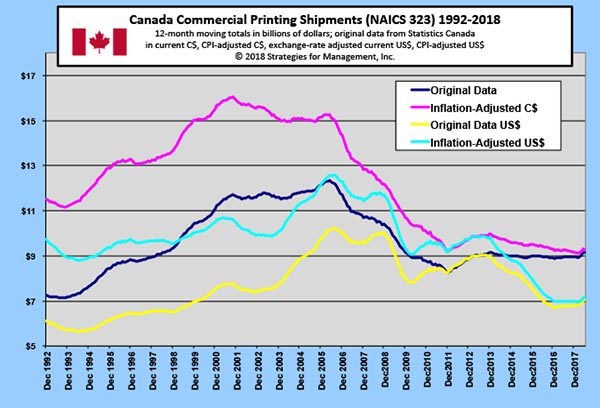
Canadian Printing Shipments
Published: August 24, 2018
Looking at the 12-month moving average of Canada’s printing shipments, it may look like Canada’s printing industry has been holding steady, but the inflation-adjusted figures show a slight decline from a recent peak at the end of 2013. Full Analysis
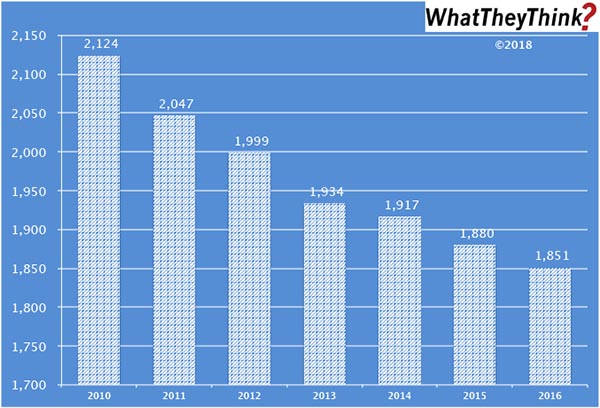
Consolidation Among Large Print Businesses: 2010–2016
Published: August 17, 2018
In 2010, there were 2,124 establishments having 50 or more employees. By 2016, they had dropped to 1,851 (down -13%). So says our new Commercial Printing Establishments tracker, based on data from the Census Bureau’s County Business Patterns, which presents—in spreadsheet form—U.S. commercial printing establishments from 2010 to 2016, broken down by six different print business classifications and nine employee-size breakdowns. Full Analysis
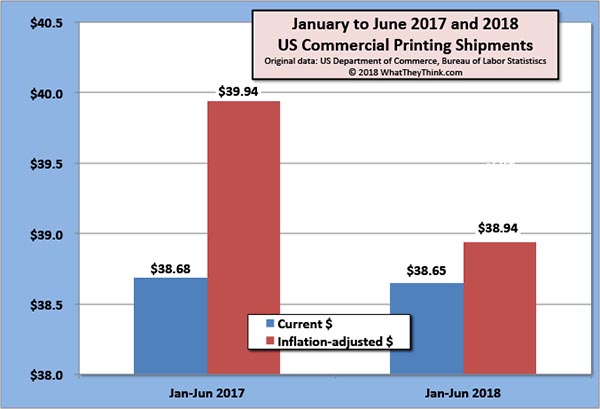
Printing Shipments Head Into the Dog Days of Summer
Published: August 10, 2018
The inflation-adjusted value of printing shipments for June 2018 were down from $6.9 billion in May to $6.5 billion in June. On the plus side, it’s not appreciably below the $6.6 billion reported in June 2017. Full Analysis
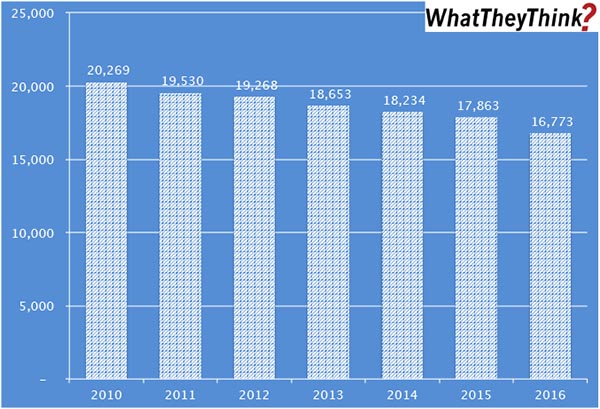
WhatTheyThink Launches New Industry Establishment Data Series
Published: August 3, 2018
Our new Commercial Printing Establishments tracker, based on data from the Census Bureau’s County Business Patterns, presents—in spreadsheet form—U.S. commercial printing establishments from 2010 to 2016, broken down by six different print business classifications and nine employee-size breakdowns. Full Analysis

June Printing Employment Down Y/Y
Published: July 27, 2018
Overall, printing employment ticked up from May to June 2018, but on a year-over-year basis is down -1.8% from June 2017. Among the creative markets, PR is the place to be. Full Analysis
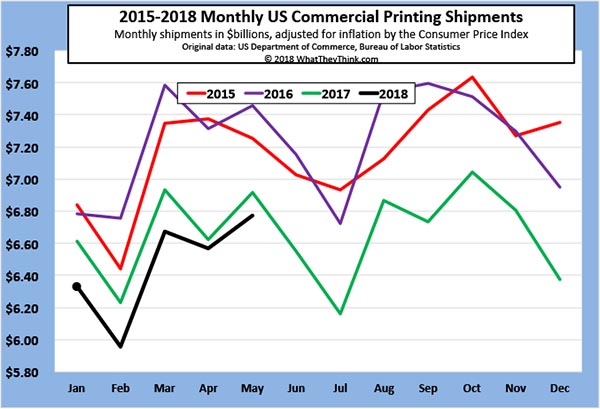
May Printing Shipments Up from April, Closing in on 2017 Levels
Published: July 13, 2018
Printing shipments for May 2018 came in at $6.77 billion, up +3.1% from April. However, on an inflation-adjusted basis, May 2018 came in below the $6.92 billion reported in May 2017, and is well below the recent high of $7.46 billion back in May 2016. Full Analysis
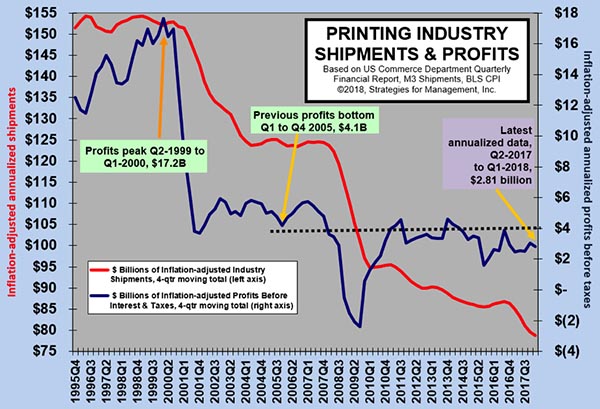
Big Printers' Writedowns and Interest Payments Are a Big Drag on Printing Industry Profits
Published: June 22, 2018
Writedowns in the first quarter of 2018 for commercial printers with $25 million or more in assets were $157 million, or 1.9% of sales. The assets may be written down, but the borrowing that was created to finance them remains. Interest expense was 4.8% of sales. For the quarter, losses were -1.47% of sales. That rate of loss made average profits before taxes for the industry a mediocre 3% of sales—which means that printers with less than $25 million in assets must have done well. Full Analysis
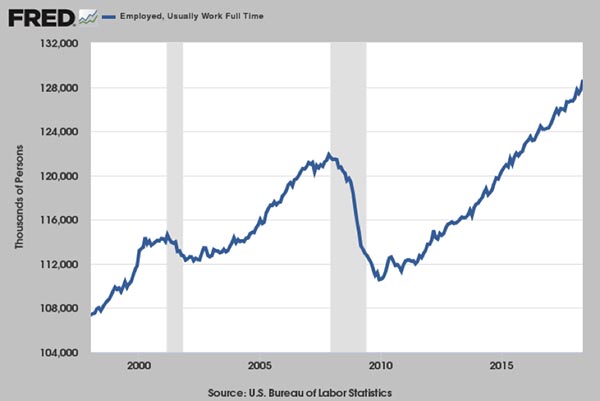
Full-Time Employment, Sets New Record, Up +904,000, But Does It Really Feel that Good?
Published: June 8, 2018
The May employment report was regarded as good, but when you dig past the top-level numbers, it was better than it looked. However, while the 3.8% unemployment rate looks good on the surface, it really can’t be compared to when it was last attained nearly 20 years ago. So many workers left the workforce that this figure implies a tighter labor than it really is. We will really know we have a strong economy when the active labor force starts increasing. Full Analysis
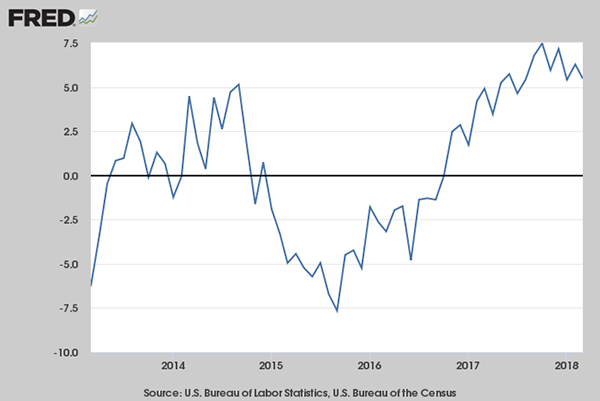
Consumer Durable Goods Orders Moving at Almost 2X GDP Rate
Published: May 18, 2018
Durable goods orders for consumers (less transportation) are growing at a rate almost two times faster than Real GDP. This data series remains -14% below where it was at the start of the recession in December 2017, and is a critical one to monitor for indications of an improved economy. Full Analysis
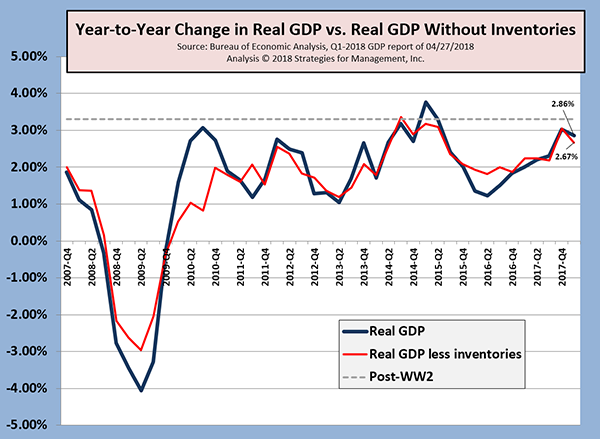
Q1-2018 Rises +2.3%, Slower Rate than Q4-2017
Published: May 11, 2018
The Bureau of Economic Analysis’ advance report estimated that Q1-2018 real gross domestic product was up at an annual rate of +2.3%, which was slower than the +2.9% for Q4-2017. Because companies and individuals, especially corporations, shifted expenses into 2017 and delayed revenue recognition to 2018 to take advantage of the rates in the new tax law, many key economic data series—such as this one—will be subject to larger than usual revision. Full Analysis
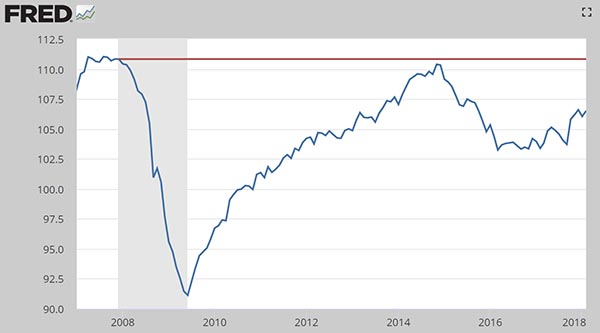
Federal Reserve Updates Industrial Production Data Series
Published: April 13, 2018
The Federal Reserve revised 2015–2017 industrial production down from its original reports, meaning that industrial production peaked in 2014 and then slowed. The initial data made things seem better than what consumers and employees were actually experiencing. Full Analysis
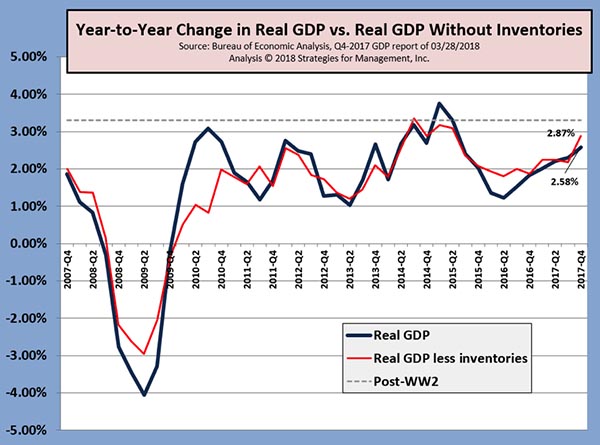
Q4-2017 GDP Revisions Stronger than Earlier Reports
Published: April 6, 2018
Q4-2017 GDP estimates were raised to +2.9% from the original estimate of +2.5%. (But beware inventories.) At the same time, shenanigans resulting from the latest tax bill are blurring statistics visibility, especially where corporate profits are concerned. Full Analysis
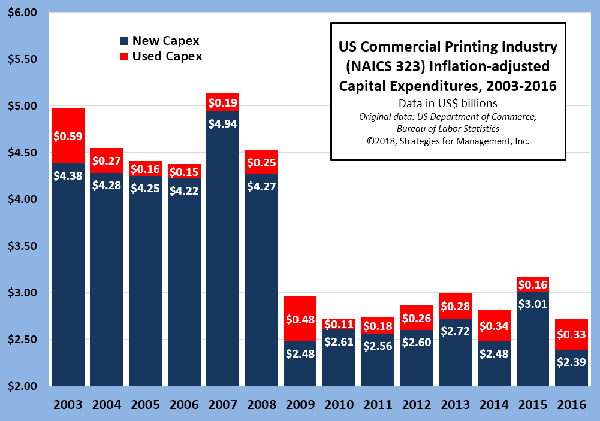
US Commercial Printing Capital Expenditures
Published: March 9, 2018
The capital expenditures of commercial printers fell in 2016, but the investment in less expensive used equipment may have been a major factor. Full Analysis
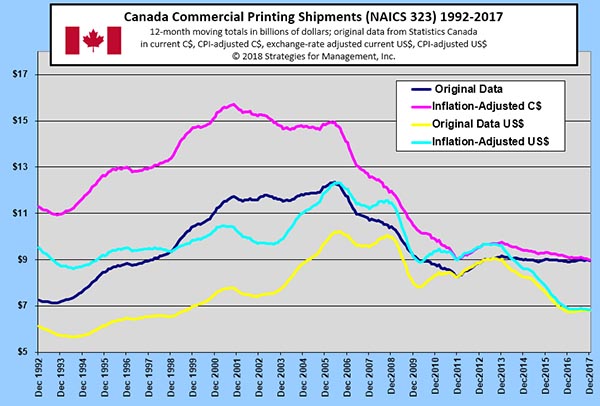
Canada’s Commercial Printing Shipments 1992-2017
Published: March 2, 2018
Canada’s printing industry has been holding steady compared to the US, despite being subject to the same competition from digital media Full Analysis
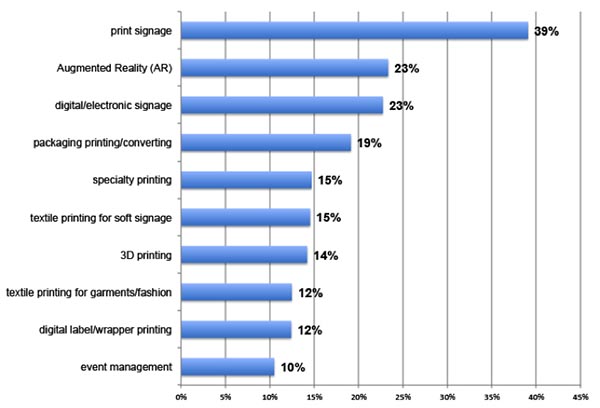
Print Business Outlook Survey: Areas of interest in new print-related applications
Published: February 28, 2018
WhatTheyThink surveyed printing business owners and executives: "What are your areas of interest in new print-related applications." Full Analysis
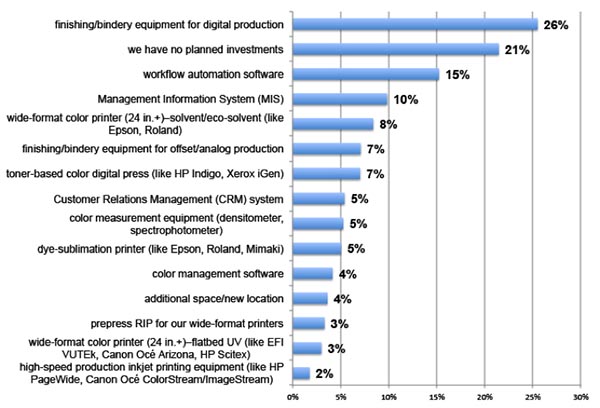
Print Business Outlook Survey: Which of the following investment items have you budgeted for and plan to acquire in the next 12 months?
Published: February 20, 2018
WhatTheyThink surveyed printing business owners and executives: "Which of the following investment items have you budgeted for and plan to acquire in the next 12 months?" Full Analysis
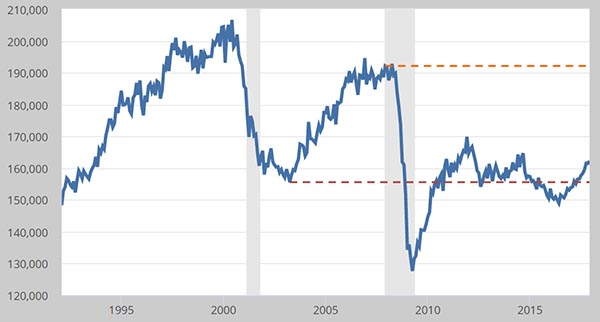
Consumer Durable Goods Still Struggle to Reach Recession Levels
Published: February 16, 2018
CPI-adjusted consumer durable goods manufacturing remains well below its pre-recession level—one of the reasons that GDP has been so lackluster. Full Analysis
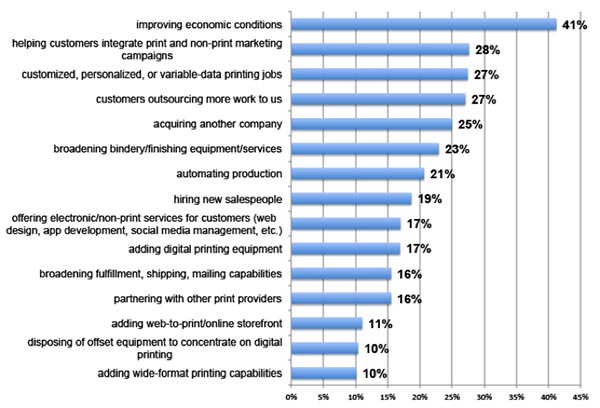
Print Business Outlook Survey: In the next 12 months, which of the following will be your biggest business opportunities?
Published: February 15, 2018
WhatTheyThink surveyed printing business owners and executives: "In the next 12 months, which of the following will be your biggest business opportunities?" Full Analysis
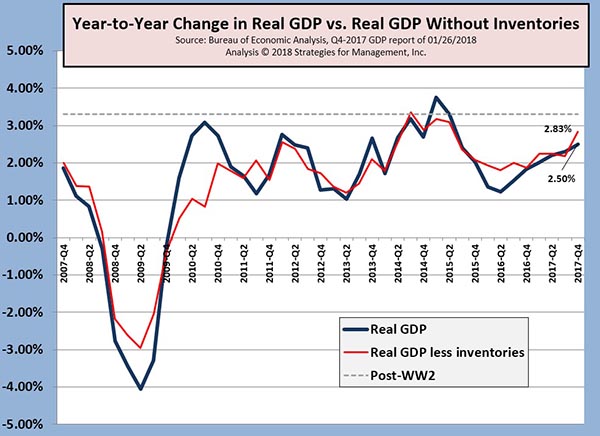
Q4-2018 GDP +2.6%, But +3.2% Excluding Inventory Effects
Published: February 9, 2018
The first report of fourth quarter GDP was a disappointing +2.6%. Sources such as the Atlanta Federal Reserve’s GDPNow and the New York Fed’s Nowcast were for a stronger reading. Inventories are a major factor in the volatility of GDP data, and excluding that data, the economy neared those estimates, producing a much better +3.2% rate compared to Q3. Full Analysis
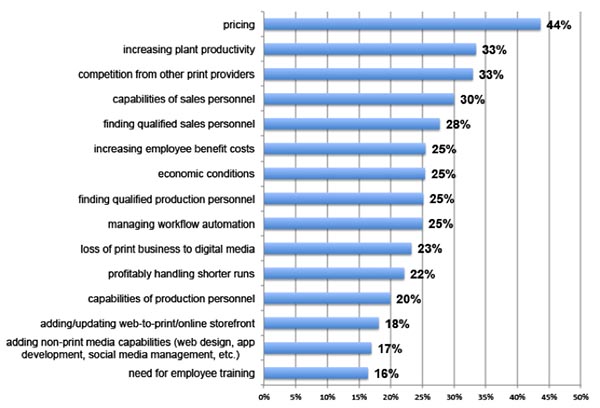
Print Business Outlook Survey: In the next 12 months, which of the following will be your biggest business challenges?
Published: February 5, 2018
WhatTheyThink surveyed printing business owners and executives: "In the next 12 months, which of the following will be your biggest business challenges?" Full Analysis
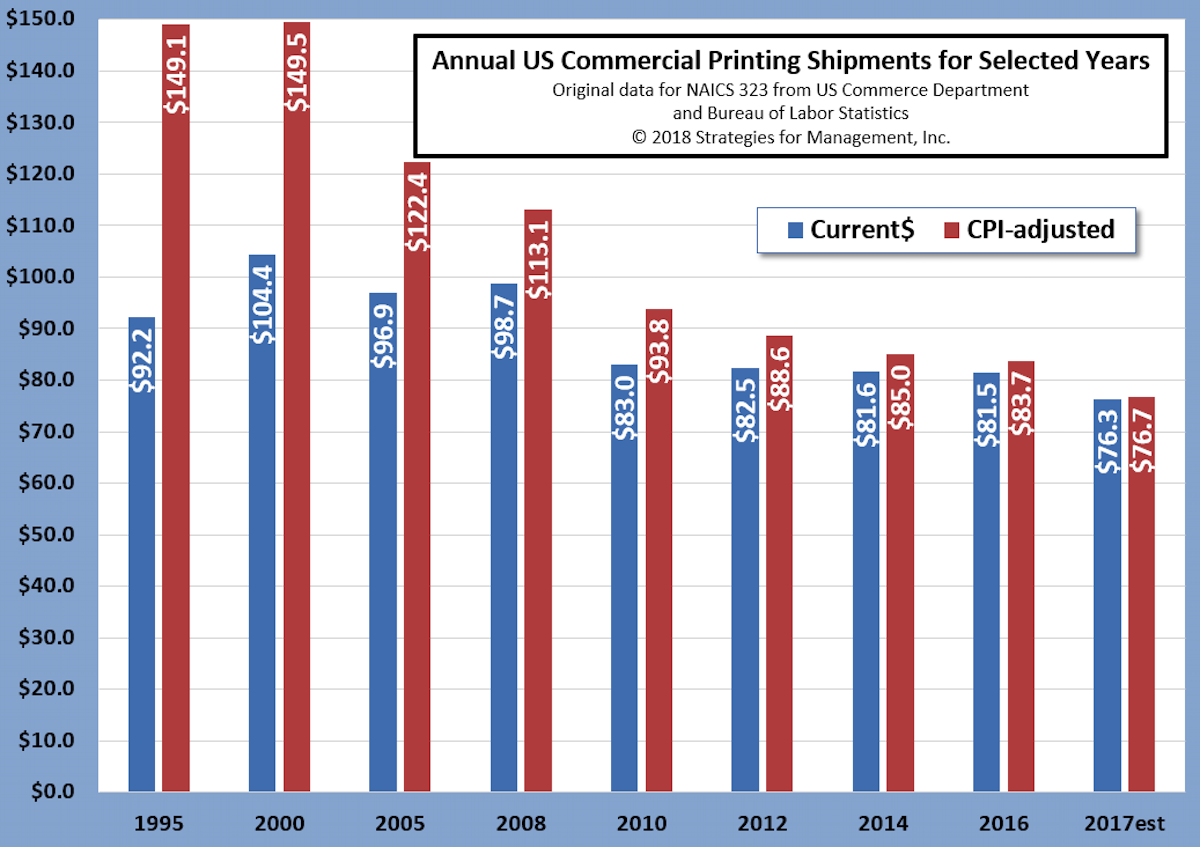
2017 NAICS 323 US Commercial Printing Industry Shipments
Published: February 2, 2018
The US Commerce Department has released data for November 2017, and this is the first look at the full year by making an estimate for December. Based on shipment and employment trends, it appears that 2017 came in at $76.3 in current dollars. That's a -6.4% decrease in current dollars compared to 2016, and a -8.4% decrease on an inflation-adjusted basis. The chart includes selected prior years starting at 1995. December data will be released at the beginning of February, and will be revised in March. In May, the Commerce Department will revise the last three years of data, plus minor revisions to the years prior to that. Full Analysis
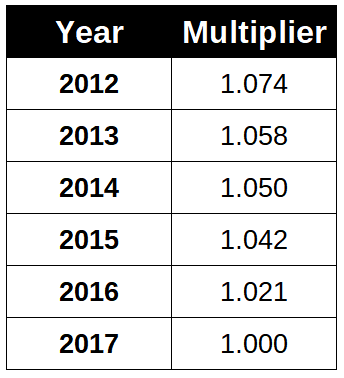
Latest Inflation Adjustment Multipliers
Published: January 29, 2018
Inflation distorts our interpretation of history and clouds business decisions. All dollars may look alike, but what a dollar bought in 1950 is a lot different than a dollar in 2017. Unfortunately, commercial printing prices have not kept up with inflation, but the costs of running a printing business usually have. This means that it's harder to keep earnings and payrolls up to this level. If past dollars had greater value, this chart can be used to adjust past financial statements to bring those data to current value. This is especially important in budgeting processes where looking for trends in prior years is one way of assessing performance and goals. Full Analysis
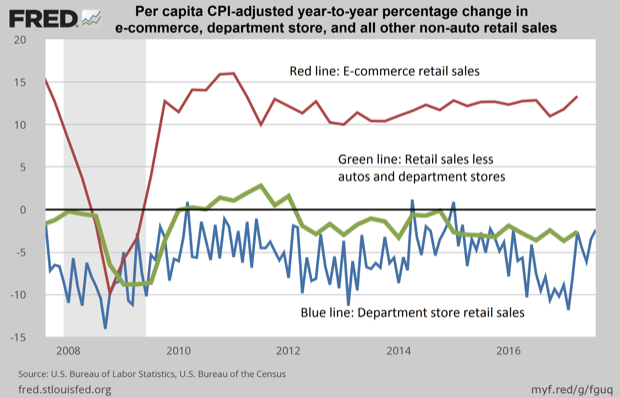
E-commerce is the only reason retail is growing
Published: October 5, 2017
Inflation and population changes often distort the analysis of economic trends. This chart shows the changing nature of retail sales on a per capita (per person) and inflation-adjusted (using the Consumer Price Index) basis by the percentage change compared to the same period of the prior year. Full Analysis
Dr. Joe's Key Recovery Indicators
Published: September 11, 2017
The recovery indicators (when we started these we thought they’d be around for about a year or so) had four of its six factors turn negative, with one of those falling back to its recession level of December 2007. Yes, that’s when the recession started. That long ago. Full Analysis
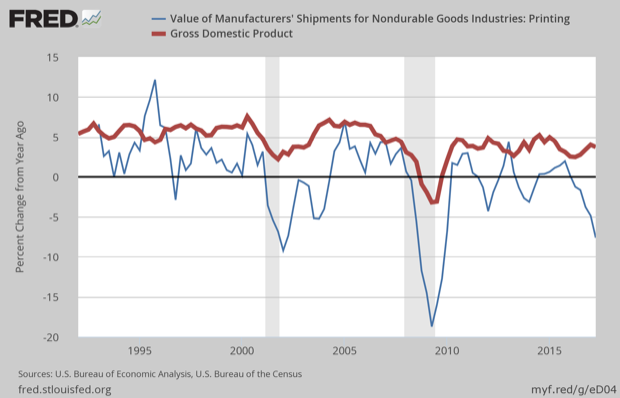
Updated Commercial Printing and New GDP Data
Published: August 17, 2017
The Bureau of Economic Analysis released the Q2-2017 GDP data and revisions to historical data beginning with 2014. Back in mid-May, the Commerce Department updated historical commercial printing shipments (NAICS 323) as part of its manufacturing shipments revisions. This week’s chart shows an updated view of both data series in current dollars (sometimes called “nominal;” both terms mean that data are not adjusted for inflation). The red line is year-to-year growth rate in GDP, and the blue line is year-to-year change in quarterly shipments. Since around 1997 printing shipments have not met GDP growth except for a moment between 2010 and 2015. The most recent printing shipments trend at the right of the chart are remarkable for their direction. A discussion of the GDP revisions and the current status of printing shipments can be found in the column of August 7.
Full Analysis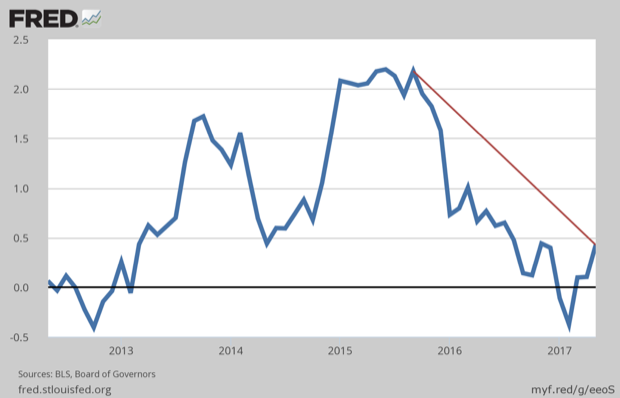
Did You Know Interest Rates Have Been Falling?
Published: July 6, 2017
The Fed has been so reticent about raising rates, and in the process, rates for the 10-year US Treasury actually were negative in February. No, that’s not market rates, that’s the 10-year rate less the year-to-year Consumer Price Index. Since that time, the rate calculated in this manner has moved up 80 basis points. The rate peaked in September 2015 and it’s been down since then. The Fed is having problems making the decision to raise rates, and often announced more rates in a future period but increasing rates at a slower pace. They have a target inflation rate of 2% (which means you lose about 25% of your savings over 10 years on a compounded basis). If you believe that the inflation rate is calculated in a manner that makes it seem lower than it actually is, then the Fed’s desire to see inflation at the 2% rate before they start pushing interest rates higher may be be difficult to reach or sustain. That means long term rates will stay artificially low (on purpose) for a longer period of time than most experts expect. Full Analysis
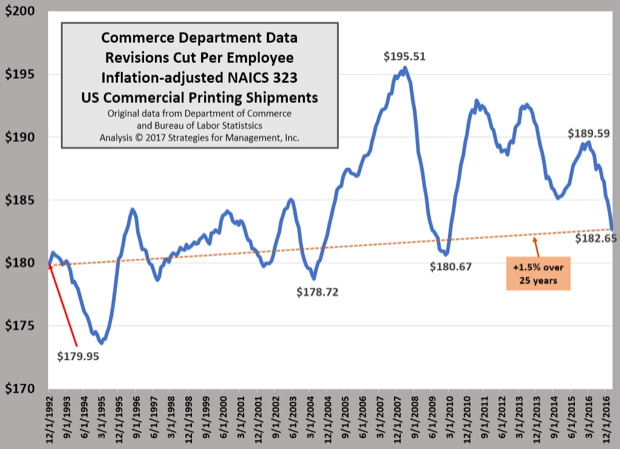
Inflation-adjusted Shipments per Employee
Published: May 25, 2017
The Commerce Department’s revisions to industry shipments show a much different picture of a key metric for the industry, sales per employee. The chart was created using 12-month moving totals of inflation-adjusted shipments and the 12 month moving average of total industry employment. The latest reading through March 2017 is $182.65 per employee, a meager +1.5% higher than it was at the end of 1992. It fell from a peak of $195.51 which was just before the burst of the housing bubble, the rise of social media platforms, tablets, and smartphones. The fall in this calculation has some interesting characteristics. Historically, large printing businesses focused on magazines, catalogs, and newspaper inserts, had sales per employee that were significantly higher than the industry averages, anywhere from 30% to 50% higher. Full Analysis
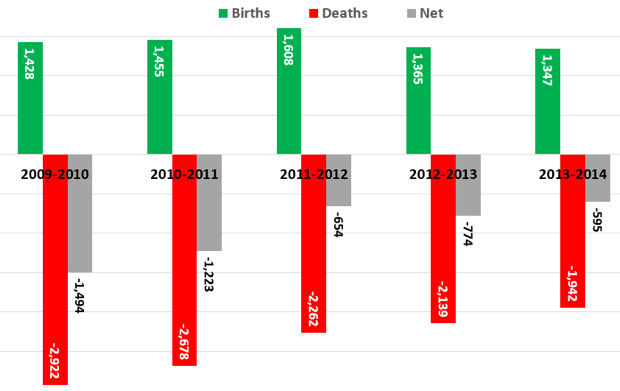
Births and Deaths of Commercial Printing Establishments, 2010 to 2014
Published: May 11, 2017
The Commerce Department tracks the number of business establishments by industry, and among he more interesting reports is the calculation of new and closed businesses. The data take a while to be released, and these new data about 2014 were recently made available. There’s a word of caution here. If someone was a corporation and decides to become a partnership or a proprietorship, that counts as one business closed and one business opened. And then there’s “poor man’s mergers” where two business owners decide to close their two businesses and open one new one. Same people, same equipment, no real change except to the tax authorities and government statisticians. The most important number is the net change of births less deaths. In the worst of the recession, the net number was 6% of establishments. For 2014, that had fallen to a little more than 2%. Full Analysis
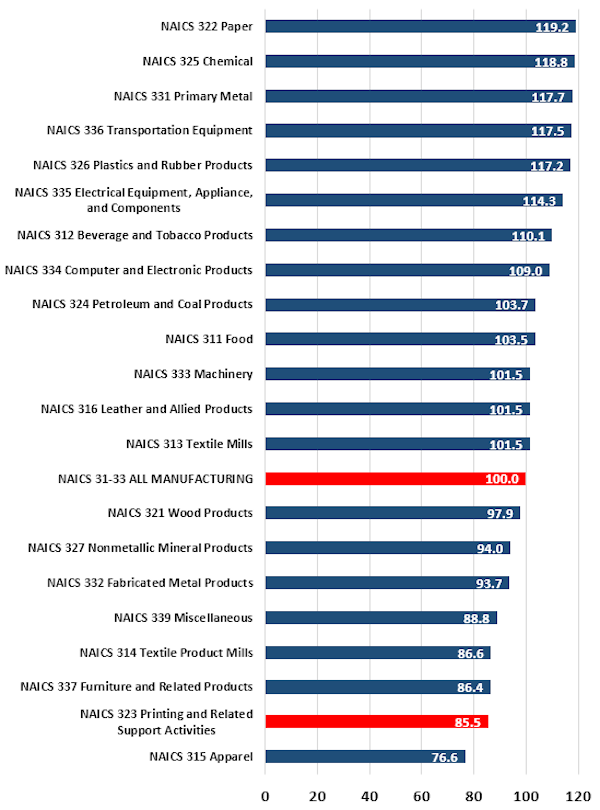
Printing Industry Lags Other Manufacturers in Defined Management Processes
Published: April 27, 2017
In what is not a surprise to many, the job shop operational structure of many printing businesses put the industry near the bottom of all manufacturing industries in terms of its management processes. Full Analysis
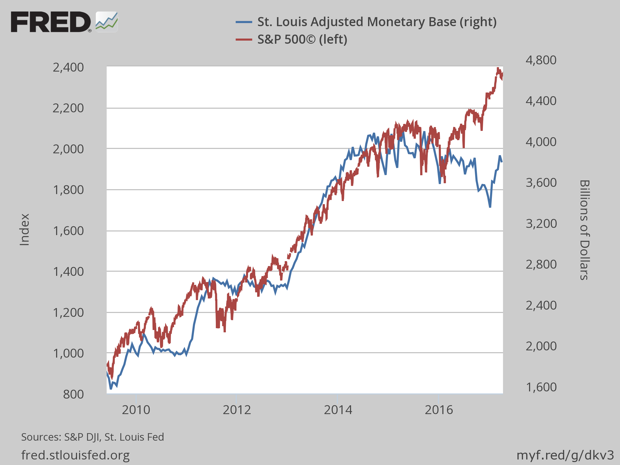
The Fed’s Balance Sheet and the S&P 500
Published: April 13, 2017
The financial markets were rattled a little bit by the recent minutes of the Fed meeting where they discussed the unwinding of their interventions and the ballooning of their balance sheet. The data are reflected in the St. Louis Fed Adjusted Monetary Base. The chart shows how the run-up in the S&P 500 stock index relates to the Fed’s quantitative easings Full Analysis
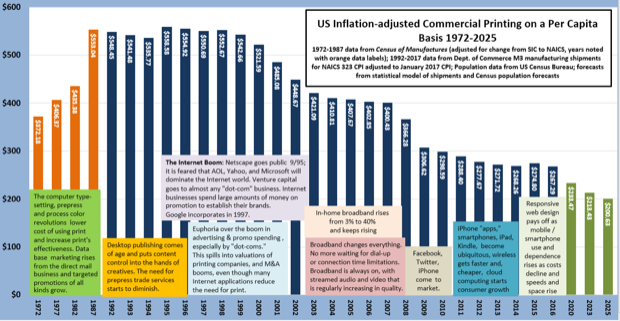
US Commercial Printing Shipments on a Per Capita Basis
Published: March 30, 2017
Yes, that sounds boring, but the data have been made interesting by including details about the last forty years or so of industry history and technological change. We added some statistical forecasts from our models that take the data out to 2025. When we started this chart almost ten years ago, those outlying years were near zero. They’re not any more (whew!). The data are inflation adjusted and based on the population data and forecasts of the US Census Bureau. It’s interesting how there are periods of relative stability, a change, followed by another period of stability. Technological change has been a much bigger factor affecting consumption than general economic conditions. Full Analysis
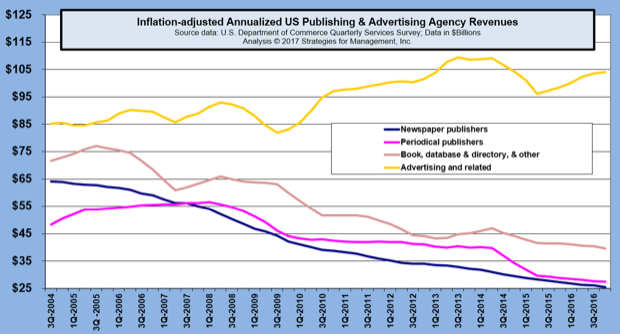
Ad Agency and Publisher Revenues
Published: March 23, 2017
Advertising agency revenues are having a slow rebound from their pullback in 2015. Publisher revenues are still having problems as ad pages and circulation are contracting. Clearly, agencies are finding other areas to garner revenues, especially in managing digital initiatives. Mobile communications are where their latest opportunities are, especially with website redesigns, creating the look and feel of content marketing for their clients, and assisting clients as they sort through the analytics that marketing automation offers. Full Analysis
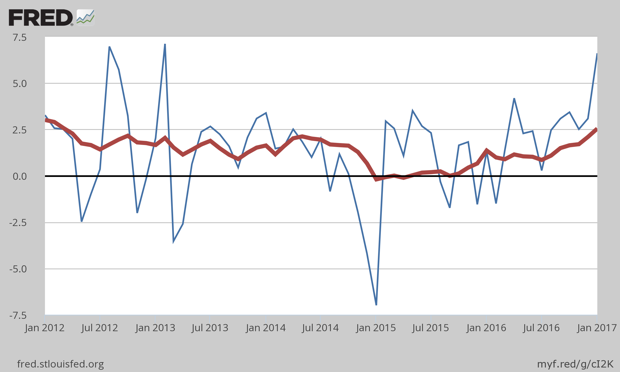
Consumer Inflation for 2016 at +2.5%, Giving Fed Reason to Increase Rates
Published: February 23, 2017
Consumer inflation for 2016 was increasing, with December’s reading +2.5% higher than 2015. December’s rate alone was at a +6.6% annualized rate. The chart shows the monthly comparisons as the blue line and the year-to-year comparisons as the heavier red line. Full Analysis
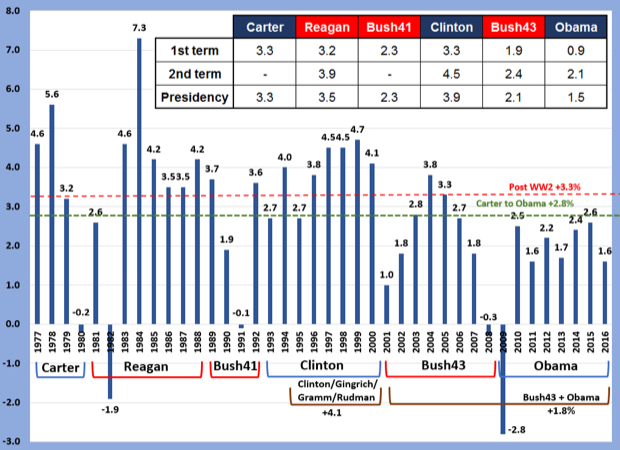
Employment Stalls; Printing Shipments Fall Sharply in December
Published: February 6, 2017
The national employment data may have had a headline of +227,000 payroll jobs, but the household survey did not indicate the same. Every year, the report released in February includes revisions to the prior year. The press release from the Bureau of Labor Statistics said that employment was “little changed.” Full Analysis
4Q-2016 GDP Slows to +1.9%, +0.9% Less Inventory Build-Up
Published: January 30, 2017
The fourth quarter of 2016 ended quiently, with a growth rate of +1.9% compared to the third quarter. That brought 2016 to an overall growth rate of +1.6%. Full Analysis
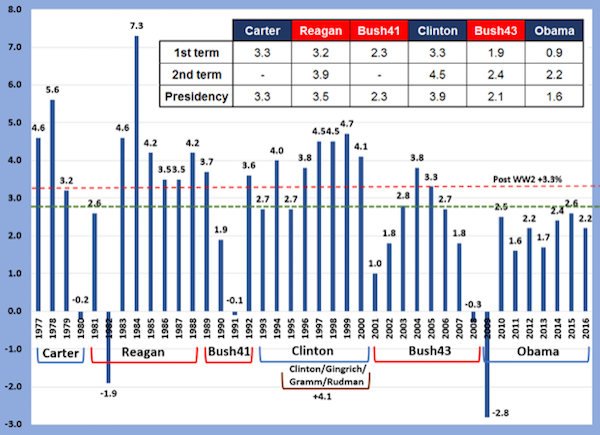
Real GDP for Six Presidential Administrations
Published: January 26, 2017
A new administration is in Washington, so we created a chart that looks back at general economic conditions of the prior six administrations. Full Analysis
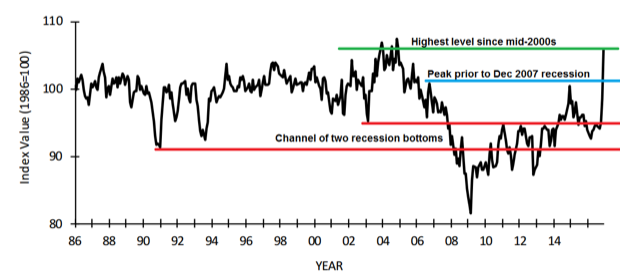
Small Business Index Rockets Up to Mid-2000s Level
Published: January 12, 2017
The NFIB's small business index came in at 105.8. It has had two months near-vertical increase, now at levels not seen since December 2004 when it was 106.1. It's sheer optimism that small business concerns about taxes, regulation, and the economy will improve. There are many reports about improved confidence, especially among consumers, but it seems like it's too much too soon. While the new administration might be able to provide some regulatory relief in its early days, most of its desired actions require acts of Congress. Those can sometimes take forever... or longer. Full Analysis
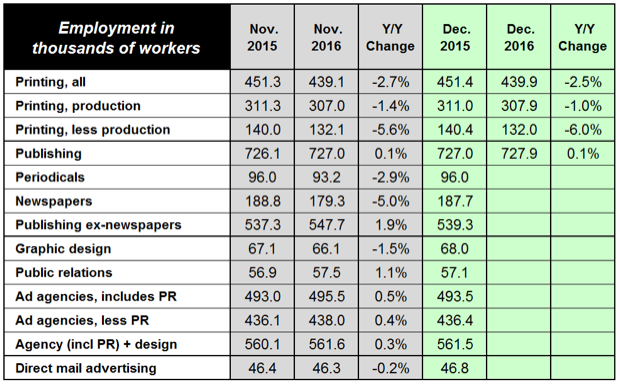
US Commercial Printing Industry Employment Finishes -2.5%; Consolidation Effects Evident
Published: January 11, 2017
The US commercial printing industry finished the year with 439,900 employees, down -11,200 compared to 2015. The number of production employees was down -3,100, a -1.0% decrease. Non-production employees represented the biggest change, down -8,400 (-6.0%). Full Analysis
Recovery Indicators January 2017
Published: January 9, 2017
With the Dow Jones and S&P 500 at all-time inflation-adjusted highs. The recovery indicators are stronger than they have been in a while, with very bullish increases in new orders for manufacturing and non-manufacturing sectors, and a strong reading of the NASDAQ stock index. Full Analysis
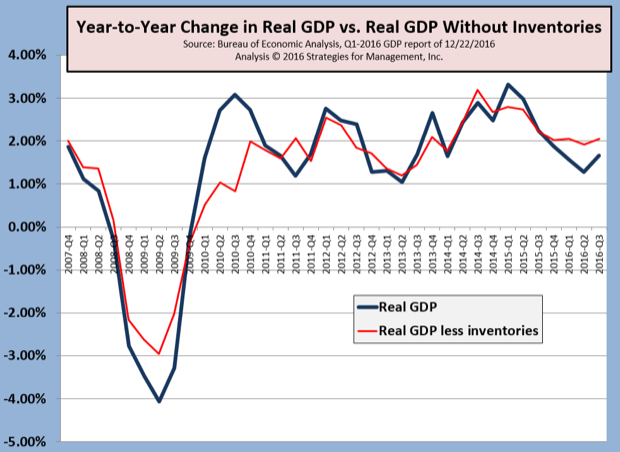
3Q-2016 Real GDP Revised Up Again; Did US Just Emerge from an Unrecognized Recession?
Published: December 22, 2016
The Bureau of Economic Analysis released its third report of real Gross Domestic Product, at an annualized +3.5% over the second quarter. This is considered the final report, revising the advance report of +2.9% two months ago, and +3.2% in last month's preliminary report. This is important because each release of GDP data is based on increasing amounts of actual reported data. The advance report relies the most on estimates and models. Full Analysis
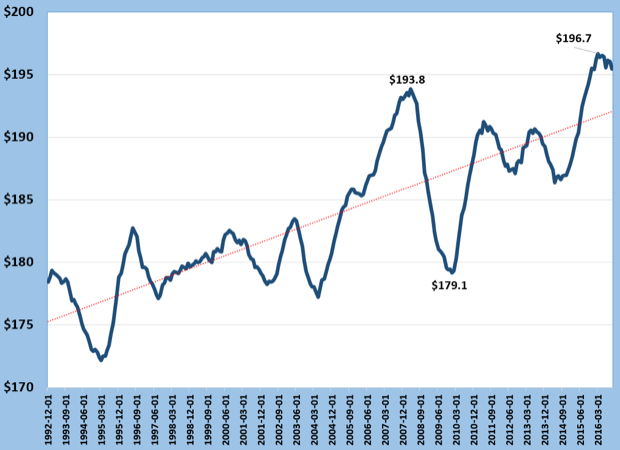
Commercial Printing Inflation-Adjusted Shipments Per Employee
Published: December 16, 2016
The effects of consolidation, a challenging pricing environment, cost controls and productivity measures have sent shipments per employee to unprecendented levels. The prior peak was just before the recession began. The industry is more efficient in many ways, especially with the exit of weak and marginal establishments. But is it more profitable? In the December 15 webinar and in the new Forecast 2017 report, industry profit levels are discussed. Despite reaching new levels of sales per employee, profit levels have become tepid, a sign of tightening market conditions. In the webinar we discussed the possibility that another wave of media change is underway. The last major one was the rise of social media ten years ago, and now the growing impact of mobile media, especially this year. Full Analysis
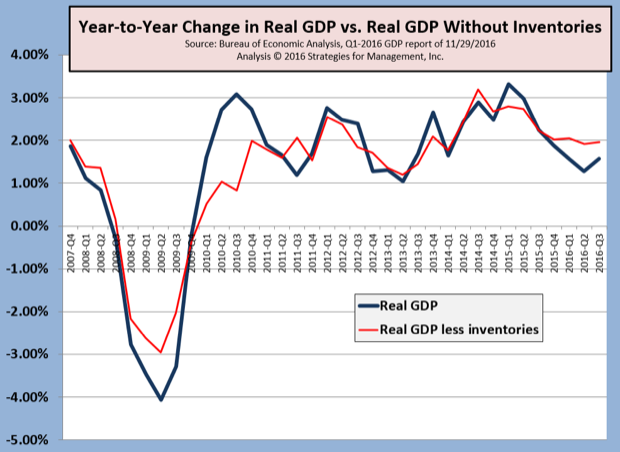
Q3-2016 Real GDP Revised Up from +2.9% to +3.2%; Little Change in Yearly Comparison
Published: December 1, 2016
The Bureau of Economic Analysis issued its second estimate of real gross domestic product, raising it to +3.2%. Real GDP for 2Q-2016 was +1.4%. Each advance release of GDP data is revised monthly as “more complete source data” is used rather than estimates. We prefer comparing GDP data to the same quarter as the prior year, which helps minimize the variation and possible distortions of seasonal adjustments. Compared to last year, Q3-2016 was +1.6%. Because inventory changes can distort GDP estimates, we also look at the data less inventories, and it shows the economy still hovering around a +2.0% growth rate. Lately, the inventory adjustments have been small. Theoretically, they should be zero in the long run, and for these last two quarters that has nearly been the case. In 2015, it averaged +$82 billion per quarter. Some of 2016's sluggish performance has been an inventory adjustment in the overall economy. The Atlanta Fed's GDPNow estimate for the current Q4 is running at +2.4%. Full Analysis
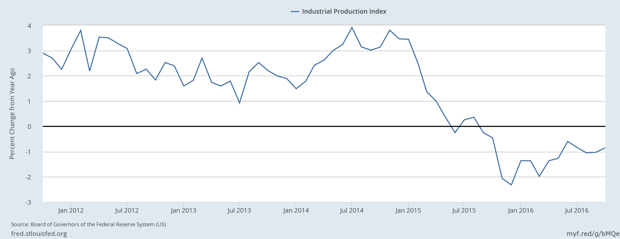
Fed's Industrial Production Index Down for 13 Consecutive Months: A Recession on Inauguration Day?
Published: November 17, 2016
Will the newly inaugurated President Trump be dealing with a recession like his predecessor did? In December 2008, a recession was declared, and the experts said it started almost a year before then. Several economic indicators, like durable goods orders and factory orders, have been negative compared to the prior year's level for almost two years. The Federal Reserve's Industrial Production Index released on November 16 marked its thirteenth consecutive negative comparison to the prior year. The only sector that is holding up in the GDP reports is the consumer side of that bookkeeping. That can't hold up for long unless the production and investment side of the GDP ledgers start to perk up. There is optimism in the markets about a Trump recovery, but it must be noted that there are many legislative hurdles ahead, and most economic plans take about 18 months to develop notable impact. Full Analysis
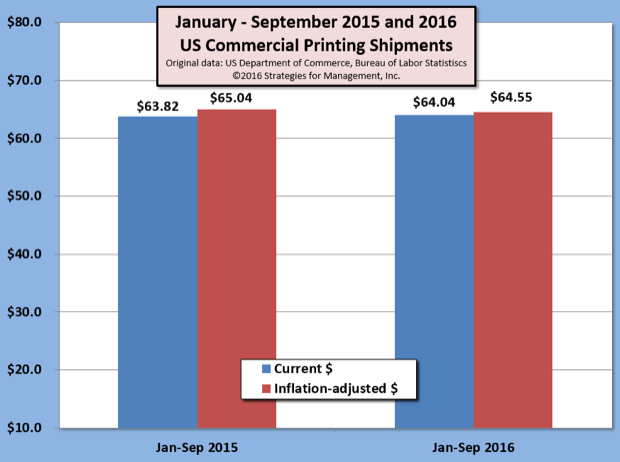
US Commercial Printing Shipments in Mild Downturn; Employment Consolidation Continues
Published: November 7, 2016
US commercial printing shipments for September 2016 were down -$8 million compared to the prior year (-0.1%). On an inflation-adjusted basis, shipments were down by -$118 million. Interestingly, inflation-adjusted August shipments were up by +$118 million, making the net change for the two months zero. Full Analysis
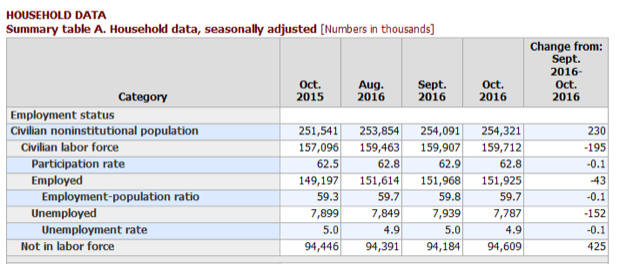
US Employments Report: Not What the Headlines Said
Published: November 7, 2016
The business headlines about the October employment report may have said “unemployment rate falls to 4.9%; payrolls grow +161,000,” but the details of the overall employment picture deteriorated. Full Analysis
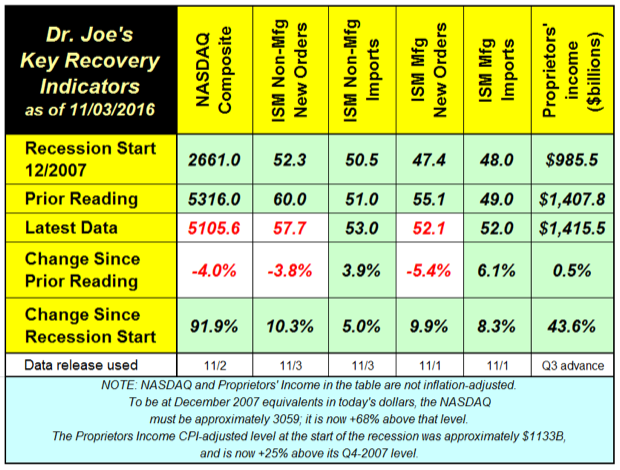
Recovery Indicators Mixed Again
Published: November 4, 2016
Last month's recovery indicators bounced back big from a dreadful report, but this month's have moderated. The ISM manufacturing and non-manufacturing new orders decreased, but they are still above the 50 breakeven level, showing growth. The non-manufacturing side is still strongly on the growth side of the line. Full Analysis
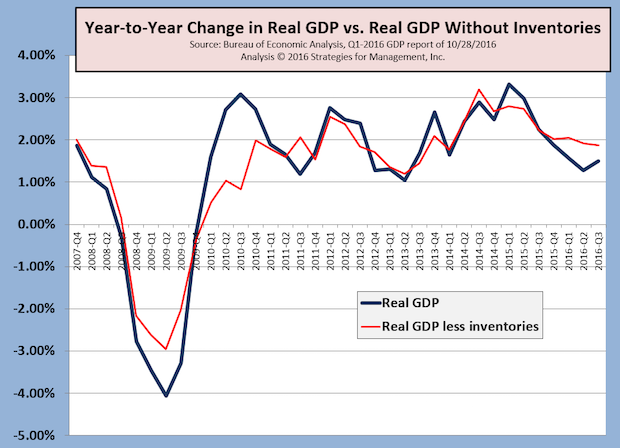
Q3 Real GDP +2.9%; Soybeans Lead the Charge?
Published: November 1, 2016
Prior to the release of Q3's advance estimate of real GDP, the Atlanta Fed's GDPNow forecast was +2.1%. The official figure came in much better, at +2.9%. It is likely to be revised down slightly, but it was a much better showing than recent data. Full Analysis
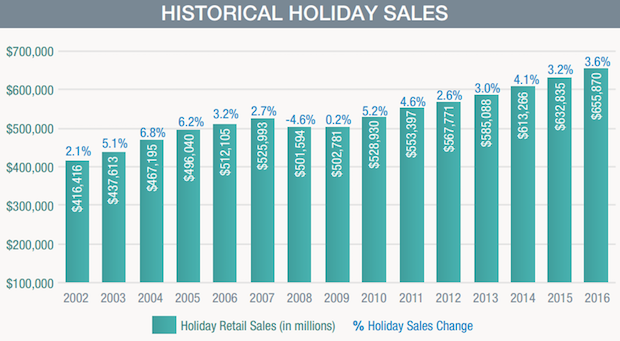
National Retail Federation Forecasts +3.6% in Holiday Retail Sales
Published: October 29, 2016
The National Retail Federation issued its forecast of holiday retail sales. It expects a +3.6% increase compared to 2015. But what's the real increase? After deducting for inflation, that's about +1.5%. If real GDP comes in at +2% in the October 28, 2016 advance report for Q3, holiday retail sales growth will be in line with the growth rate of +1.4% for the year. In some ways, this can be a good year compared to recent history. Holiday retail sales have averaged +2.46% since 2007, with a net after inflation of only +0.64%. On a per person basis, that's actually a decline in that period. Full Analysis
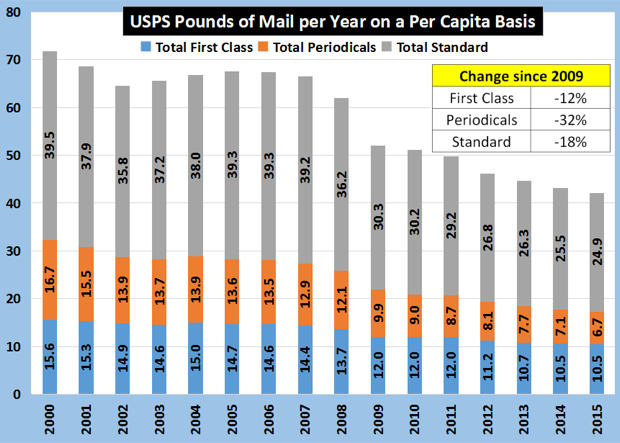
Per Capita Pounds of Mail
Published: October 13, 2016
Since the beginning of the economic recovery in 2009, first class mail is down by -12%, standard mail (discounted bulk mail) down by -18%, and periodicals down a whopping -32%. Full Analysis
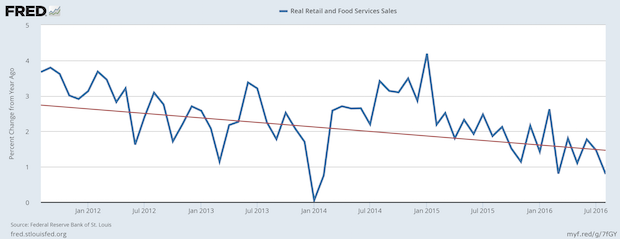
Manufacturing May Be Declining, but Real Retail Sales are Still Positive
Published: September 22, 2016
Data about manufacturing from the ISM and the Commerce Department have show a contraction compared to the prior year. In some cases that slowdown and contraction has been in process for 18 or more months. Retail sales and consumer spending have been the brighter spots of the economy. The inflation-adjusted growth rate of retail sales has been slowing since the beginning of 2015. Full Analysis
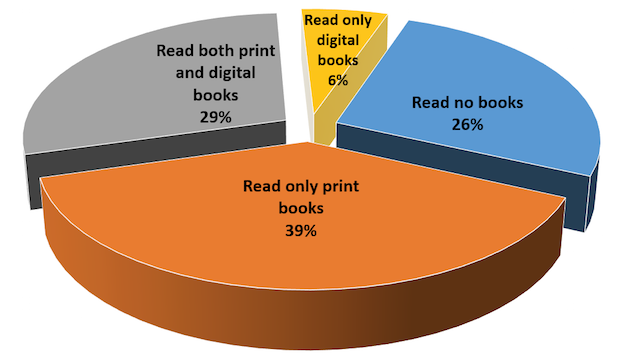
Pew Offers Essential Insights into Book Readership
Published: September 15, 2016
The Pew Research Center's recent report about book reading gives us a peek at the relationship of print and digital media. The report says “A growing share of Americans are reading e-books on tablets and smartphones rather than dedicated e-readers, but print books remain much more popular than books in digital formats.” The chart shows what formats their respondents used in the year prior to the survey. Only 6% were digital-only readers. The report states that 26% read no book in the last year; they may have read other things, but not books. Contrary to many reports about the “demise” of e-books, that has risen from 17% to 28%. It's been stuck there for three years. Print-only readers were 39% (remember: that used to be the entire market of book readers). Print and digital readers are now at 29%. Add the 6% digital-only, and you're at 35%. Content needs to be available in multiple media. Media selection is based on many factors, such as time, convenience, price, income, education, age, and others. Pew also offers insights into the use of audiobooks. The report is free can be downloaded from the Pew Research Center. One other note: when you hear that tablet sales are down or that e-book reader sales are down, keep in mind the versatile use of smartphones and their growing role in content engagement. Among readers 18-29 years old, 22% of them are reading books on their smartphones, 4x more than read them on e-book readers. Full Analysis
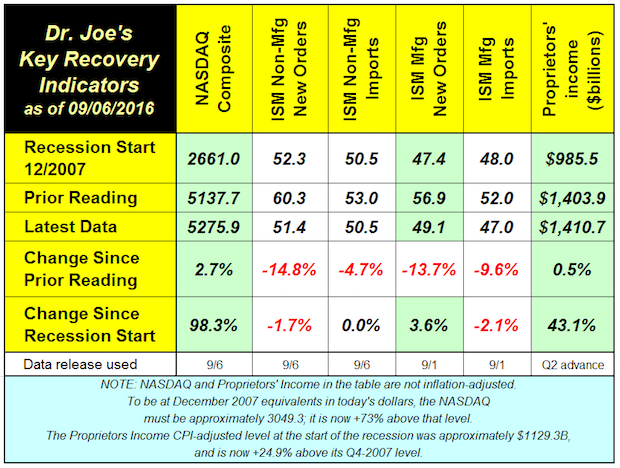
Four of Six Recovery Indicators Fall, Two Now Below Levels of Last Recession
Published: September 8, 2016
The recovery indicators were hit hard last month last month, with two of them falling below the levels at the start of the last recession. Those levels were the readings of these indicators for December 2007. Full Analysis
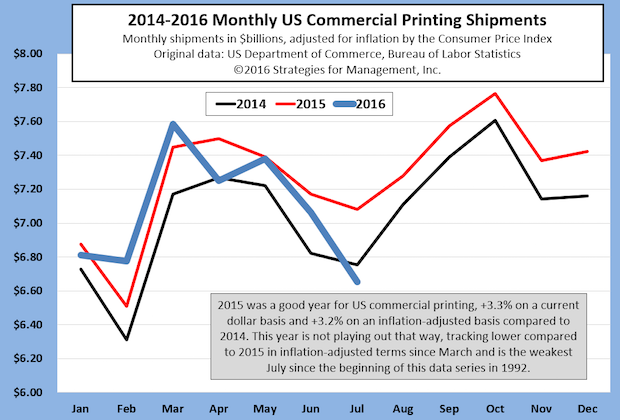
US Commercial Printing Shipments Have Rough July
Published: September 7, 2016
The reversal in trend for US commercial printing shipments went from somewhat benign to significant in July's data. Last year, the industry was relatively stronger than 2014, but shipments have been on a downturn for the last four months of reporting. Full Analysis
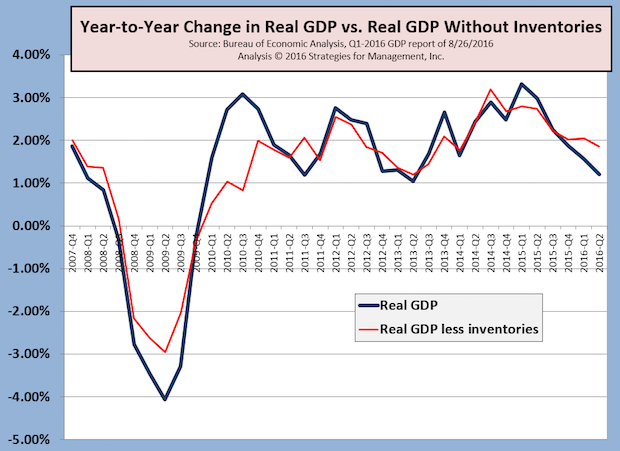
Real GDP for Q2 Revised Down Slightly to +1.1%; Durable Goods Orders Still Contracting
Published: August 29, 2016
The latest revision of real US GDP for Q2-2016 dropped from +1.2% to +1.1%. The estimate for Q3 from the Atlanta Fed is above +3%. Full Analysis
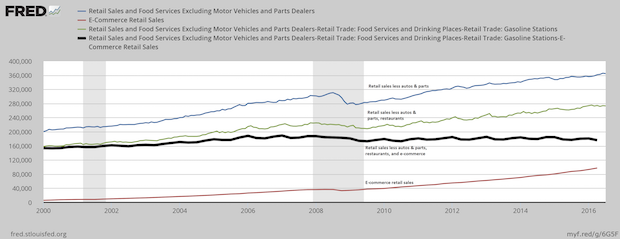
E-Commerce and US Retail Sales
Published: August 25, 2016
E-commerce has been running at the rate of 15% annual growth for many years, but is just 8% of retail sales. That seems tiny in relation to what we've seen happen to print promotions like catalogs and direct mail, and the rise of zombie or troubled shopping malls. The problem is that big ticket items, like autos, raise the size of retail sales. Those items may be researched online, but their actual purchase is not made until it is transacted at a car dealer. Restaurant purchases are also a distorting issue in the data. This chart explains it a little better. E-commerce sales is at the bottom (red line). In the second quarter, it was just short of $100 billion. The blue line is retail sales less vehicles and parts. The green line has food service sales deducted. The black line had e-commerce sales deducted, and shows retail sales through traditional channels. Those sales through older channels are lower than they were at the start of the recession. All of the growth in non-auto and non-restaurant retail for the last decade has occurred in e-commerce channels. Full Analysis
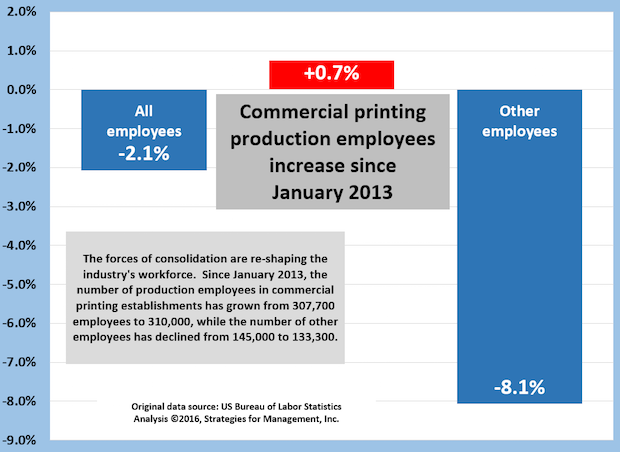
Commercial Printing Employment: Production Employees Up +0.7%, Administrative Down -8.1%
Published: August 11, 2016
Since January 2013, the number of production employees in commercial printing establishments has grown slightly, and is up +0.7%, from 307,700 employees to 310,000. Other employees, which are mainly administrative including sales, are down -8.1%, from 145,000 to 133,300. Full Analysis
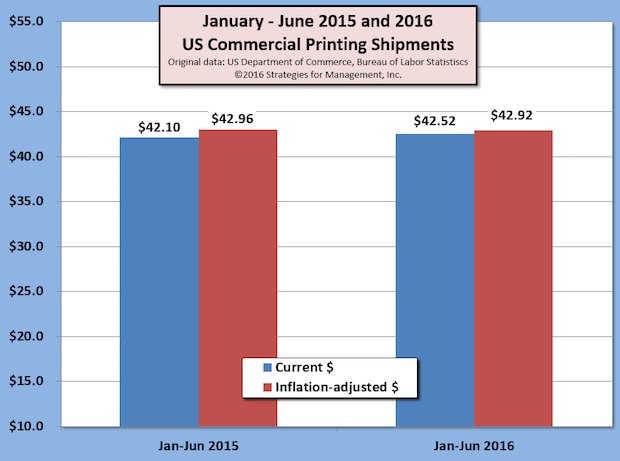
US Commercial Printing Shipments for First Half of 2016 Up +1%; Q2 Shipments Decline
Published: August 5, 2016
In data released by the US Department of Commerce, commercial printing shipments for June 2016 were down -$58 million compared to last year (-0.8%). On an inflation-adjusted basis, shipments were down -$130 million (-1.8%). Full Analysis
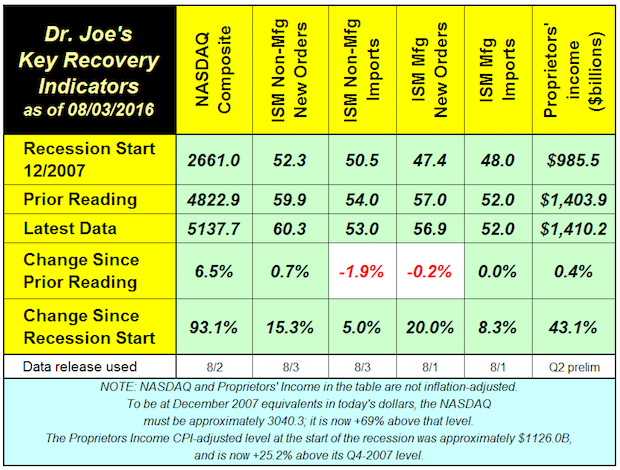
Recovery Indicators: 3 Up, 2 Down, 1 Unchanged
Published: August 4, 2016
The NASDAQ had a good month, rebounding by 6.5% last month. Compared to last year at this time, the NASDAQ is up +0.6%, which is a negative return compared to inflation (less inflation it is -0.5% because the CPI is +1.1%). Full Analysis
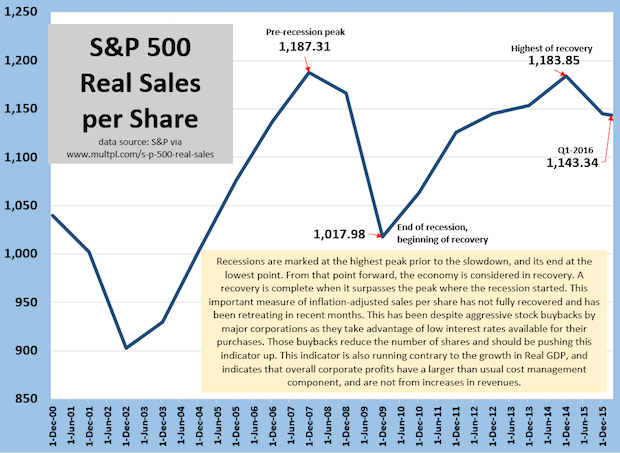
S&P 500 Real Sales per Share Reflects Struggling Economy
Published: July 28, 2016
A way of judging the health of the economy is to calculate the inflation-adjusted sales of all of the companies in the S&P 500 and divide it by the total number of public shares. This index should have a natural upward bias. S&P 500 companies are very large, and acquire or merge with other companies, many of which are outside of the 500 companies. Buybacks of stock, which has been a trend of note these last five or so years, reduce the number of shares, or slow the growth in shares, reduce the denominator, again, giving it an upward bias. Instead, this measure has suffered. It peaked in 2007, and has yet to surpass that level. This means that corporate profits, which have generally been good (though slowing lately) have been managed by refinancing of debt to lower interest rates and reductions in costs and expenses. Those better profits are not the result of increased revenues. Slow, sluggish economic growth is reflected in these figures, and is a reminder that one should not look only to GDP as an indicator of the true health of the private sector. Full Analysis
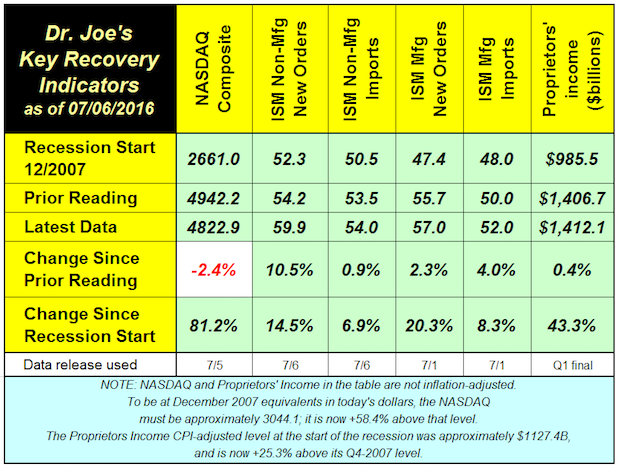
Recovery Indicators Better than Recent Economic News
Published: July 7, 2016
The recovery indicators showed better economic activity in June. This ended the second quarter in a manner that seemed contrary to many recent economic data. Full Analysis
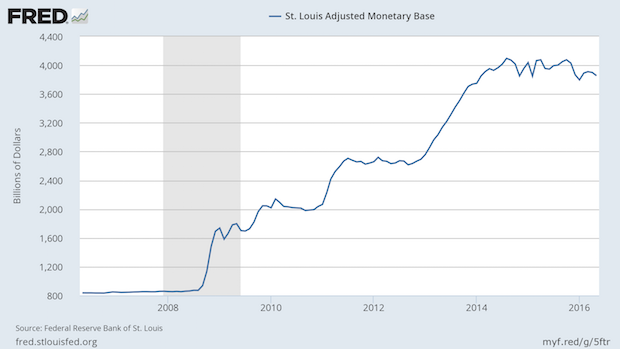
Are We Headed to QE4?
Published: July 7, 2016
This chart shows the Fed's balance sheet in the format known as the St. Louis Adjusted Monetary Base. Prior to the doubling of that balance sheet, it was growing at the annual rate of 6%, which was basically comprised of the long term rates of 1% for population growth, 2% for inflation, and 3% for economic growth. Full Analysis
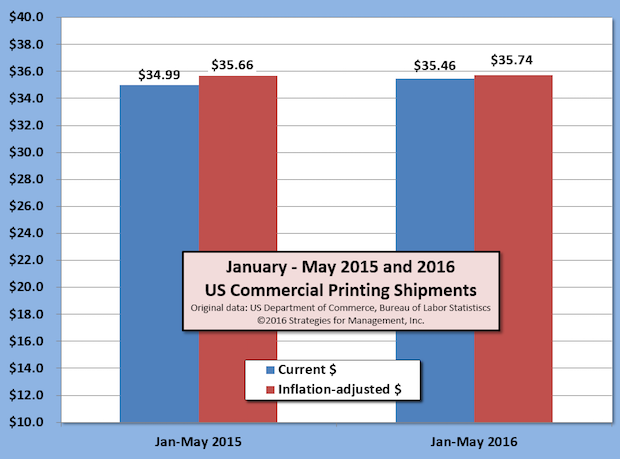
May Printing Shipments Up +1.2% Versus 2015; Trend is Flattening
Published: July 6, 2016
US commercial printing shipments for May16 were $7.37 billion, the highest level in current dollars for the month since 2013. For the first five months of 2016, shipments are up approximately +$476 million in current dollars (+1.4%) and up +$79 billion after inflation (+0.2%) Full Analysis
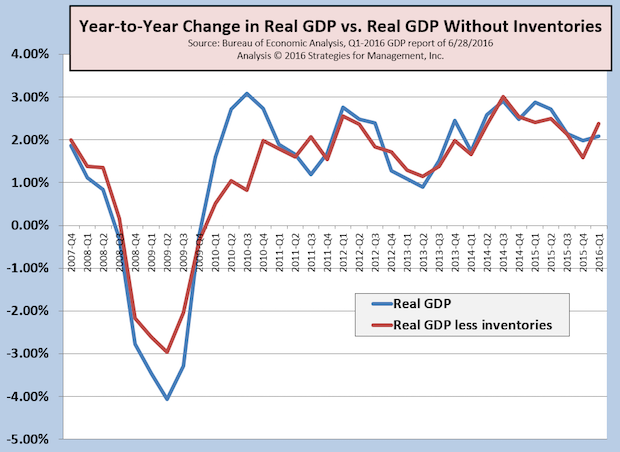
US Q1-2016 GDP Revised to +1.1%
Published: June 30, 2016
US real GDP for Q1-2016 had its third and final revision in this reporting cycle, and was +1.1% on an annualized basis compared to Q4-2015. Q1 had been reported as +0.5% in its advance report, +0.8% in the preliminary report, and now as +1.1%. Real GDP remains very low compared to the post-WW2 +3.3% rate. Full Analysis
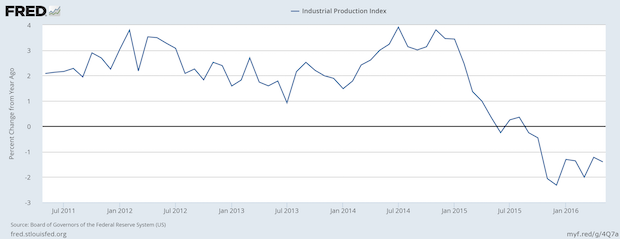
Industrial Production Continues its Negative Turn
Published: June 23, 2016
The Fed’s own data probably caused them to have a more dour outlook about the economy. The chart shows that US industrial production started slowing at the end of 2014 and has been in outright contraction since Fall 2015. Full Analysis
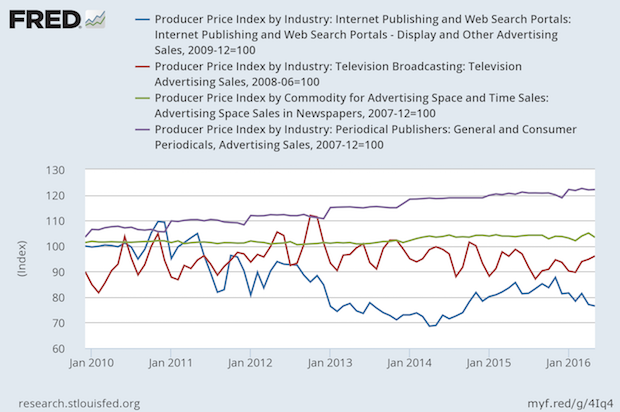
Prices for Advertising Rise for Magazines, Stable for TV and Newspapers, Down for Digital
Published: June 16, 2016
The chart shows that magazine advertising has gone up by more than 20% since 2010, but it's hard to know how much might have been bundled in those prices. Pricing reports sent to the Bureau of Labor Statistics are supposed to be in constant units, but it's hard to determine those in service environments, and it's hard to quantify a wink or a nod in an advertising agreement. Full Analysis
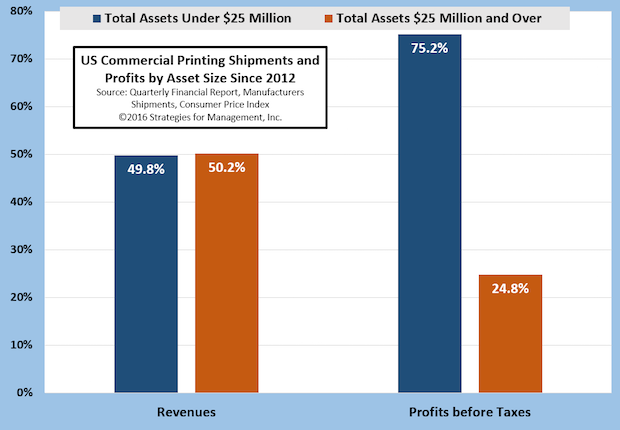
Smaller Printers Are Giants in Profits
Published: June 9, 2016
The changes in the media markets led to the declines in magazines, catalogs, newspaper inserts, and many of the products produced by large printing organizations. For years, these companies were giants in the industry, but recently this sector has been restructuring through consolidations. Writedowns in goodwill and for closed plants have cut the profits of these organizations. Full Analysis
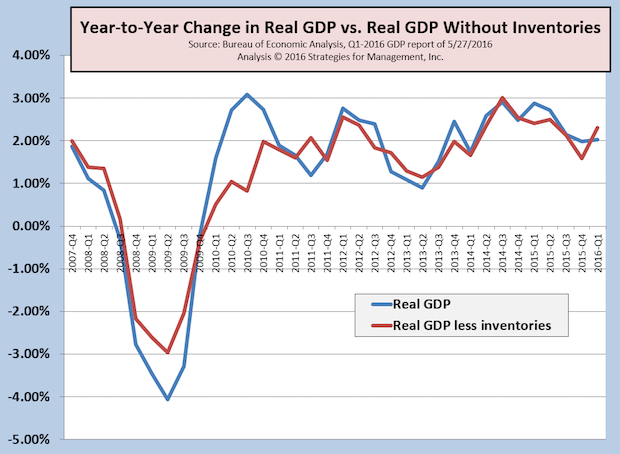
Q1-2016 Real GDP Revised Up to +0.8%; Economy Already Recovering from Mini-Recession
Published: June 2, 2016
The first estimate of Q1-2016 GDP was +0.5%, and that was revised up slightly to +0.8%. The concerns about recession are being reduced lately with some better economic news that show the economy on its sluggish pattern of sub-par growth in the +2% range, well below the post-WW2 average of +3.3%. As noted many times, there are numerous economic indicators that have yet to reach their pre-recession levels. Since this pattern has been so long in duration, even non-money denominated statistics, such as employment, have to be adjusted by population growth to discern true underlying levels. The chart shows Real GDP on a more conservative year-to-year basis as reported and with the volatile effects of inventory changes removed. The economy still seems to be digesting some long-term inventory rebalancing, some of which is related to global currency and other economic issues. The slowdown of the first quarter still seems to be limited to the first six weeks of the year. At the time of this writing, the Atlanta Fed's GDPNow estimate of Q2-2016 is at +2.5%. While that is a disappointing level, it is consistent within the lackluster level of economic growth that has come to be known these past years as “new normal.” Since 2011, real GDP has averaged only 2%. The difference in the average may not seem a lot, but a 2% annual growth rate will result in an economy doubling in size in 39 years; at 3.3%, it doubles almost 16 years sooner.
Full Analysis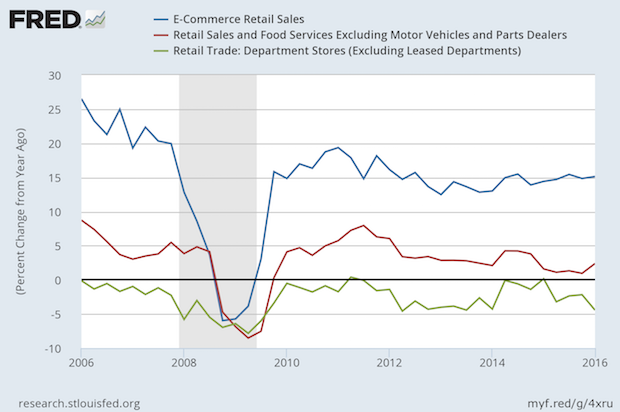
Retail Sales Growth Rates Reflect Changes in Competition and Consumer Preferences
Published: May 26, 2016
Department stores are still having problems. Their year/year growth rate has been negative for more than a decade. E-commerce sales are maintaining a 15% growth rate. At that rate, they double every five years. The last peak in growth for retail sales excluding motor vehicles was in late 2011, and that rate, unadjusted for inflation, has slowed to the 2% range. Retail sales are a function of household income, and their costs, and they remain sluggish as median household income has still not reached the level it was at the beginning of the recession. In the meantime, shopping malls, the department stores that anchor them, and mall owners are having problems. A Weekly Standard article about Amazon has some insights into it. The downslide of brick and mortar retail stores and malls can create collection problems for printers who sell to them, but there are changes underway that might hold some opportunities for those printers who seek them. Developers are using mall complexes for new buildings that include office space and even hospitals and hockey rinks. There are also new efforts to treat the shopping experience not just as a matter of location, but holistically to include all digital touchpoints inside and outside the mall. How will much of this be communicated? It will often require signage, working closely with store owners and local mall management. Those printers, attuned to the nature of communications logistics and data management, can find opportunities there.
Full Analysis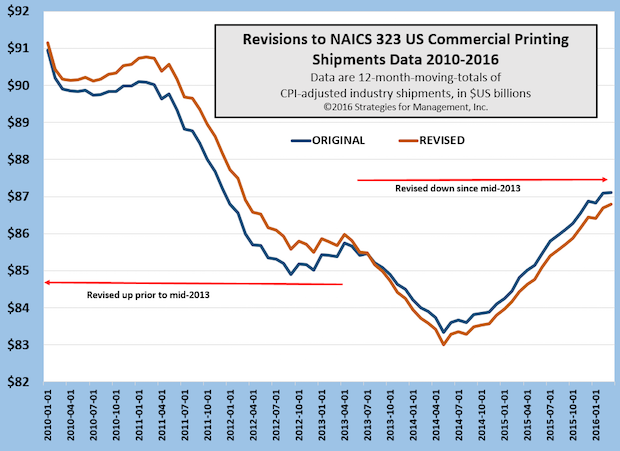
Printing Industry Shipments Revised from 2007 to 2016, with Minor Changes Since 2009
Published: May 19, 2016
The years 2008 through 2013 had slight revisions higher; the end of 2013 to present had slight revisions lower. The Commerce Department's revisions to all manufacturing data are leading up to a multi-year revision of GDP data at the end of July. Full Analysis
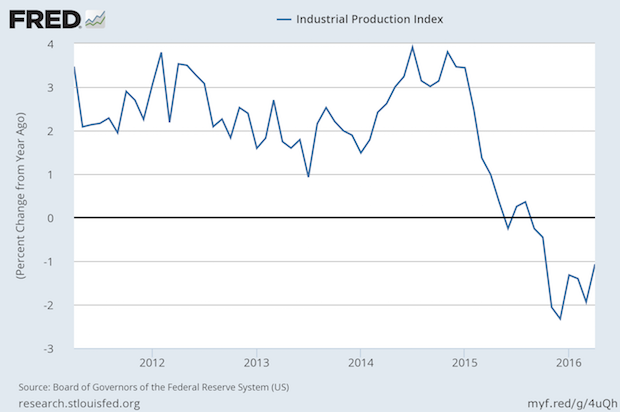
Manufacturing Still in Contraction
Published: May 19, 2016
The latest Federal Reserve industrial production index showed a slowdown since late 2014 and an outright contraction since mid-2015 is still in process. The business press focused on the comparison to the prior month, which looked like an improvement. The chart, however, compares to the prior year. Recent consumer retail data have been more optimistic, and the premise that we had a “micro-recession” at the beginning of the first quarter seems to be justified. There is growing pressure to weaken the US dollar to make manufacturing exports less expensive to international customers. The Atlanta Fed's GDPNow estimate for Q2 GDP is now +2.5%. At that rate, it would be a rebound from Q1's +0.5%. Full Analysis
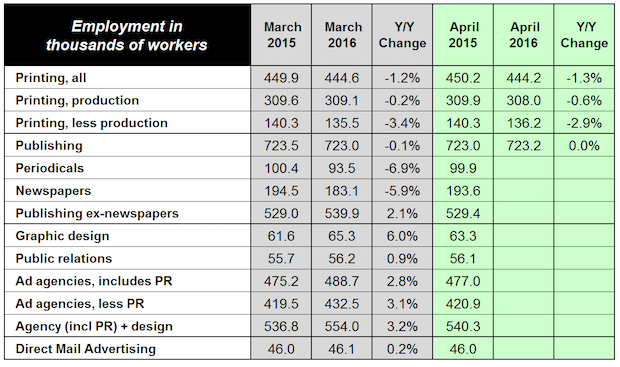
Graphic Design Employment Up +6%, Agencies up +2.8%
Published: May 12, 2016
Content creation is in a strong uptrend based on the latest employment data. Graphic design employment is up +6%, and has taken over from public relations employment as the surging area of hiring. Full Analysis
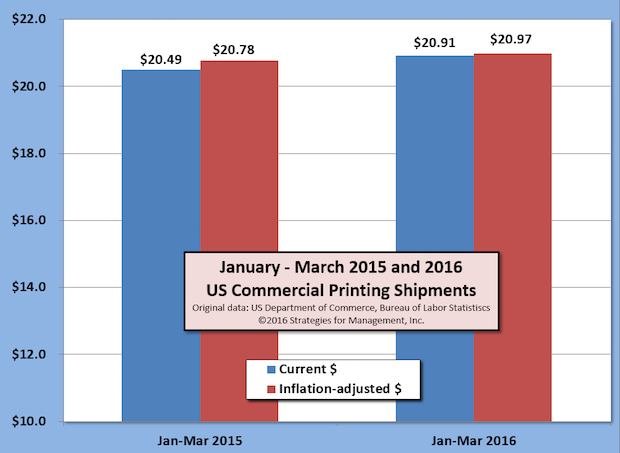
19 Consecutive Months of Improved US Commercial Printing Shipments
Published: May 5, 2016
US commercial printing shipments have increased compared to the prior year for 19 consecutive months. March 2016 shipments were up +$85 million (+1.1%) in current dollars compared to 2015, and +$22 million (+0.3%) after adjusting for inflation. February 2016 shipments were revised up by $2 million. Full Analysis
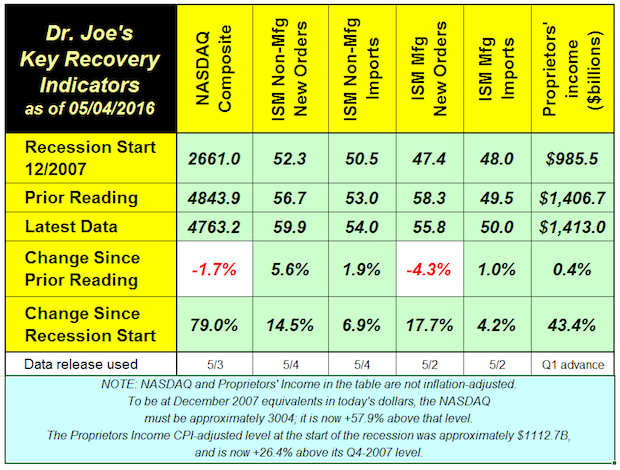
Recovery Indicators Better than the Recent General Economic News
Published: May 5, 2016
The recovery indicators are more positive than the general economic news. One of our indicators, the NASDAQ, is down -1.7% since last month. It's been on a rocky road for the last three quarters. Its recent peak was 5218.86 in July, and it has not gotten really close since. Stock market concerns have focused on a decline in the rate of corporate profits, and Apple's recent financial report did not really help matters. There was a bullish rise in non-manufacturing orders. Manufacturing new orders index might look like a decline, but it is still indicate moderate growth. Proprietors income, a measure of the health of small business, was up only slightly. Other reports of small business health have not been good, especially the recent NFIB Small Business report. This month's recovery indicators don't indicate recession, a word that is bandied about with greater frequency lately, but support the continuing unsatisfying levels of slow but positive growth. Full Analysis
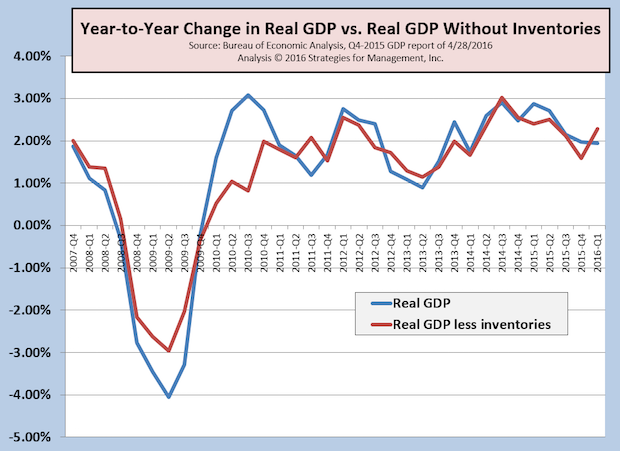
Q1-2016 GDP +0.5%; Inventory Correction Finally Arrives
Published: April 29, 2016
US real GDP for Q1-2016 was reported at annual growth of only +0.5% compared to Q4-2015. On a year-to-year basis, the growth rate was +1.95%. The inventory adjustment that the economy has needed finally came, with the lowest net inventories in two years. Real GDP growth less inventories was +2.3% on a year-to-year basis. Full Analysis
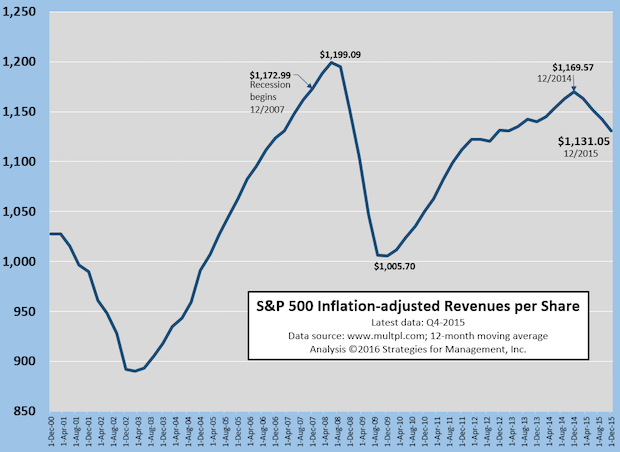
S&P 500 Revenue Per Share Still Lags Economy
Published: April 28, 2016
Everyone knows that the stock market is up from its lows at the bottom of the recession,but one obscure but key measure underscores how sluggish the economy has been. The S&P 500 should have a bias of steadily increasing revenues. It has most of the best companies in the world, with international presence in the globe's growing markets and a foundation in the established ones. It is rare for companies to be dismissed from the S&P 500, but companies are added all the time. When S&P companies merge, they create a new entity of combined revenues, and another company is added with new revenues to add to the index. The other upward bias should be the high level of stock buybacks buy these large companies, as they borrow money at low interest rates and create “shareholder value” by reducing the number of shares and increasing the value of each share of stock. We've called this cowardly, as it increases earnings per share (EPS) without needing to increase total profits. So this revenue per share should be steadily increasing with a growing economy in a recovery that started in mid-2009. It seems that companies have done a much better job of financial engineering than they have in creating revenues. Full Analysis
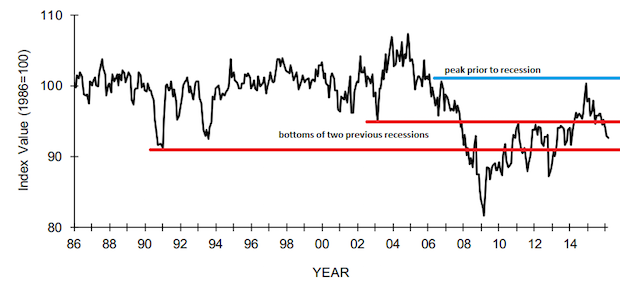
NFIB Small Business Index: A New Recession for Main Street?
Published: April 21, 2016
Economic data have been conflicting of late, but there is one consensus in the data that is clear: the small business economy did not recover from recession, and looks like it’s back in recession territory. There are many indicators we use for small business but one that is watched often is that of the NFIB. It is published monthly and has a long history. US government data focuses attention on the largest businesses because they represent big chunks of the economy and report some kind of data, especially payroll data, with great frequency. Think of it as counting whales rather than minnows. Their recent analysis said “The small business sector... is underperforming, doing little more than operating in maintenance mode. Slow economic growth is now just a result of population growth, more haircuts, retail customers, health care patients, etc. But there is no exuberance, no optimism and not much hope, the numbers make it clear.” Economies stuck in +2% growth mode tend to do that. Full Analysis
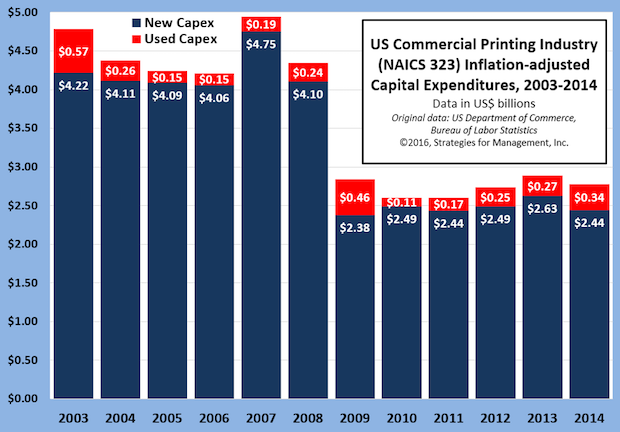
2014 US Commercial Printing Capital Expenditures: New Purchases Down, Used Purchases Up
Published: April 19, 2016
The US Department of Commerce recently released its Annual Survey of Manufactures Capital Expenditures report, issuing data for 2014. Full Analysis
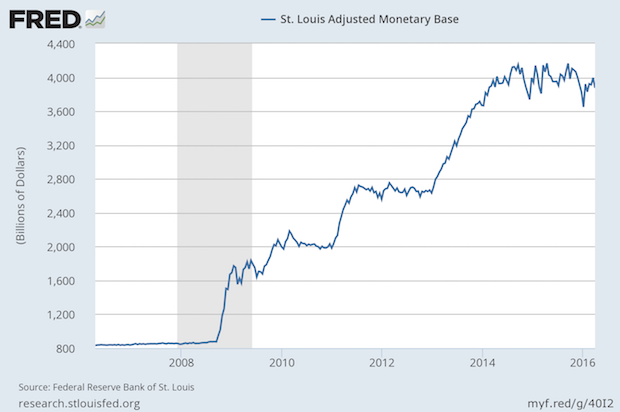
The Fed Never Really Stopped QE3
Published: April 14, 2016
This week’s chart shows the aggressive actions of the Federal Reserve after the housing bubble. For decades, the Fed’s balance sheet increased by about 6% per year, averaging about half inflation and half economic growth. The rocket-like rise when the bubble burst is clear, and then the three steps up of each of the quantitative easings are plainly seen. The Fed has wanted to raise rates for some time, but they have also wanted to stop the buying of government instruments that characterized the QE programs. They create shortages of publicly traded bonds which increases their prices, which makes the effective interest rates low. Rather than ending their purchases, the Fed has been replacing matured obligations. In effect, this keeps QE3 going. Can the Fed ever end it? They may hold on and hope that over time that economic growth and inflation catches up to them in time, but that can take forever, or perhaps longer. It will be difficult for the Fed to end its policy without robust economic growth that will give them the flexibility and opportunities to unwind their holdings. Should a recession begin, or a new financial crisis emerge (even an internationally) the Fed might need to create an additional QE effort. Full Analysis
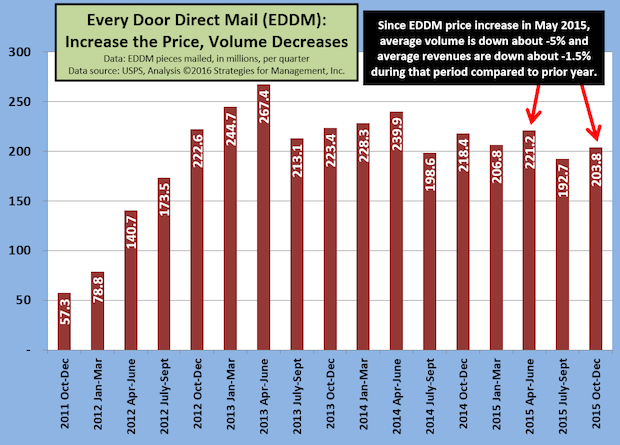
Can USPS Price Increase Rollback Get EDDM Moving Again?
Published: April 7, 2016
The USPS is always in the news, and last month's Annual Compliance Determination report was not particularly positive. “The majority of products failed to meet service performance targets for FY 2015” read the Postal Regulatory Commission press release. The PRC directed “the Postal Service to improve service performance and provide a comprehensive plan within 90 days.” Full Analysis
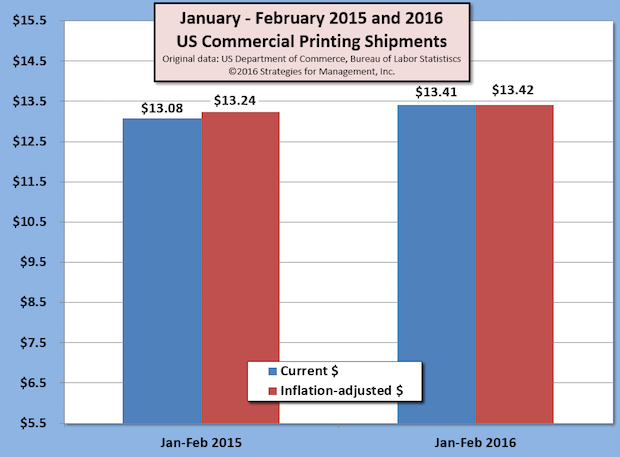
Twenty-one Months of Consecutive Increases for US Commercial Printing Shipments
Published: April 6, 2016
The US Department of Commerce issued its latest report of US commercial printing shipments (NAICS 323) and the data show 21 consecutive months of positive comparisons to the prior year current dollar shipments. The trend started with June 2014, and has been an average increase of +3.3%, +$225 million per month, for that period. Full Analysis
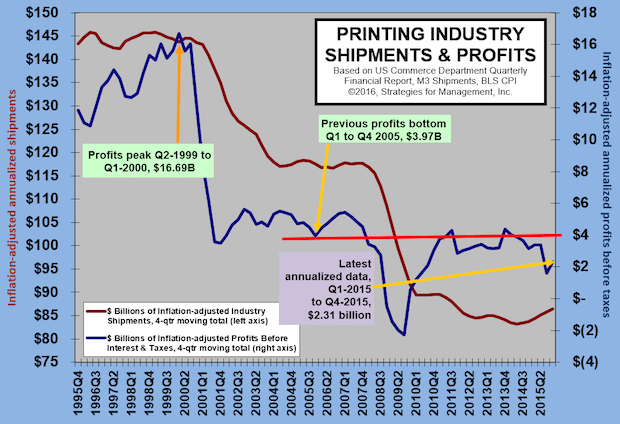
Printing Profits Rebound (A Little)
Published: March 31, 2016
Profits bounced back from a terrible third quarter which had an industry-aggregate loss of -2.57% as a percentage of revenues, and went back up to a more reasonable 4.38%. The difference was the massive writedowns of the third quarter which resulted in a -10.97% loss in printing companies with more than $25 million in assets. Full Analysis
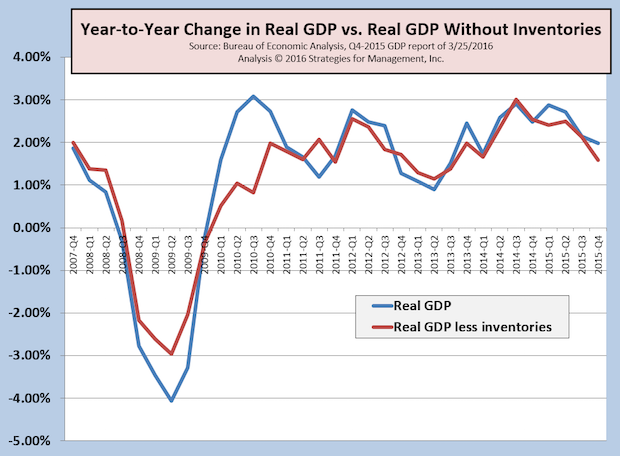
Third Look at 4Q-2015 GDP Revised Up, Atlanta Fed Q1-2016 GDP Estimate Plummets
Published: March 30, 2016
In a clear case of dealing with a two-handed economist when asked about economic conditions, the Bureau of Economic Analysis increased their estimate of fourth quarter GDP to +1.4%. The initial report was +0.7%, and then it was revised to +1.0%, and now it is +1.4%. They were off only by $100 billion from the first report, greater than the size of the printing industry, just to add some perspective about how big the US economy is. Full Analysis
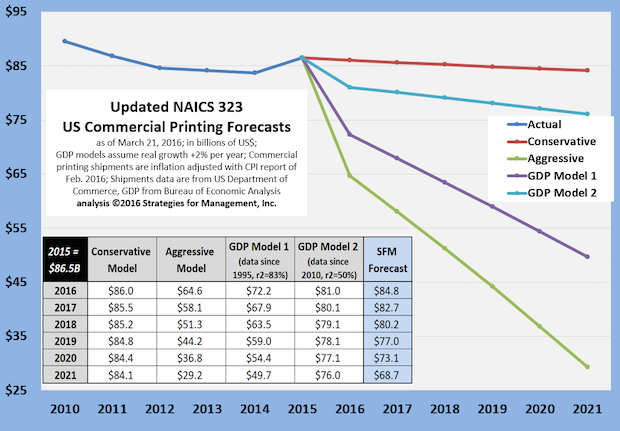
Updated Commercial Printing Forecasts to 2021
Published: March 24, 2016
Now that 2015 data are complete, we have run the forecasting models again and present them in this chart. Full Analysis
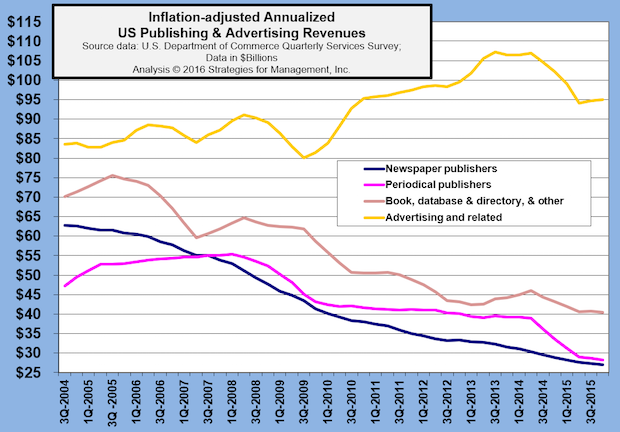
Advertising Agency Revenues Have Major Revision Down for 2013 & 2014, but Remain in Long-term Uptrend
Published: March 17, 2016
The US Department of Commerce released its latest Quarterly Service Survey last week, and it reduced shipments for the third quarter of 2013 by -$4 billion (whoops – a -15% statistical error). Full Analysis
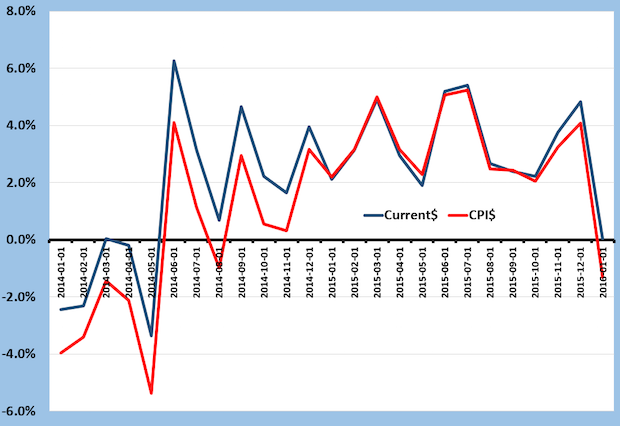
Is the Positive Run for Commercial Printing Coming to a Close?
Published: March 10, 2016
The latest printing shipments were discussed in the “Mondays with Dr. Joe” of March 7. The chart offers more details. Revenues turned around on a current dollar basis with June 2014 shipments (blue line) and the positive comparisons to the prior year kept going until the most recent report, January 2016. In current dollars, January’s shipments were barely above those of 2015, keeping the positive comparison streak intact. Full Analysis
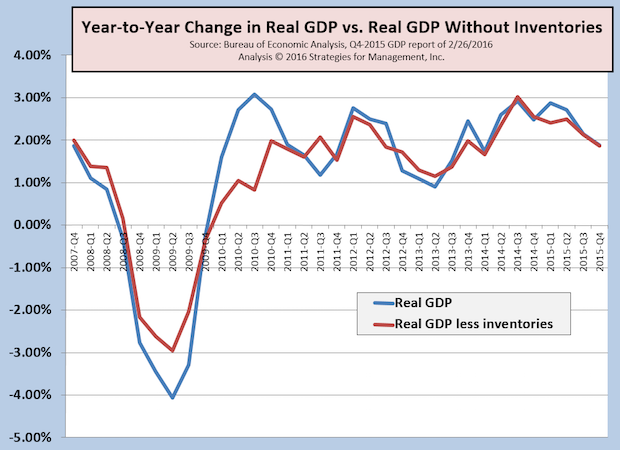
4Q-2015 GDP Revised Up from +0.7% to +1.0%, But Not as Good as It Seems
Published: March 1, 2016
The second estimate of fourth quarter GDP was revised up from +0.7% to +1.0%, mainly from an increase in net inventories. This factor in the GDP calculation is volatile, so we track GDP with and without it to get a perspective of the underlying GDP rate from a long term perspective in a year-to-year comparison. Full Analysis
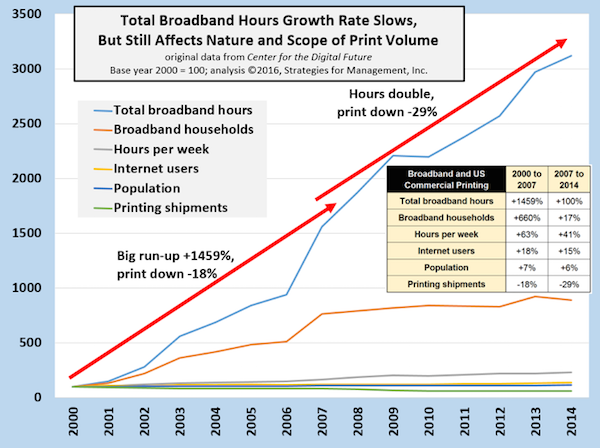
Broadband Hours and US Commercial Printing
Published: February 26, 2016
In 2014, US per capita hours using broadband is just over 900 per year (2.5 per day), and that's the entire population. The number of total hours has doubled since 2007. The population has grown in that period, but the average number of hours online per week has gone from 15.3 to 21.5 in 2014, and households with broadband connections grew from 76% to 89%. The cumulative effect has had most of its effect on mainstream commercial printing, especially information materials used for promotion and product support and advertising-funded products like magazines and catalogs. Printing's use is becoming more tactical, focused on specialty uses of printed images with higher expectations for impact, especially in concert with other media. Full Analysis
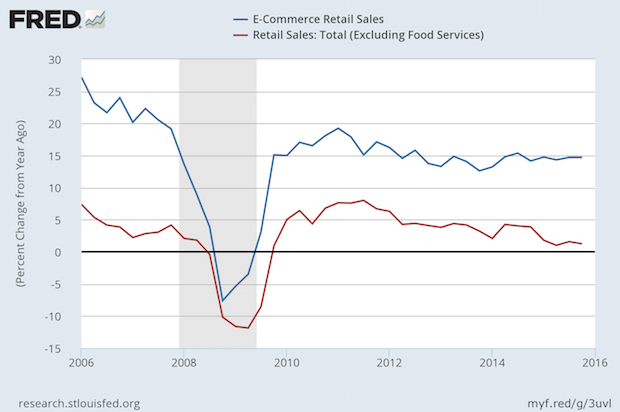
E-Commerce Retail Sales Still Growing at Nearly 15% Per Year
Published: February 18, 2016
E-commerce sales of all types, including industrial products, is still growing at a rate just under 15% per year. Full Analysis
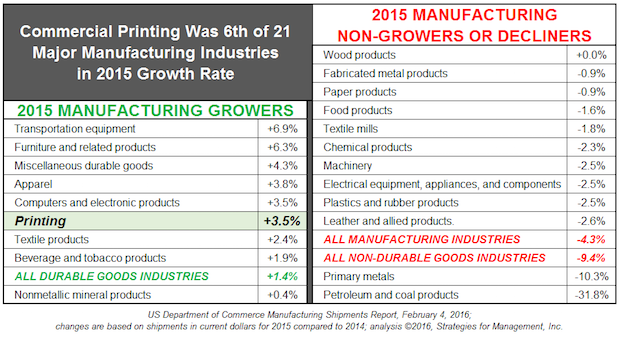
Printing Was 1 of 8 Major Manufacturing Industries with Positive Growth in 2015
Published: February 11, 2016
Part of print's good 2015 was how well it did compared to other industries. Of 21 major manufacturing industries, nine had positive years in current dollars, with commercial printing as sixth highest. Precipitous decreases in commodities prices caused manufacturing in metals and energy to have such a bad year that the entire manufacturing sector declined -4.3%. For the year, current dollar GDP growth was +2.9%. For the first time in twenty years, commercial printing growth exceeded GDP. Full Analysis
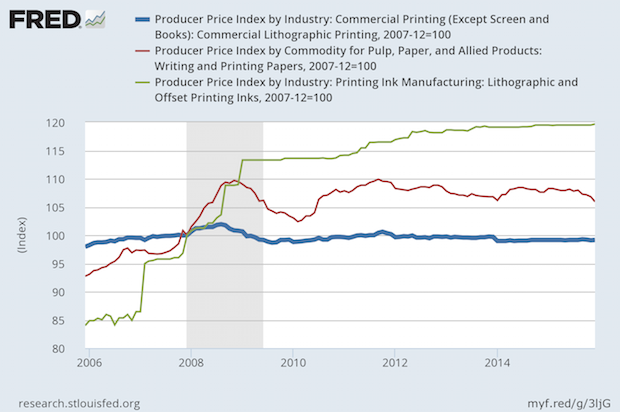
Commercial Printing Prices Less Than December 2007; Paper and Ink Higher
Published: February 4, 2016
Since December 2007, the CPI is up by +12.6%. How have the PPI for commercial printing, ink, and paper changed? Commercial printing prices are lower, -0.8%. This means that a commercial printing business has to increase its productivity and profitability to reward its owners and employees to make up for the loss of purchasing power they have in their paychecks. Full Analysis
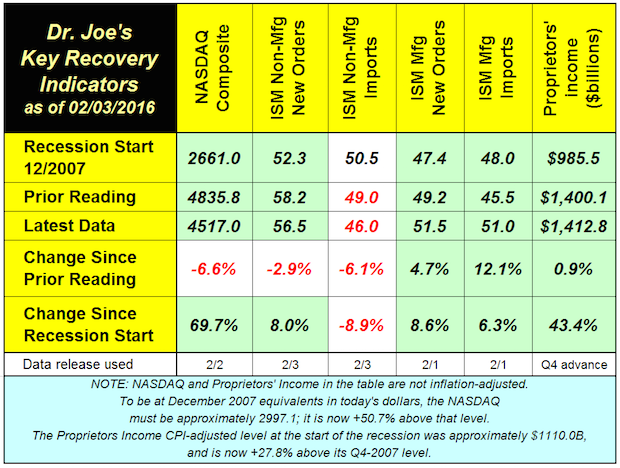
Recovery Indicators Show Economic Slowdown Underway
Published: February 4, 2016
The monthly recovery indicators were uneven again. The NASDAQ fell almost -7% in the last month, and ISM non-manufacturing new orders and imports also declined. Full Analysis
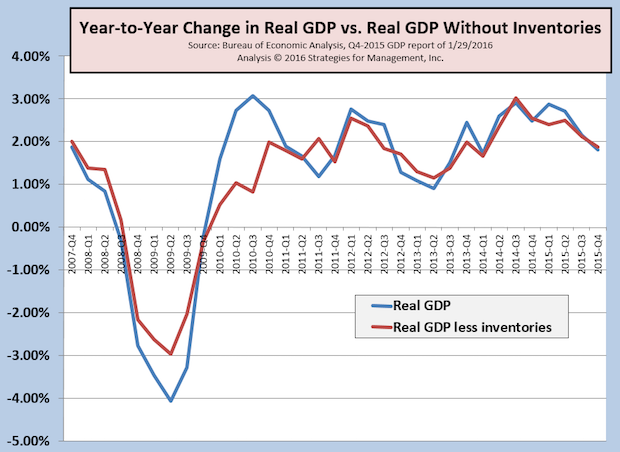
4Q-2015 GDP Disappoints at +0.7%; 2015 GDP +1.8%
Published: February 1, 2016
Real Gross Domestic Product (RGDP) for the US increased by an annual rate of +0.7% in the fourth quarter of 2015. On a year-to-year basis, RGDP was up +1.8%. Full Analysis
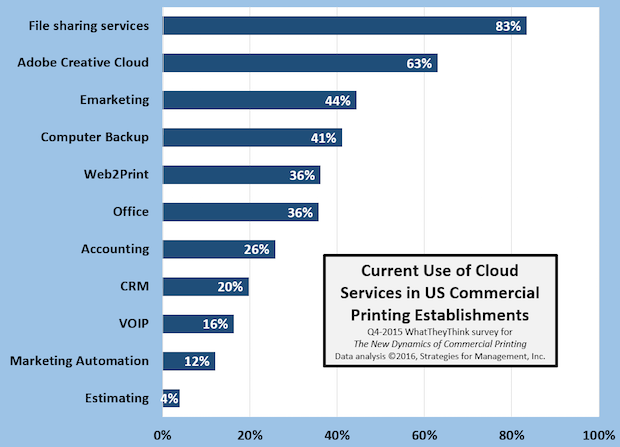
Cloud Product Usage in the Printing Industry
Published: January 28, 2016
The chart shows the percentage of US commercial printing establishments of all sizes and their responses to the question about the cloud-based services they use today. The question did not ask them their frequency or intensity of use, just whether or not they use it today. Some of the “non-users” may not even be aware that they are using cloud services, since some services run transparently in the background, such as backup services like Carbonite and others. Others may not be aware that they are using a VOIP phone system. Some cloud services such as Dropbox allow customers to brand their service so it looks like a company file sharing site. Generally, larger printers are using more cloud services than others, but the disparity is narrow. Full Analysis
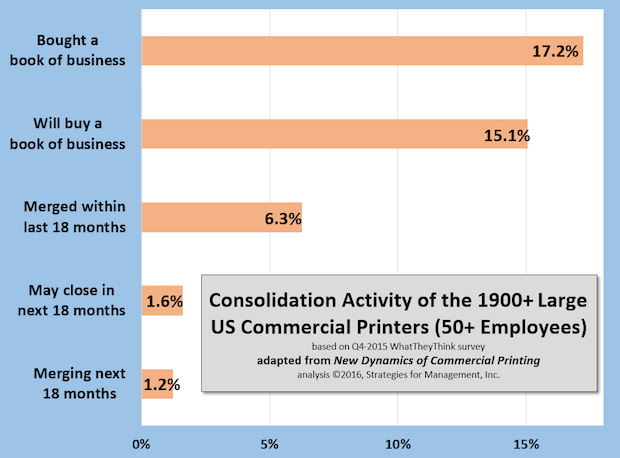
Consolidation is Somewhat Different Than Industry Common Wisdom
Published: January 21, 2016
Here are data from our survey at the end of 2015 where we asked respondents to identify the status of their companies in terms of consolidation. Generally, formal consolidations are executed by the largest print businesses, and small businesses close their respective shops and reopen a new business with new partners. Full Analysis
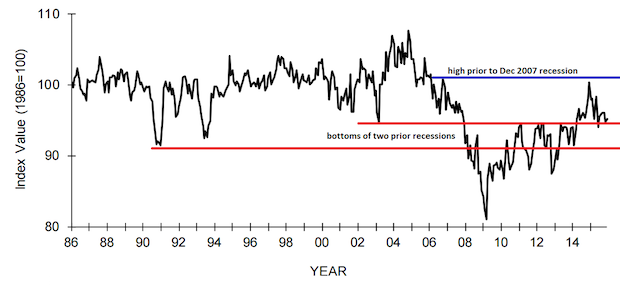
NFIB Small Business Index Still Shows Weak Small Business
Published: January 14, 2016
The latest survey of NFIB shows their index bouncing along the level of the early 2000s recession low, and down from the high prior to the December 2007 recession. Passing that level on the way up would have indicated a completed recovery of this sector but it just couldn't make it that far and break through. Using this indicator that means that small business did not emerge from the recession yet. Big business and the stock markets dominate the headlines, but small business remains the front line of the economy, and its difficulties are often hidden from view as being un-newsworthy. Its breakout above the bottom of the early 2000s recession took some time, and the recent trend in the chart looks like it's getting ready to fall below that again. It dipped below that level briefly a few months ago and climbed back out. Will it climb out again? It's worth watching. Full Analysis
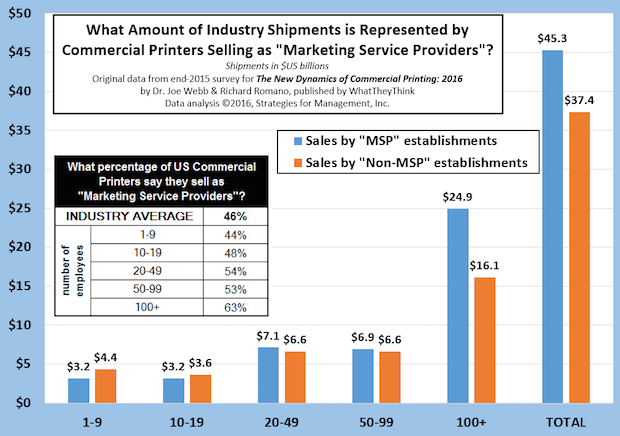
What Share of Shipments is Sold by “Marketing Service Providers”?
Published: January 7, 2016
For about a decade, many print businesses have marketed themselves as “marketing services providers” with varying degrees of success. Our recent survey showed less than half of print businesses market themselves in this or a similar manner. Full Analysis
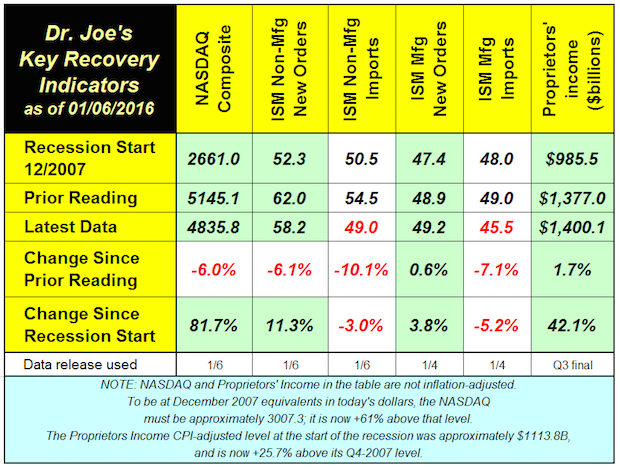
Recovery Indicators Look More Like Recession Indicators – Are They?
Published: January 6, 2016
Are the recovery indicators becoming recession indicators There's enough negative news of late to be wary about the state of the economy, and a lengthening list of geopolitical issues, for sure. Full Analysis
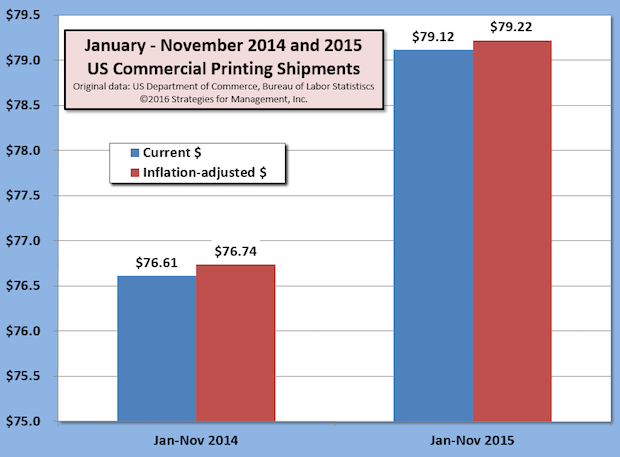
Eighteen Months of Industry Growth, Beating the Economy, Too
Published: January 6, 2016
US commercial printing industry shipments are up for 18 consecutive months in current dollars compared to the corresponding month of the prior year. Full Analysis
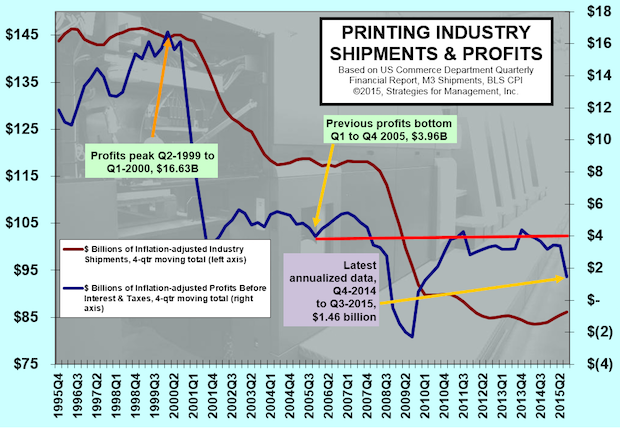
Printing Profits Dive as Large Printers Have Massive Writedowns
Published: December 22, 2015
The third quarter of 2015 marked a huge divergence in the performance of the industry, according to the Department of Commerce Quarterly Financial Report. Printers with more than $25 million in assets wrote down assets amounting to nearly -15% of revenues. This sent the quarterly moving total of inflation-adjusted profits before taxes to +$1.46 billion. Full Analysis
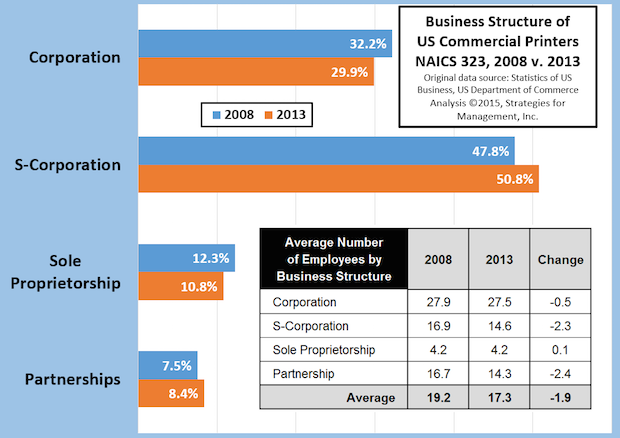
How the Business Structure of Commercial Printers Changed from 2008 to 2013
Published: December 17, 2015
The recession started just before 2008 was beginning and the latest data from the County Business Patterns report shows how the business formats of the industry changed by 2013. Full Analysis
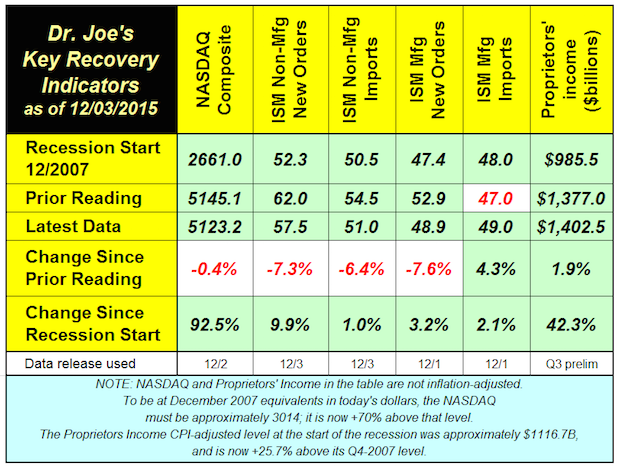
Recovery Indicators Cause Concern
Published: December 3, 2015
The recovery indicators turned in a mixed performance that warrants some caution, concern but not worry, yet. Some outside economic analysts starting to raise concerns about the economy in 2016. Citibank analysts peg the chances of recession in 2016 at 65%, the first such prognostication of a major investment firm that we have seen. Full Analysis
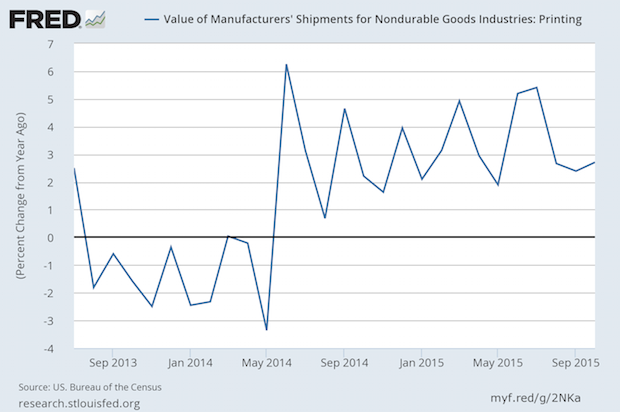
US Commercial Printing Shipments Have a Strong October, +$204 Million
Published: December 3, 2015
For 17 consecutive months the US commercial printing industry has scored increased shipments compared to the same month of the prior year. In current dollars, the Commerce Department reported that shipments were $7.729 billion. That meant that October 2016's shipments were +$204 million compared to 2015, a +2.7% performance. For the year through October, shipments are +3.3% on a current dollar basis. Full Analysis
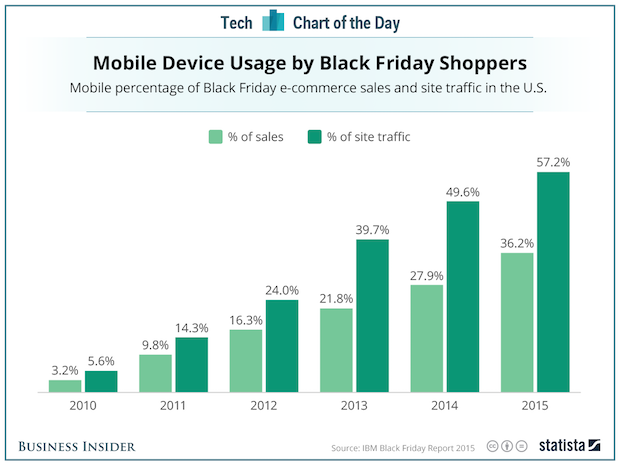
Mobile Plays Big Role in Black Friday
Published: December 3, 2015
The rise of mobile marketing has been long expected, and it looks like Black Friday 2015 is key milestone: mobile was more than half of web site traffic for e-commerce sites. Black Friday “brick-and-mortar” traffic was disappointing, but retailers were aggressively pushing sales online because it reduces the risks of riot-like runs for bargains as stores open. Target Stores had so much online traffic for CyberMonday its servers could not handle the volume. It wasn't the first time that Target misforecast demand for online sales. Some of Black Friday shopping may have been “window shopping” for mobile ordering. IBM, which still has a big business in systems for retailers issued a free download report about what was learned on Black Friday. In that report is the chart we highlight this week. If you sell to retailers or to businesses that sell to retailers, the report is worth reading. Full Analysis
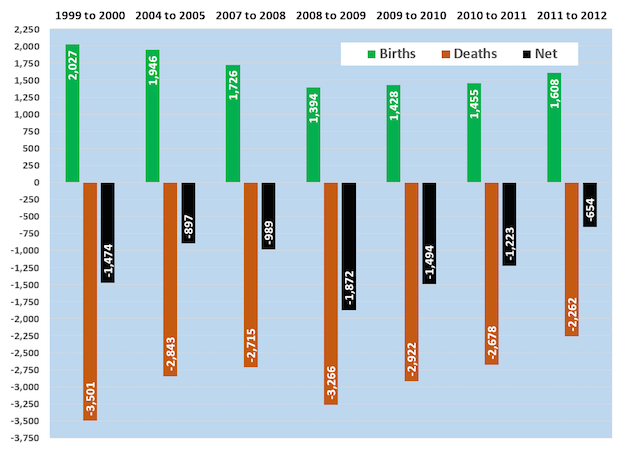
Printing's Birth-Death Data Show Improving Industry Health
Published: November 19, 2015
Even the usual industry dynamics are dynamic. The latest commercial printing industry birth-death data comparing 2012 to 2011 show a rising birth rate and a declining death rate. The +1608 births and -2262 deaths in 2012 were recent lows, as was the net change of only -654 establishments. Full Analysis
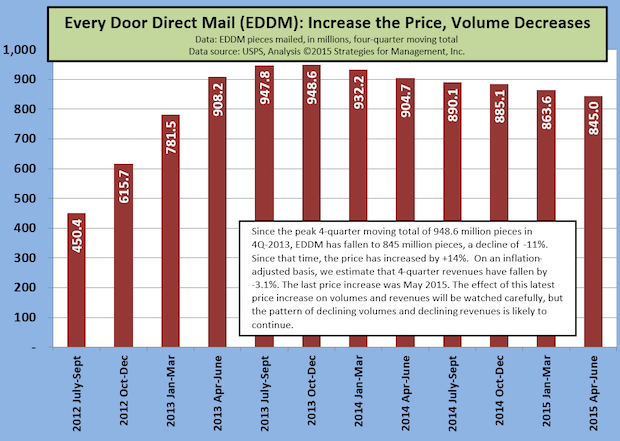
USPS EDDM Volume Decline Continues
Published: November 13, 2015
What could be an important product for local retailers to make their baby steps into direct mail, keeps declining as the USPS raises prices on the Every Door Direct Mail (EDDM) service. Full Analysis
Recovery Indicators Bounce Back
Published: November 9, 2015
The recovery indicators had a better month than last. Five of the six indicators increased and one fell below the level of the start of the recession. New orders for manufacturing and non-manufacturing were impressive in their increases, in stark contrast to government reports about September's durable goods and factory orders. Full Analysis
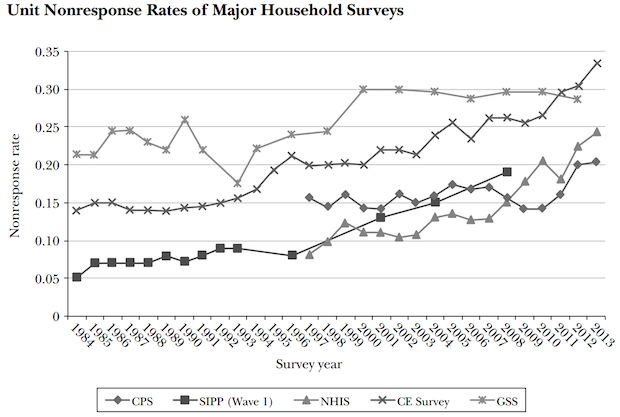
Can We Trust Government Data?
Published: November 5, 2015
A recent academic paper published in the Journal of Economic Perspectives (Volume 29, Number 4, Fall 2015), “Household Surveys in Crisis,” illustrates the problems of government surveys that are used to make multibillion dollar and multiyear decisions of government and business. Full Analysis
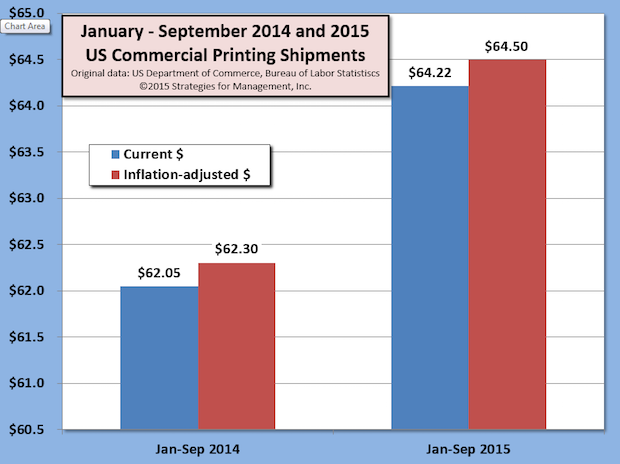
Third Quarter US Commercial Printing Shipments Have Highest Growth Rate Since 1996
Published: November 4, 2015
The US Commerce Department reported that commercial printing industry shipments are up for 16 consecutive months in current dollars compared to the same month of 2014. Full Analysis
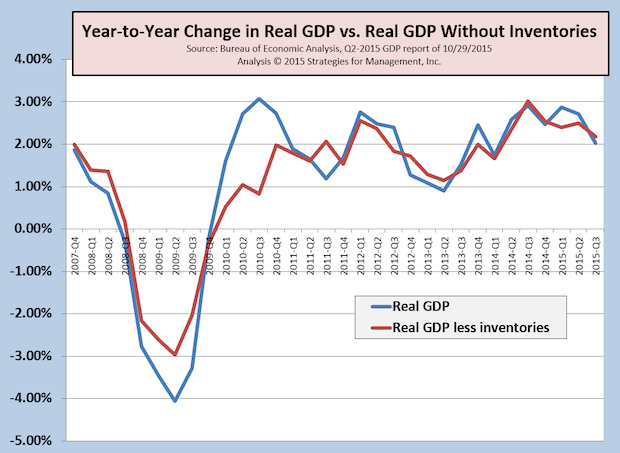
Third Quarter GDP Not Good, but Better Under the Surface
Published: October 29, 2015
The advance estimate of third quarter 2015 real GDP is +1.5%. We much prefer the year-to-year comparison, and also without the fluctuations of inventories. Those figures, also indicated in the chart, are +2.03% and +2.18% respectively. Net inventories have been running very high, but in the third quarter were $56.8 billion. This figure was cut in half from Q2, and is close to the 2010 to 2014 average. Full Analysis
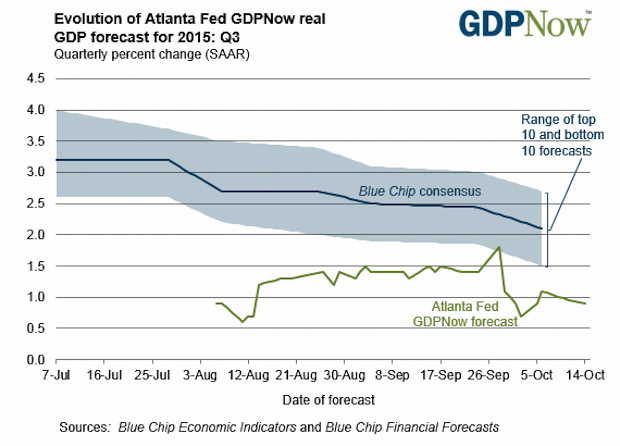
Recession Coming? Third Quarter GDP Looks Weaker than Experts Forecasted
Published: October 22, 2015
The latest estimate (October 20) by the Atlanta Fed's GDPNow model indicates that third quarter GDP will be +0.9%. That is, until the next data for their model comes in.
Full Analysis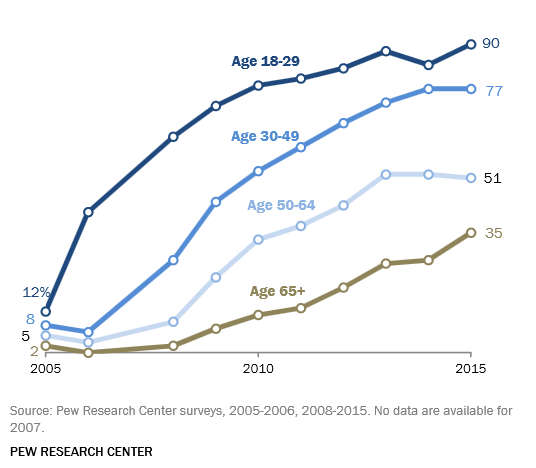
Pew Internet Survey Shows Social Media Use Up, Way Up, in Last Ten Years
Published: October 15, 2015
The Pew Internet Survey has released their latest survey (free download) of social media use and the long term trends are striking. The organization started tracking use in 2005 when social media use was by just 7% of the US population. Now, 65% of adults use social networking sites. Our chart shows the increases by age group.
Ninety percent of those between 18 and 29 use social media, which is not a surprise. Those social media users who are 65+ has more than tripled from 11% in 2010 to 35% in 2015. The report includes data about social media use by various demographics including income, race, gender, community, and education.
Full Analysis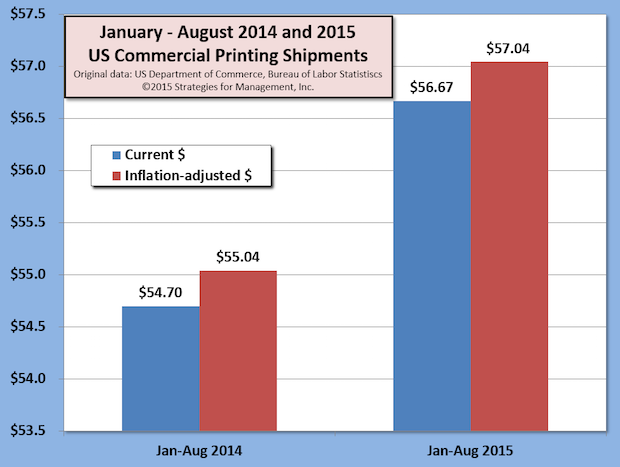
Commercial Printing Shipments in Uptrend: 15 Consecutive Months of Growth, Best Growth Rate Since 1996
Published: October 14, 2015
US commercial printing industry shipments are up for 15 consecutive months compared to the same month of the prior year. Full Analysis
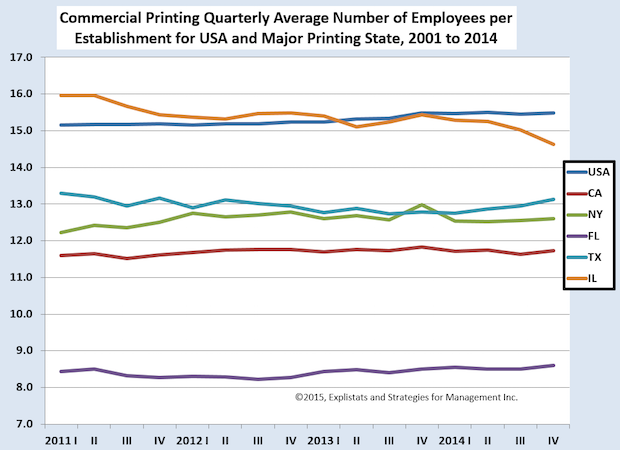
Changes in Commercial Printing Employment by State
Published: October 8, 2015
The chart shows the changes in the average number of employees per establishment in the US and large printing states. The average size of printing businesses in an area offers clues to the kinds of printing produced there and the history of the industry in that area. Full Analysis
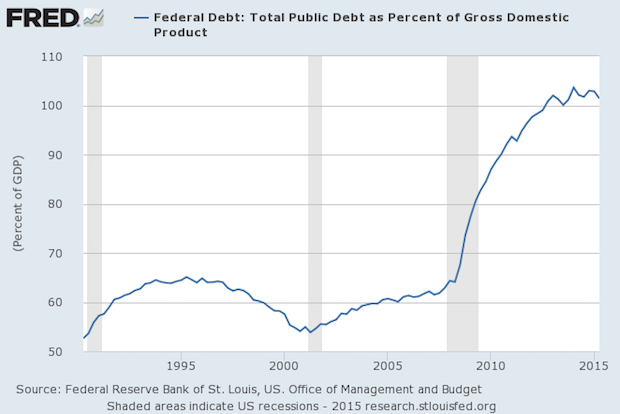
Debt as a Percentage of GDP
Published: October 2, 2015
Many people confuse debt and deficit when they see it as part of the Federal government's annual budget. Deficit is the annual shortfall between a government's spending and its revenues. Debt is the accumulation of all of the deficits and surpluses of the prior years in that government's history. Full Analysis
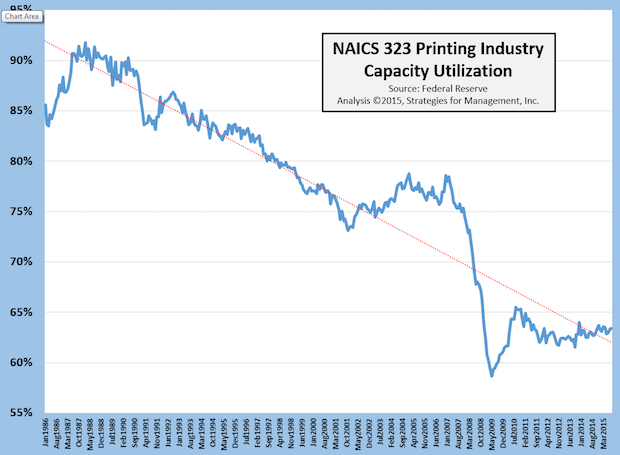
Updated Printing Industry Capacity Utilization Data – Not What Everyone Thinks It Is
Published: October 1, 2015
Even in the industry's most profitable and growing years, the mantra “there's too much capacity in the industry” was always heard. It's been a misplaced and inaccurate portrayal of the business, yet it persists. Full Analysis
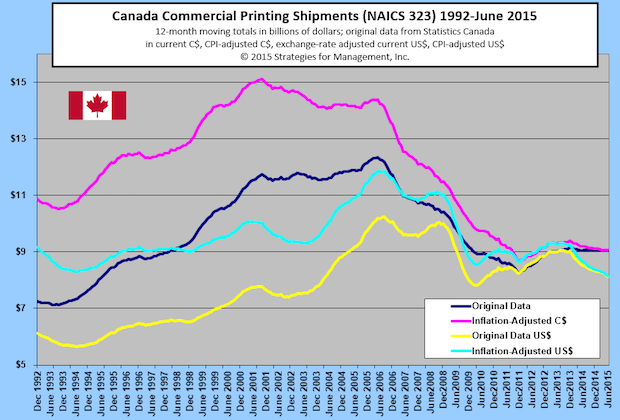
Canada's Commercial Printing Shipments
Published: September 17, 2015
Canada's commercial printing industry had a small rebound more than three years ago, before that of the US, and has been on a somewhat steady course since. In US dollars, however, Canada's gains market have been erased recently with the stronger dollar. Full Analysis
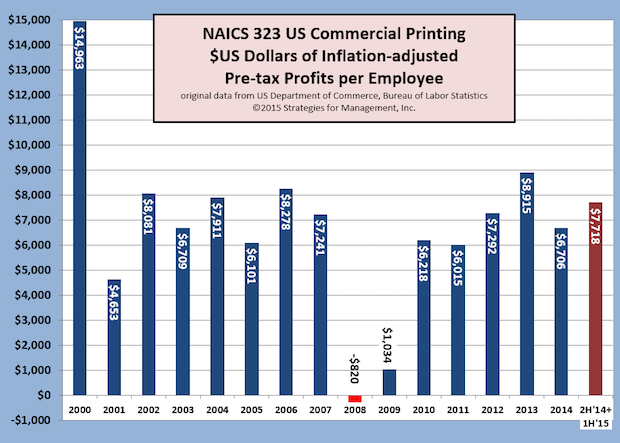
Profits Per Employee Increase
Published: September 10, 2015
The nearly $15,000 profit per employee of 2000 may not be in the cards for the US commercial printing business any time soon, but it looks like this measure is headed to its second best performance since the end of the recession. Using the latest data for the second quarter of 2015, and adding the previous three quarters to create a full year, profits per employee seem to be headed to $7,700, a thousand dollars more than the level of 2014. Full Analysis
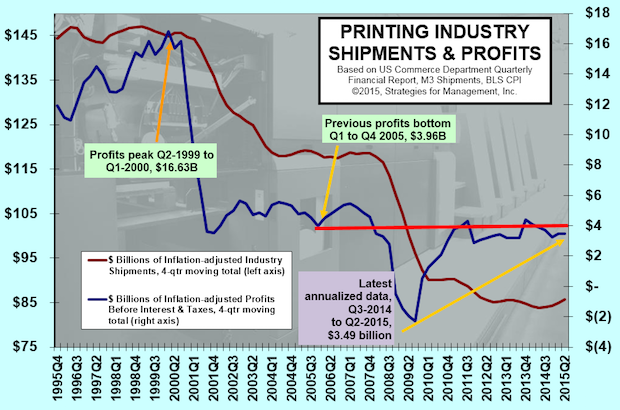
Improvement in Industry Shipments, Profits Improvement Elusive
Published: September 9, 2015
The 4-quarter moving total of inflation-adjusted US commercial printing shipments have been increasing, but unfortunately profits have not. Q2-2015 four-quarter shipments are up +2.3%, but profits are unfortunately down for the last four quarters -10.8%. Full Analysis
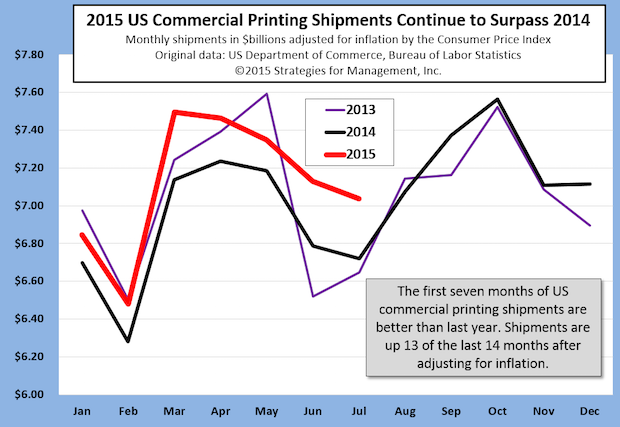
Latest Printing Shipments Reflect Rebound
Published: September 3, 2015
July's inflation-adjusted US commercial printing shipments continued to outshine prior year shipment levels. This was the best July since 2008 on a current dollar basis and since 2010 on an inflation-adjusted basis. On average, monthly industry shipments have been about $200 million higher than the year before. They are also tracking closer to GDP growth rates, a feat the industry has not done for almost two decades. Full Analysis
Recovery Indicators Mixed with Slight Downward Bias; Sluggish Economy Remains
Published: September 2, 2015
Four of the six recovery indicators fell last month, but the non-manufacturing new orders indicator remained very strong. World markets had a rocky month, and the NASDAQ fell -7% since the last indicators. Full Analysis
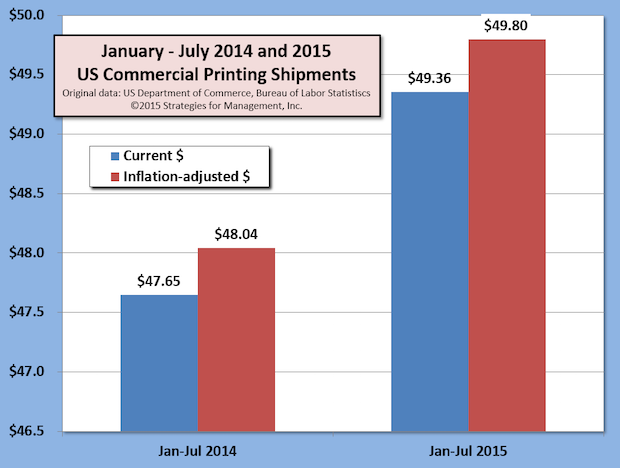
US Commercial Printing Shipments Up for 14 Consecutive Months
Published: September 2, 2015
US commercial printing shipments were nearly $7.04 billion in July, a $392 million increase (+4.9%) on a current dollar basis compared to 2014. This was the strongest July since 2008. Full Analysis
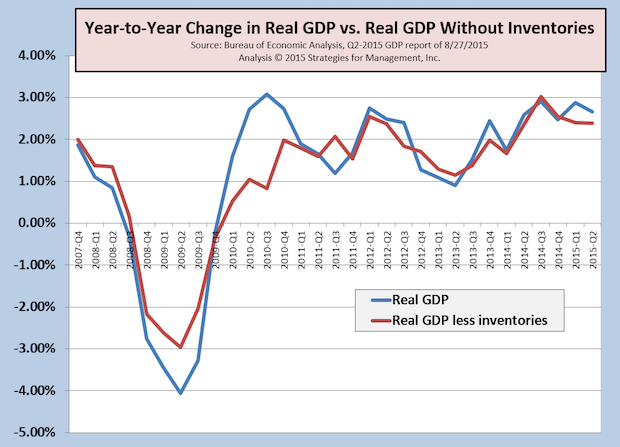
Q2 GDP Revised Up, Bigger Rebound from Q1... But What's Ahead?
Published: August 27, 2015
The first report of Q2-2015 real GDP was +2.3%, and now it's been raised to +3.7%, well ahead of forecaster expectations. On a longer-term year-to-year basis, the growth rate is +2.5%, still almost a full percentage point below post-WW2 average.
Longer term rate +2.5%. The effects of inventory increases is still a major factor in the growth, but there were other positives in the report implying that Q2 was broadly better than originally thought. There are concerns among professional forecasters that the inventory buildup will result in slower growth as those stockpiles are reduced. Considering that two thirds of the third quarter is almost complete, we know that international trade is being disrupted by currency and solvency issues in China and other countries. The Federal Reserve Bank of Atlanta GDPNow estimates that third quarter GDP will be at +1.4%. Please also note a recent chart where we showed important key indicators that have yet to surpass their recession levels from Q4-2007.
Full Analysis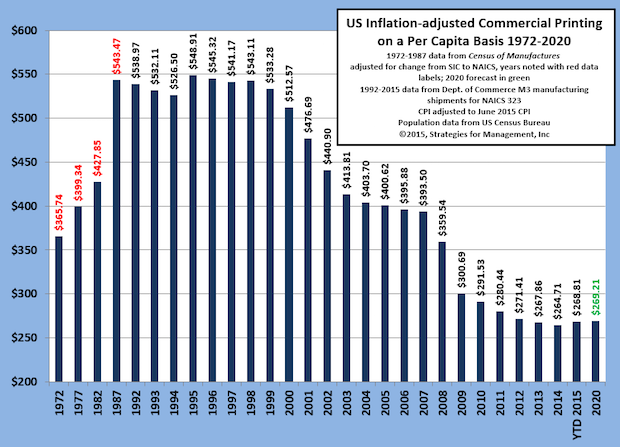
Per Capita Commercial Printing Shipments Stabilize; Forecast Models Project Levels to Continue
Published: August 20, 2015
The per capita value of US commercial printing shipments has stabilized at nearly $270, and the recent change in the direction of shipments in the last year or so has changed the forecasts. Forecast models place heavy weight on recent history, and that fact has changed the forecast for 2020 to remain at current levels. It was not long ago that the models forecast 2020 consumption at near zero, an unlikely outcome, but one worth pondering. Will shipments stay at these levels? That's unlikely, too, as media formats and loyalties are still changing.
Full Analysis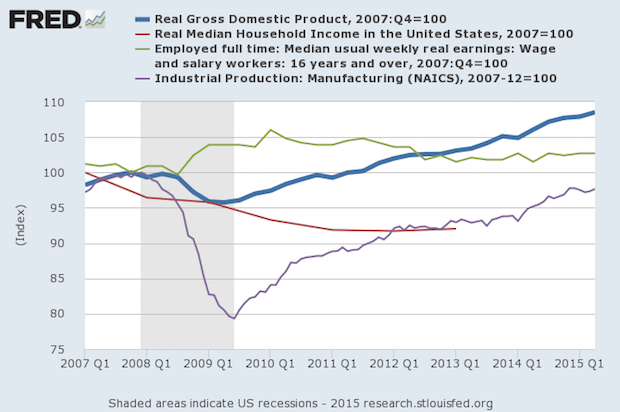
Key Indicators that Have Not Improved Since the Recession and Recovery
Published: August 14, 2015
There are numerous data series that explain that the economy has never recovered from the recession. These are not obscure data series, but mainstream ones. Gross Domestic Product should be the standard for determining the status of an economy (thick blue line). Movements in GDP should be confirmed by other measures. This week's chart uses the start of the recession, December 2007, as the base, which is 100. Full Analysis
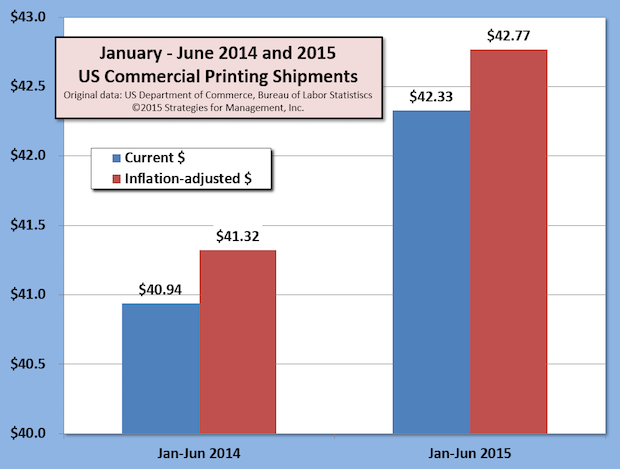
US Commercial Printing Shipments +3.5% for First Half of 2015, Exceeding Real GDP Growth
Published: August 6, 2015
US commercial printing shipments are up about +3.5% for January to June compared to the same period in 2014. The industry has been restructuring, as employment continues to decline. Usually employment and shipment levels move together in a tight range if not almost in lockstep. Full Analysis
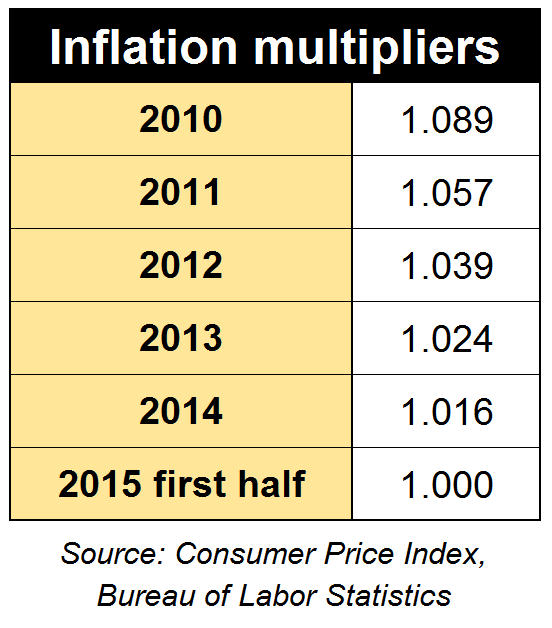
Inflation Multipliers Updated
Published: July 30, 2015
Inflation is supposedly tame, but if you're making comparisons of current year financial data to prior years, you still need to adjust for the years when inflation was not. The chart was created from Consumer Price Index data for each of the years specified. When looking at your company history, multiply your data for each year by the multiplier specified. This will give you an approximation for the effects of inflation on your business, and make your historical analysis, especially in the process of budgeting, to be more realistic. Adjusting your data, even in periods of claimed low inflation, creates a sense of more urgent action. Inflation means that to stay at the same level you actually need more dollars. Staying the same is actually a cut. Full Analysis
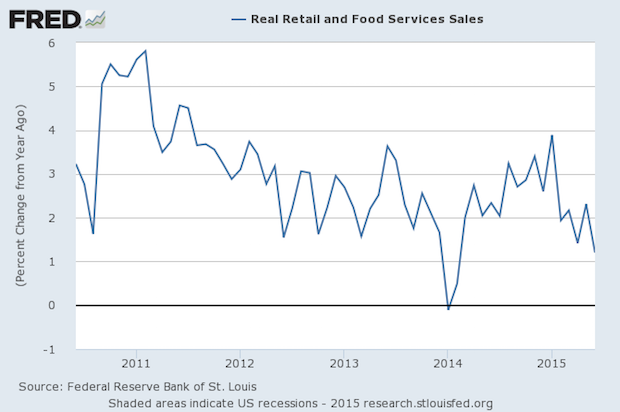
Year-to-Year Real Retail Sales Peaked in January, and Are Weaker Since
Published: July 23, 2015
June retail sales adjusted for inflation fell -0.6% compared to May. Month-to-month changes are somewhat volatile, so it's better to look at the comparisons to the prior year. The chart shows that June retail sales were +1.2% compared to last year, the worst comparison since March 2014. There are signs that the economy is slowing again. In the first quarter, real retail sales were +2.6% compared to the prior year, but this second quarter is only +1.6%. The economy always has conflicting positive and negative data, but this downturn in a key sector of the economy is likely to raise some eyebrows among economists and policymakers. Full Analysis
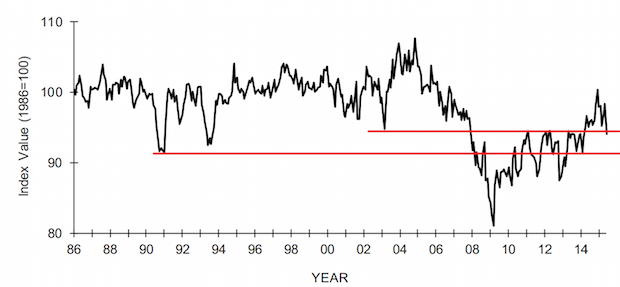
Is Small Business Slowing Down Again?
Published: July 22, 2015
The NFIB Small Business Index was released this week, “The weakness was substantial across the board, showing no signs of a growth spurt in the near future,” according to Bill Dunkelberg, NFIB Chief Economist. “Declines in spending plans accounted for 30 percent of the Index decline, and weaker expectations for real sales and business conditions another 20 percent. The deterioration in earnings trends accounted for about a quarter of the decline.” Full Analysis
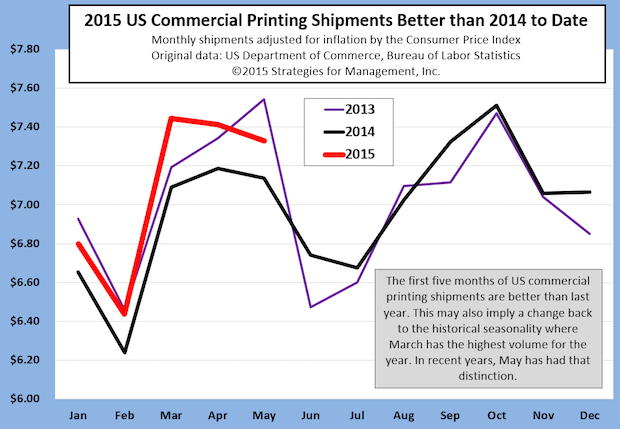
Inflation-adjusted US Commercial Printing Shipments Better than 2014
Published: July 10, 2015
Commercial printing shipments have been much higher than they are in today's market, but the bounce off the lows of 2014 this year have been notable. The comparisons toward the end of 2015 will be harder to top since the industry started to show this bounceback at the end of 2014. The transformation of commercial printing businesses has been an arduous one, with volume declines of many mainstream products, but a rise in specialty applications. Those new applications are often based in digital printing, such as wide format specialties. There's also a new generation of print business managers who are not burdened by the myopia of history, where print was paramount. These executives and owners have grown up with computers and gadgets and have a better sense of print's new role in media communications Full Analysis
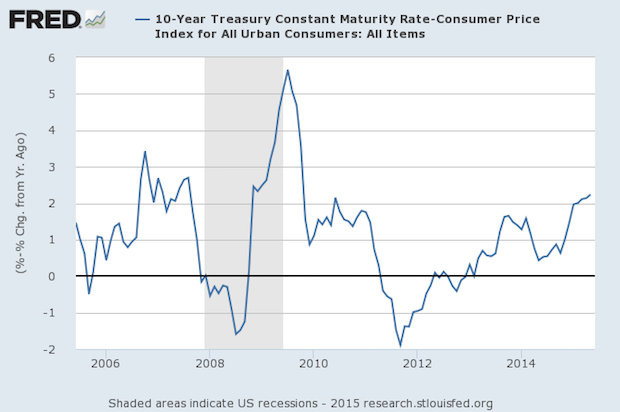
Interest Rates Have Rising Since the End of 2011
Published: June 25, 2015
We all know how the markets seem to panic when the Fed hints that rates will be rising soon, but they already have. That is, the markets have been pushing up the inflation-adjusted 10-year US Treasury since September 2011 by 420 basis points (4.2 percentage points). The rate is now the highest since June 2010, at 2.33%. This measure can be volatile because of the inflation adjustment. We used the year-to-year inflation rate as measured by the Consumer Price Index for that reason. There are Fed governors who believe that they have great latitude to be patient with a rise in inflation since their target of +2% annual inflation has not been met. This means that they believe they have a cushion of “banked” uncreated inflation that they can use up before they move aggressively. Whatever the case, a 25 basis point rise in short term rates is not much, as they might actually be catching up to the marketplace that has already moved and the Fed is already lagging well behind it. They miss an important point. The CPI does not measure inflation in a practical way. If wages are stagnant (though a little better lately), a “mild” 2% rise can be a burden. Median household income is still 4% lower than its peak just after the recession started. A 2% rise in inflation plus the 4% lower income is a 6% difference. That's something that's rarely mentioned in the business press. Full Analysis
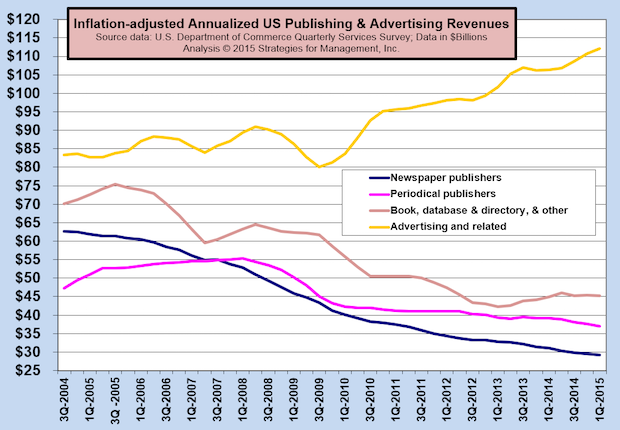
Ad Agency Revenues Still on the Rise, Up 40% Since Start of Recovery
Published: June 18, 2015
Since the start of the recovery all the way back in mid-2009, advertising agency revenues have increased by +$32 billion, +40% since that time. There are many economic indicators that have never recovered (such as full time jobs) but ad agency revenues have blown through the pre-recession high of $91 billion and is now running at the rate of $112 billion annually. The agencies have had this performance because they are immersed in the media upheaval, riding and stoking the changes in communications formats on behalf of their clients. Wages have followed this shift in media, and has been documented by us before. The average public relations pay is about $10,000 more than the averaged of all agency wages. Book publishing industry revenues have stabilized, and trends of newspaper and periodical publishing revenues are still down, but at a lesser rate. Full Analysis
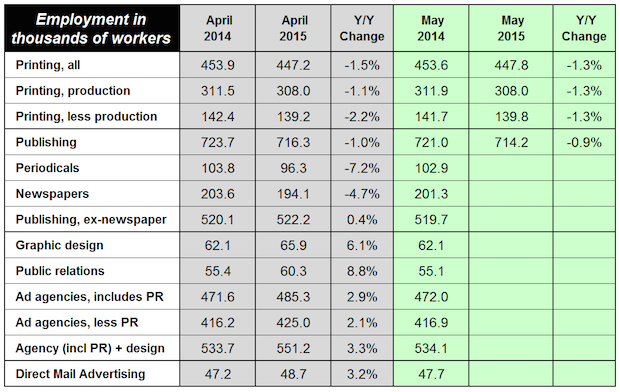
Latest Employment Data in Printing and Content Creation Markets
Published: June 11, 2015
In spite of recent strength in US commercial printing industry shipments, employment is still on a downward path. The industry seems to becoming more efficient, somewhat from better management, and somewhat from consolidation as weak establishments are aborbed or exit the market. Compared to April, however, the Bureau of Labor statistics estimates that employment increased by about 600, which is common compared for May in recent years. The April public relations employment was very strong compared to the prior year and is up +8.8%. When PR employment is excluded from ad agency employment, the number of employees in agencies is still up +2.1%. The employment data have always reflected the changes in the media market as well as the strength in the economy. Though the economy is slow, advertising agencies have reinvented themselves and are very active in social media and digital media production. Full Analysis
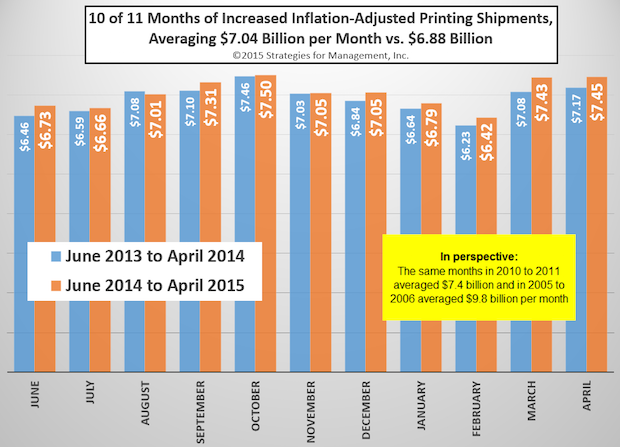
10 of 11 Months of Increased Inflation-Adjusted US Commercial Printing Shipments
Published: June 4, 2015
This chart shows how the US commercial printing shipments have been better compared to the prior year for the last 11 months of reporting by the Commerce Department. What's it mean? We're still averaging $400 million per month less than a similar period in 2010-2011, and we're well below the levels of ten years ago by about -$2.8 billion per month. The recent stability may be the result of several factors. First, weak companies are gone as a result of closures and consoPrinting Shipments Rising, Best April Since 2010lidations, leaving companies that know what modern print users need. Second, there has been a generational change in management to owners and executives who are more comfortable with digital technology because they have always used it, growing up with cell phones, video games, and computers everywhere. Third, the big targets for displacement by digital media have been pulverized, and what remains are specialties and applications more appropriate to a multichannel integrated media marketplace. Fourth, there a more companies using business development techniques (tell us about your target audience and how we can make your digital initiatives more effective) rather than old sales techniques (would you like to see my equipment list?). Then again, it could be the calm before another storm. New data networks are on their way, such as 5G, where two hour movies can be downloaded in six seconds rather than six minutes. Print has a good story to tell, but please, don't make it an old story. Print needs to be fresh and new. The market may be stable now, so use this time well to get ready for the market ahead. Full Analysis
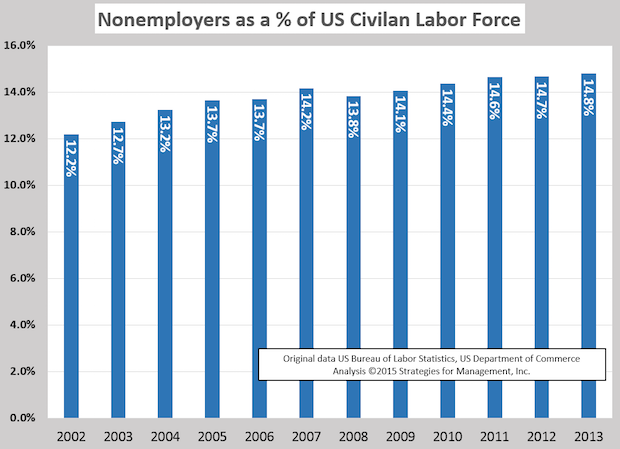
Microbusinesses Increasing as a Percentage of the Workforce
Published: May 28, 2015
The Commerce Department released its “Nonemployer Statistics” data for 2013, showing that these businesses increased to 23 million since 2012, and by 30%, three times the rate of population growth, since 2002. Let's call them “microbusinesses.” They are now more than one in seven of the workforce. Full Analysis
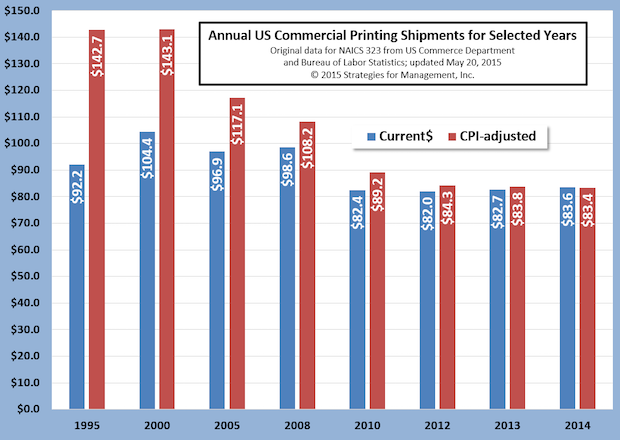
Revised Annual US Commercial Printing Shipments Show Stability in Recent Years
Published: May 21, 2015
Last week, the US Department of Commerce released its annual revisions to manufacturing shipments. Printing shipments estimates were increased a total of approximately $10 billion combined for 2013 and 2014. The data softened the decline in 2013 shipments by a considerable margin and also reaffirmed the recent rise in printing shipments over the last ten months. While shipments in 2014 were still below 2013 on an inflation-adjusted basis, the pattern of the last few years shows a decline in shipments that is more muted than the Commerce Department originally reported. Our advice is the same: this is breathing room that can be used for restructuring of print businesses with forward-looking strategies that can take advantage of the next waves of communications technologies, while implementing sales and marketing processes that are appropriate for the times ahead. Full Analysis
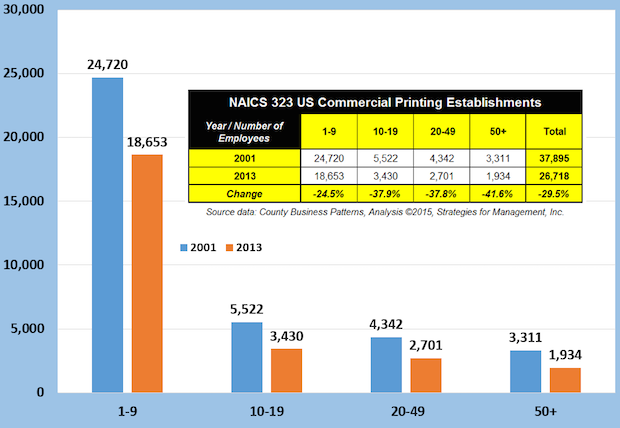
NAICS 323 US Commercial Printing Establishments
Published: May 14, 2015
These data about US commercial printing establishments are from the newly released 2013 County Business Patterns published by the Bureau of Labor Statistics. At the turn of this century, there were nearly 38,000 establishments engaged in commercial printing and services; in 2013 there were nearly 27,000. These data do not include inplant printing departments or packaging, but do include label printers and trade services. An establishment is a separate location in a practical definition, and a firm can own more than one establishment. The number of establishments is in response to the size, scope, and nature of overall print demand, but there are other factors.
Full Analysis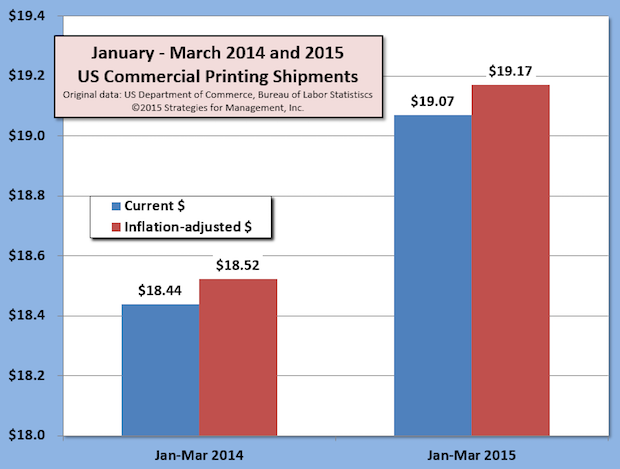
First Quarter US Commercial Printing Shipments Up +3.5% Versus 2014
Published: May 8, 2015
The last ten months of US commercial printing shipments have increased +3% compared to the same months of the prior years. For the first calendar quarter, shipments are up +3.5% compared to the same quarter of 2014. There has not been this kind of growth for about ten years. Please note, however, that the Commerce Department is revising at least three years of historical data next week; it's not possible to determine how the data will change. Assuming the pattern of these data remain the same, it's not a long term bottoming of the shipment level that will turn upward again. The march of digital technologies that offer alternatives to print will continue (read what 5G networks will bring in 2020, for example). It's more likely a pause that should be used to reposition well-running print businesses for the future, consider investing in capabilities and businesses that will take advantage of the new communications innovations ahead, and develop alliances with others whose talents will be needed to do so. This might be 2005-2007 playing out again for us. If your business is growing, don't rest on your laurels. Appreciate the flexibility your business has to prepare for the future and use the time wisely. Never hunker down and wait for things to play out. Full Analysis
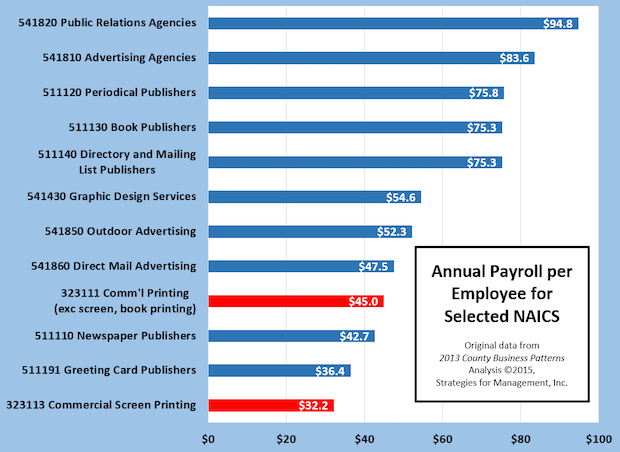
Payroll per Employee for Commercial Printing and Content Creation Businesses
Published: April 30, 2015
The 2013 County Business Patterns report was just released by the Bureau of Labor Statistics, one of the most valuable of all government economic reports. The data are based on Social Security tax filings made by employers. In this manner, the BLS can count the number of business establishments and the number of employees of those establishments with great accuracy from analysis from the mandatory filings of Form 941, submitted with company payroll taxes. As the data show, content creation businesses have much higher per employee annual salaries. This makes these industries very attractive to new employees, especially those starting their careers. The most interesting to me is the rise in public relations agencies. In the late 1980s, the payroll for ad agency workers was about one-third more than public relations. In 2005, they were about the same. In these 2013 data, PR employees are paid about one-eighth more. Full Analysis
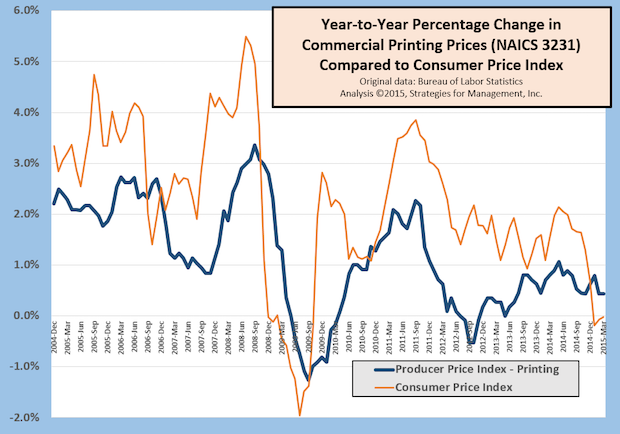
Printing Prices Compared to General Inflation
Published: April 23, 2015
The Bureau of Labor Statistics publishes many indexes of inflation, the best known of which is the Consumer Price Index. The BLS also publishes hundreds of other indexes in the Producer Price Index (PPI) series that track price changes in industries, products, and commodities. This week's chart shows the year-to-year change in CPI (orange line) and the PPI for printing (blue line) on a monthly basis for a little more than ten years. For most of that period, printing prices have lagged consumer prices, often by wide margins. Since December 2004, printing prices are up +14% while consumer prices are up +27%. That is, printing prices are increasing at about half the rate of consumer prices. Or, looked at differently, printing prices are about -10% less than the change in consumer prices: print is getting cheaper every day. But print owners and their workers cannot spend printing dollars when they go to the supermarket; they have to make up for the 10% shortfall in prices somehow. This is difficult since many of the prices printers need to pay for wages and materials more closely follow consumer prices. It's a double-edged problem: lower revenues, higher costs. Profit leaders have figured out how to survive in this environment as they still stand out from their peers. But these double-edged pressures have caused weak companies to leave or offer themselves as consolidation candidates. Full Analysis
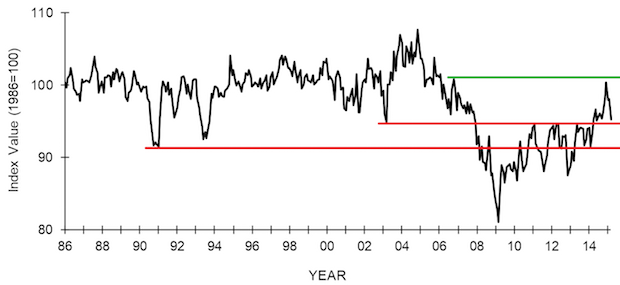
NFIB Small Business Index Falls
Published: April 16, 2015
The monthly NFIB Small Business Index took a step back after it nearly reached the pre-recession high. The chart shows that high of a few years ago as a green line. The index fell almost to the bottom of the 2003 recession level. For a few years the Index seemed range-bound between that recession and the lows of the recession of the early 1990s (the two red lines). This particular survey had all ten elements of its index fall, which is highly unusual. The Index bears watching as there are very few data series that follow small business activity. Full Analysis
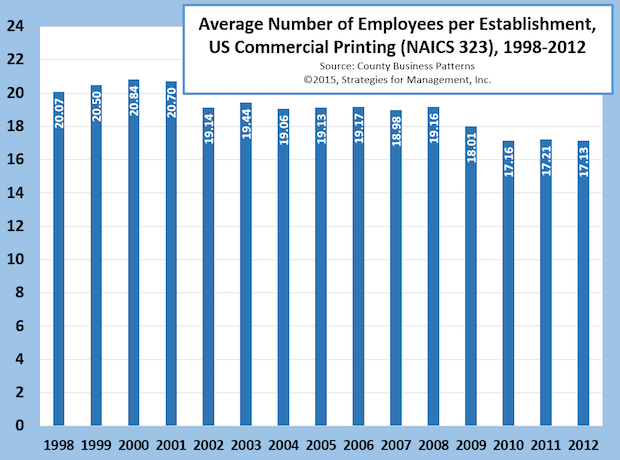
Number of Employees per US Commercial Printing Establishment
Published: April 9, 2015
The average number of employees in commercial printing establishments has declined over the years for many reasons. Among large printers, volumes of magazines, catalogs, inserts, and other long run length products produced on web offset and gravure presses have declined, leading to plant closures and consolidations. Desktop publishing shifted work to graphic designers, publishers, and other content creators. That, combined with direct-to-plate and digital printing have nearly eliminated the need for prepress departments. Presses require less staffing than older ones. In smaller printers, copies and digital printers have reduced the need for press operators. Other technologies, such as search engines, e-commerce, advances in administrative software have reduced employment in other functions. Even voice mail, cell phones, and e-mail have gradually reduced the number of staff required to run a printing business. Full Analysis
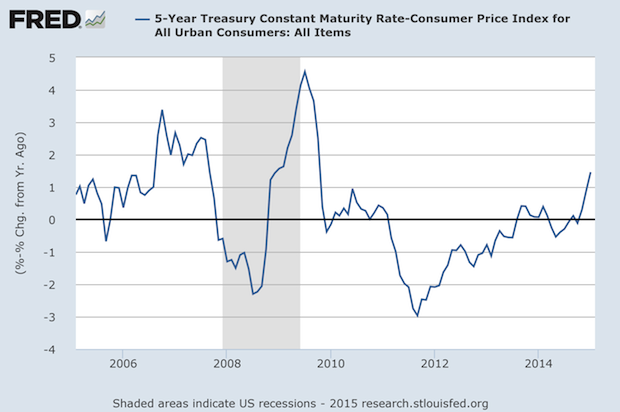
Real Interest Rates are Rising, Thanks to Low Inflation
Published: March 26, 2015
The chart shows one of the rates for Treasury securities called the “constant maturity rate,” used to set rates for instruments like mortgages. The line in the chart is that monthly rate less the year-to-year change in the Consumer Price Index for that month. The Fed has worked hard to keep their interest rates below inflation to stimulate the economy, as well as make housing prices rise so that fewer mortgages were “under water.” It hasn't worked that well, but that's a different topic for a different day. But with all of the worries about the Fed raising rates, the combination of their inertia and changes in the inflation rate may be producing what they've wanted: a Seinfeldian case of “nothing” becoming something. At the end of 2011 the real rate in the chart was -3%, and the last observation in the chart is about +1.5%, a 450 basis point move. For about three years, the CPI has been below the Fed's target of 2%, and in December and January it was negative. February CPI was just reported as an annualized 2.4%, so this rate rise may disappear soon Full Analysis
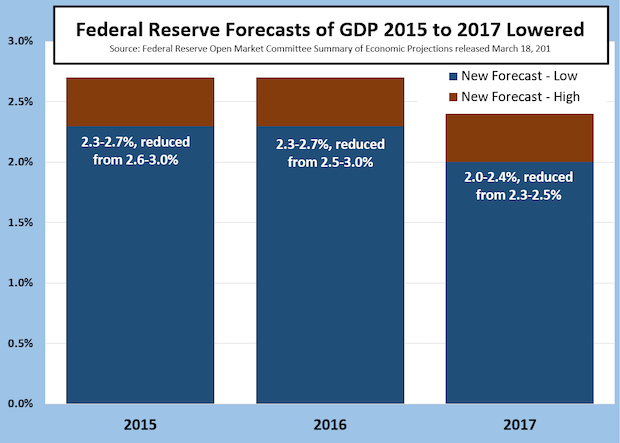
While The World Listens for a Rate Hike News, the Fed Lowers Their GDP Forecasts
Published: March 19, 2015
On Wednesday, March 18, the Feb removed the word “patient” from the announcement of a potential rate hike, but as the Washington Post explained “Well, the Fed really said that it's going to be more patient than it was before, even if it's not officially so. In other words, it could hike rates at any time starting in June, but it's less likely to do so. And even when lift off does happen, it'll probably happen slower than people thought it would.” There you have it: Janet Yellen does a great Alan Greenspan impression. No one knows what he meant but everyone knows what he said. Dr. Yellen also explained that while the Fed is no longer in the act of quantitative easing, they are replacing all of their holdings as they mature. What got less coverage is that the Fed lowered their forecasts of GDP. For 2015 and 2016 they lowered their prior forecasts by three-tenths of a percentage point. Each tenth is about $150 billion. So their forecast was reduced by $450 billion, or the equivalent of six commercial printing industries. Such data analogies can make one's head spin. Full Analysis
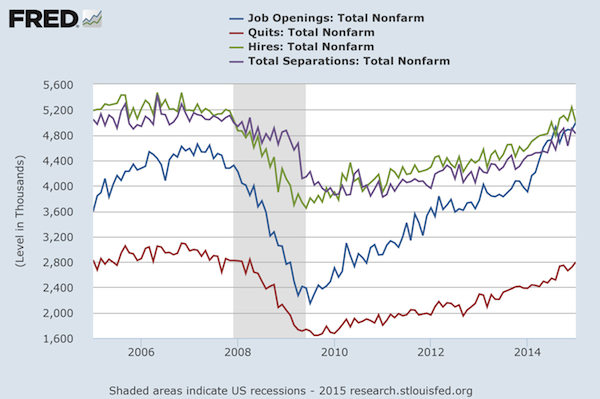
The Labor Market is Very Dynamic
Published: March 12, 2015
Don't let four jagged lines on a chart confuse you, because there's good news hidden inside. The labor market is very dynamic, more dynamic than commonly understood. About 2% of the workforce quits jobs every month, and between 1.5%-2% separate from their positions in other ways because their projects are completed, fired for cause, or downsizings. About 3% of the workforce is hired in different positions every month. What's made the improvement in total employment this past year is the increase in job openings (the blue line in the chart). Note that it has a higher upward slope than the other lines. The number of job openings is now around 5 million per month, more than double that when the recovery started in mid-2009. The bottom line, in red, is “quits.” Most workers do not quit their jobs unless they have something better lined up. That line has a general upward slope, and it is common for this to increase as economies improve and workers feel more comfortable changing positions. Though not population-adjusted, the lines are definitely moving in positive directions, with job openings as the most encouraging of them. What's this mean to printers? Never consider your business contacts in companies as “safe.” As economies improve, job changing increases. Be sure to have multiple engaged contacts in your most important clients. Also, be sure your key employees are kept “gruntled” because disgruntled key employees can be valuable elsewhere. Full Analysis
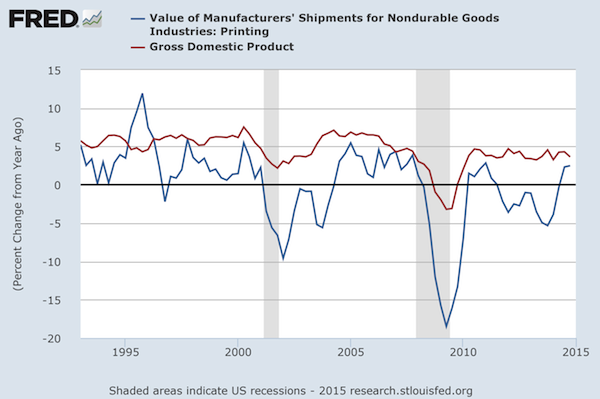
Current Dollar GDP and NAICS 323 US Commercial Printing Shipments
Published: March 5, 2015
There is a general (and natural) assumption that commercial printing and the economy as measured by GDP move together. The chart below shows the year-to-year percentage change of the two data series, GDP in red and printing in blue. The chart tracks current dollars and are not adjusted for inflation. Except for a brief period from the second quarter of 1995 through the first quarter of 1996, shipments have lagged GDP growth. What was special about that period? The Internet bubble was beginning, and in September 1995, Netscape had its initial public offering. For those four quarters, commercial printing was an average of 4.5 percentage points better than GDP growth. Prior to that, commercial printing had lagged GDP during a period of slow economic growth. Since Q2-1996, the difference between nominal, unadjusted GDP and commercial printing has been 5 percentage points. The last two quarters of 2014 commercial printing had positive growth compared to the prior year, but still lagged GDP by -1.6 percentage points. Full Analysis
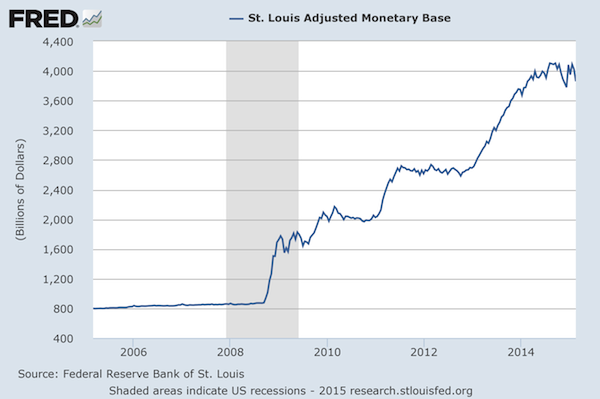
St. Louis Adjusted Monetary Base (The Fed's Balance Sheet)
Published: February 26, 2015
The Fed stopped Quantitative Easing a while ago, and the value of its balance sheet fluctuates around the $4 trillion level. As their holdings mature, their aggressive position in the bond market will slowly unwind. Or will it? The Fed is likely to decide to re-invest proceeds in more bonds and obligations, replacing the matured debt with new ones, but not adding to their overall position unless there is a crisis again. Until their first moves where they doubled their balance sheet quickly, from $800 billion to $1.6 trillion, this measure of the money supply moved steadily at about a 6% annual rate, sometimes a little more, sometimes a little less, about half equal to economic growth and the other half to inflation. Whether or not the Fed will reduce its balance sheet or not is still a question in my mind. They could just hold steady, and let inflation and growth catch up to them, which will take quite some time, but not scare the markets. But something always happens that's not according to plan, and the Fed will be interesting to watch as they move from this unchartered territory to another. Full Analysis
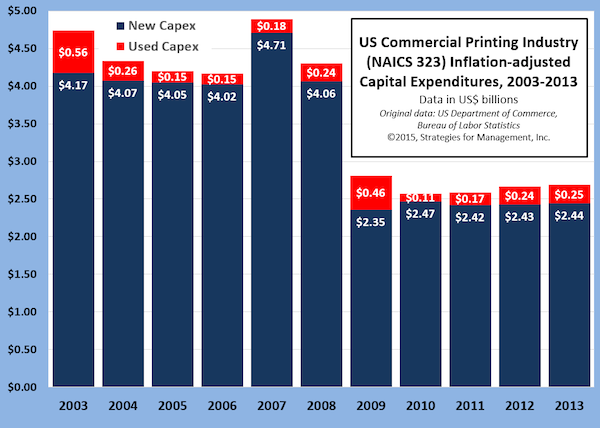
Printing Industry Capital Investment, 2003 to 2013
Published: February 20, 2015
The US Department of Commerce issued their latest report about capital investment spending in 2013, and we've written about it in a recent blogpost. As part of our analysis, we applied the rate of investment to industry shipments and arrived at the chart below. It shows two rather distinct periods, 2003 to 2007, where capital investment was not as good as the late 1990s, but recovered and stabilized after the first negative wave of digital media. Some of this was replacement of late 1990s equipment that had come off lease. Then there's the 2008 credit crisis and recovery. Capital investment declined in volume as industry shipments fell from the introduction of social media, new devices, and cheaper and faster communications. But the rate of capital investment is slowly rising, even though shipments are shrinking, and the number of plants is contracting. The survivors tend to be healthier establishments, who survived the downturns, and are likely making better investment decisions. Full Analysis
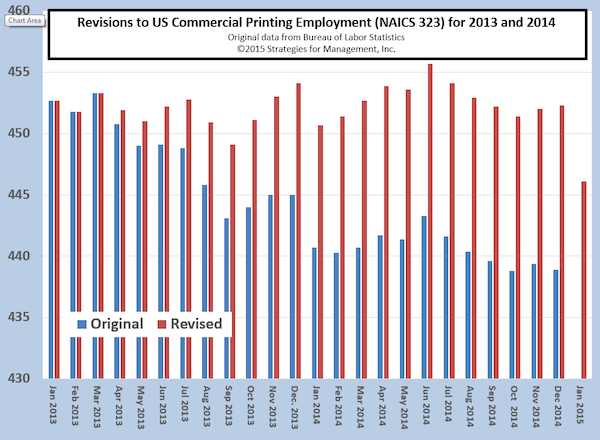
Printing Employment Data Revised Up in 2014
Published: February 12, 2015
Every February, the Bureau of Labor Statistics (BLS) updates employment data for the prior year and beyond. This year, the revisions to printing industry employment went back to April 2013. When the BLS calculates employment, especially for industries, it uses estimation methods because actual data are not readily available. That actual data are derived from the Social Security tax filings of employers. In this case, the BLS was underreporting employment, especially in mid-2014. Employment data are used as an input into Commerce Department data for the estimation of industry shipments. Those new employment data, though not released publicly, were probably used in recent months shipment calculations when 2014 shipments began to have favorable comparisons to 2013. It is possible, based on these data, that 2014 industry shipments will be revised up in the annual mid-May shipment revision report. An educated guess would put the change at approximately $1 billion, bringing shipments from +0.2% in current dollars to about +1.5%, or flat with 2013 after adjusting for inflation. Nonetheless, employment in December 2014 was less than December 2013. As can be seen in the chart, January 2015 employment is reported as dropping considerably. January and February tend to be slow months, and March can be one of the best. February employment may rise in anticipation. Full Analysis
Recovery Indicators
Published: February 5, 2015
Recovery indicators in manufacturing continued to retreat in the ISM manufacturing report, in concert with news earlier this week from the Commerce Department that showed five months consecutive decline for factory orders. Non-manufacturing orders rose slightly, but imports continued to pull back. The ISM new orders for manufacturing and non-manufacturing are still above 50, which indicates future growth, but at a slower rate. The NASDAQ index was up in the last month, but is still lower than it was two months ago. Trading has been choppy, which sometimes is indicative of a developing turning point. The one bright spot in the report is a measure of small business, proprietors income, upbeat news in an otherwise tough month. Full Analysis
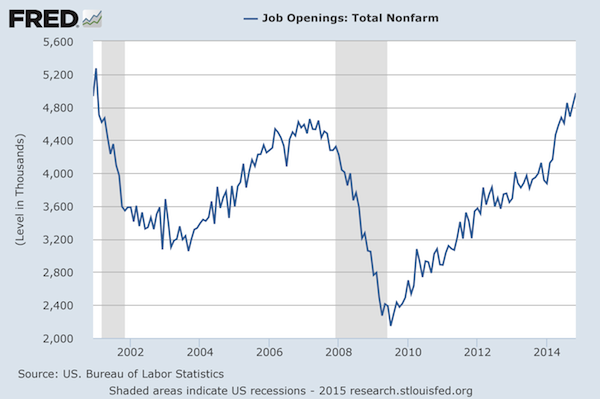
Job Openings Steadily Improving but Have More to Go
Published: January 30, 2015
The following charts show how job openings have been on a steady rise since the beginning of the recovery in mid-2009, and have now passed the recent peak when the recession began at the end of 2007. But that was a long time ago, and population has grown since that time. The 2000s have a long way to go to catch up with population-adjusted job openings since the turn of the century. Full Analysis
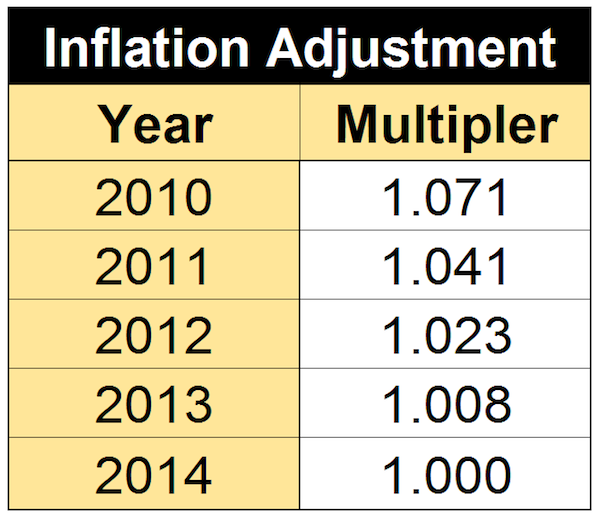
Latest Inflation Multipliers
Published: January 22, 2015
For those who have been following along, the chart below is the latest update for budget planning. It's always a benefit to understand your sales and costs in historical perspective. Without adjusting for inflation, you could be working on assumption of trends and relationships that are untrue. Make it “real.” Full Analysis
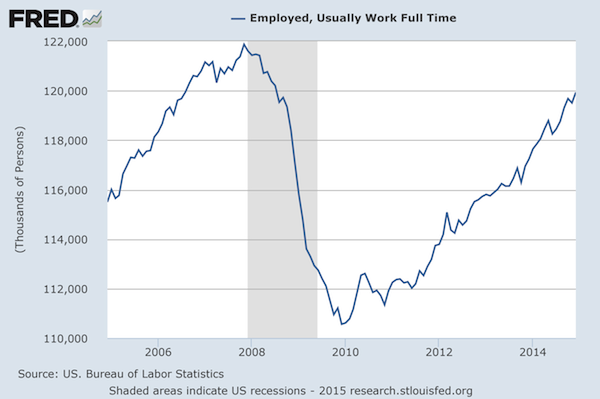
Full Time Employment Still Not Recovered
Published: January 15, 2015
The number of workers with full time jobs has still not exceeded levels at the start of the recession about seven years ago. This is despite continuous population growth and higher GDP levels for 21 of the last 22 quarters. Of last year's +2.2 million increase in employment, about 970,000 were part time positions. Many part time positions are by choice of the employee, an unknown number may be from distortions resulting from the implementation of the Affordable Care Act, and others are from uneven economic conditions and low expectations about future business conditions. There is some employment optimism in recent surveys of the National Federation of Independent Business and both the manufacturing and non-manufacturing surveys of the Institute for Supply Management. Full Analysis
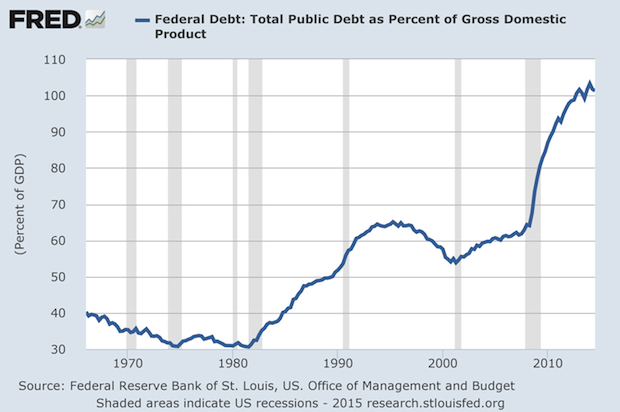
Federal Debt as Percentage of GDP Over 100%
Published: January 8, 2015
Economic press coverage of the Federal budget is usually limited to the annual deficit, the shortfall of tax and fee collections versus spending. While the deficit as a percentage of GDP is down to about -4% from 2009 when it was more than -9%, the deficits do accumulate. Now, the total debt of the US exceeds GDP. This is likely to keep political pressure on the Fed to keep rates down. It also means that a 1 percentage point rise in interest rates would cost $180 billion and can double the annual deficit. But the Fed may not be able to increase interest rates when they want to no how hard they might try. International rates, such as those in Germany, have recently been below 0.5% for the 10 year bond. US rates are comparatively high in the 2% range, and any push upward by the Fed would probably be met by arbitrage actions in the other direction. Full Analysis
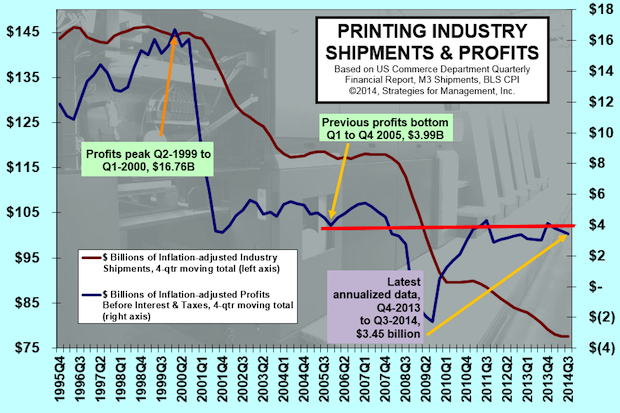
Profits Still Below $4 Billion on Annual Basis
Published: December 18, 2014
Four billion dollars was the approximate bottom of 2005's inflation adjusted annual profits. The four-quarter total annual profits have had a difficult time breaking through that level for more than eight years. Full Analysis
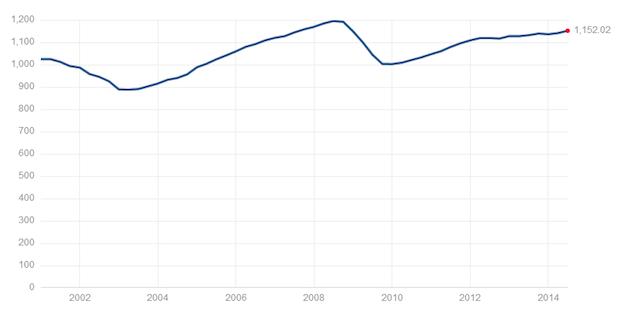
Inflation-adjusted Sales of S&P 500 Firms Still Below Pre-Recession Levels
Published: December 11, 2014
GDP may say that the recession ended in June 2009, but there are still data series that have not yet confirmed that five years later. Total employment is one of them, as is median household income, but so is the inflation-adjusted sales of companies in the S&P 500. Even though the companies in the S&P 500 index have revenues lower than the peak of June 2008, the S&P 500 stock index is getting closer to all-time high levels of Spring 2000 (The Dow Jones average already is, the Russell 2000 has been for a while, but the NASDAQ is still off by about 15%). These sales of 500 of the world's best companies have not kept up with real GDP growth since the recession ended (about 2% per year). Some economists believe that this is an indication that GDP data should be viewed with great suspicion, and that there has yet to be a true recovery. Full Analysis
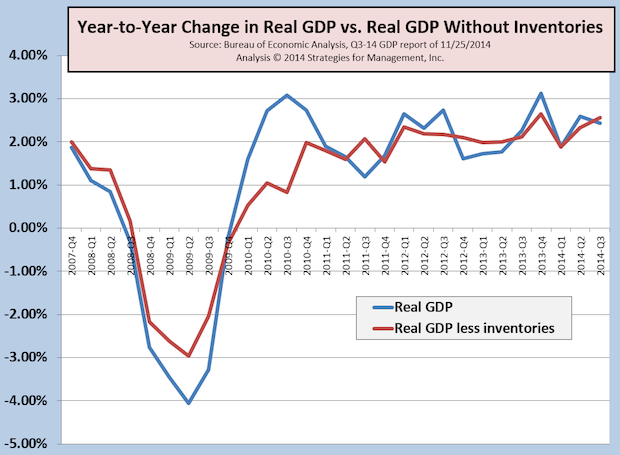
Revised GDP Pushed Higher, But Did Not Change Longer Range Growth Rate
Published: December 4, 2014
Third quarter GDP was revised from +3.5% to +3.9%, but the change was mainly in net inventories, and did little to affect the assessment of underlying and longer range growth compared to the prior year of about +2.43%. Inventories have been bouncing around a bit over recent quarters and are running a little higher than they should be, indicating that some minor correction is forthcoming, especially if non-US economies are slowing down. Full Analysis
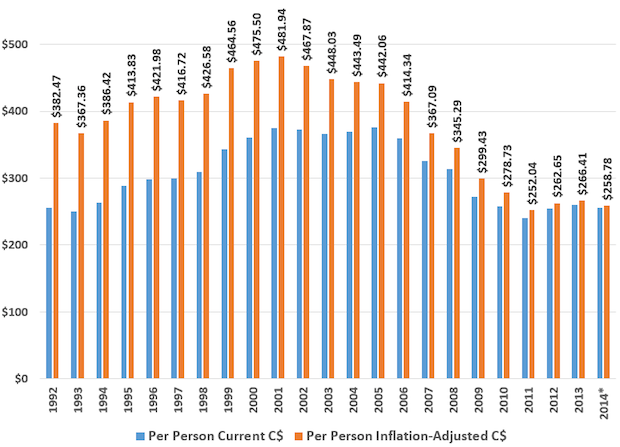
Canada Per Capita Commercial Printing 1992-2014
Published: November 14, 2014
Using printing shipments and population data from Statistics Canada, we have prepared this chart that shows per capita shipments of commercial printing in Canada current dollars and Canada inflation-adjusted dollars. Full Analysis
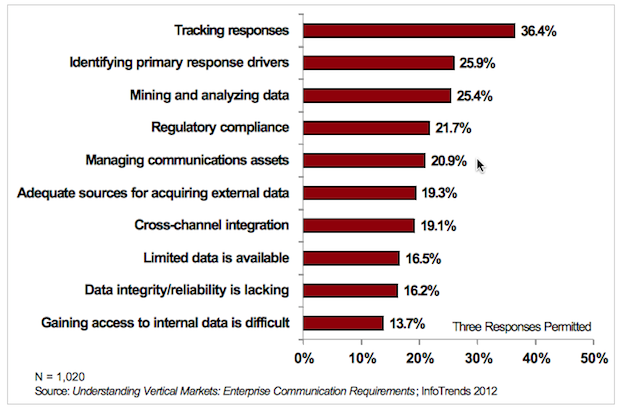
Top Challenges When Executing Personalized Communications/Campaigns
Published: November 13, 2014
InfoTrends’ study entitled Understanding Vertical Markets: Enterprise Communication Requirements surveyed over 1,000 enterprise executives. When asked about the top data challenges that they faced related to executing personalized campaigns, respondents highlighted tracking responses, understanding response drivers, and analyzing and mining data. Full Analysis
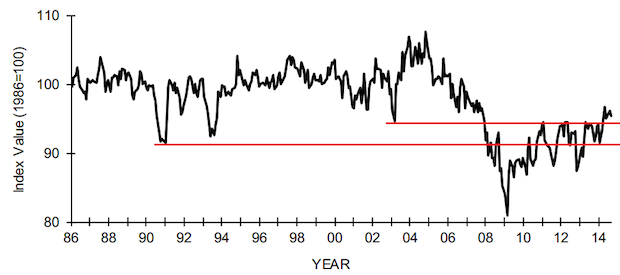
NFIB Small Business Index Retreats Slightly, But is Still on Path of Slow Uptrend
Published: October 16, 2014
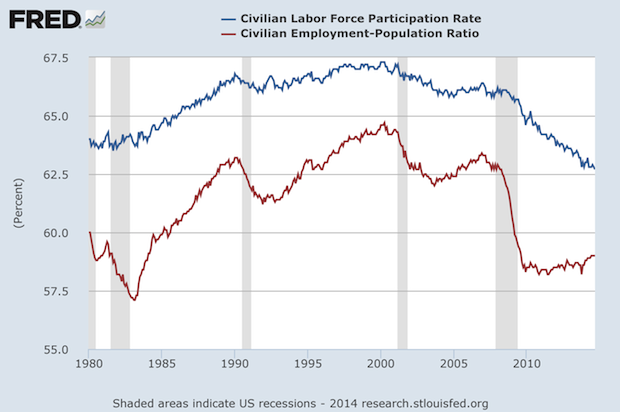
Labor Force Participation Rate and Employment-Population Ratio Below 1980 Levels
Published: October 9, 2014
What's made the economic recovery since June 2009 so intriguing has not been its below-history GDP growth rate, but also the deterioration in key measures of employment. The labor force participation rate has been declining as idled workers decide not to return to the workforce. Full Analysis
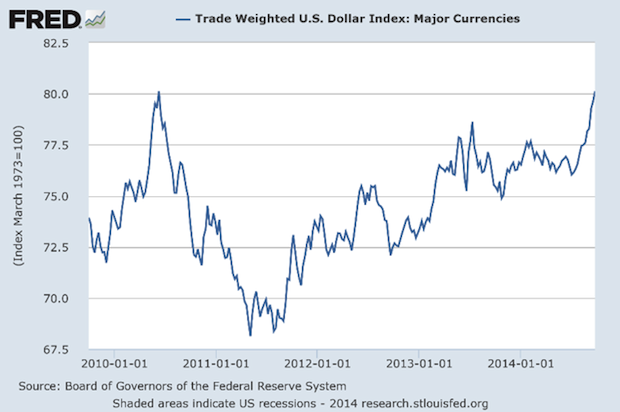
The Stronger Dollar... or Is It?
Published: October 2, 2014
There's been a lot of interest in the stronger dollar for many reasons. Some consider it a safe haven during times of global tensions. Others say it's a bounce off a bottom. Still others consider the dollar the least ugly of all the major currencies. But is it really stronger? (Two charts) Full Analysis
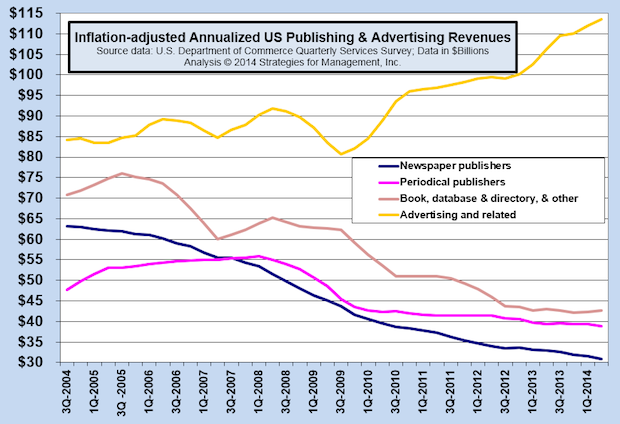
Advertising Agency Revenues Up at Annual Rate of 7% Since Start of Economic Recovery
Published: September 25, 2014
The latest data from the Commerce Department's Quarterly Service Survey shows that advertising agency revenues have climbed at the rate of 7% per year since the recovery began after June 2009. The rate of growth exceeds real GDP growth which has been +2.2% on an annual basis since that time. How did they do it? A strong emphasis on digital media strategy and production that's replaced their loss of commissions and fees for broadcast and print advertising. Publishers revenues have not come close to even that lackluster GDP rate. The steep decline for magazines and books is over, for now: they are not growing and the decline in revenues is mild. Newspapers, however, are still in long term decline. Newspaper revenues are about half of what the were in 2004. Full Analysis
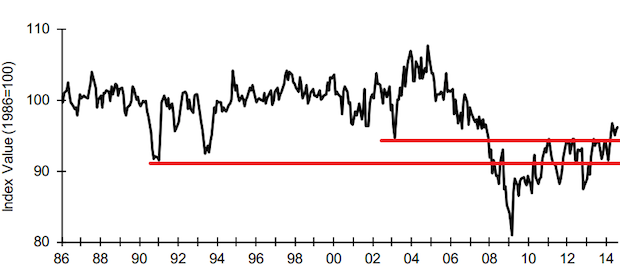
NFIB Small Business Index Breaks Through Recession Upper Range
Published: September 18, 2014
Small business seems to be improving, at least according to the NFIB monthly survey of small business owners. For years, it was usually trapped between two recession bottoms, but it has broken through of three consecutive surveys. It's an encouraging report, but it's not bullish. The NFIB commentary states “More owners still think business conditions will be worse in six months than think they will be better. Few see the current period as a good time to expand. The outlook for improvements in real sales volumes faded. Interest in borrowing continues to remain at record low levels; owners are satisfied with inventories and aren’t planning a lot of investment.” The NFIB is still in the range of a 2+% GDP growth level, but sees not robust small business activity in the near term. Basically, the NFIB report is good news in that conditions are better, but a big positive breakout in activity will remain elusive. Full Analysis
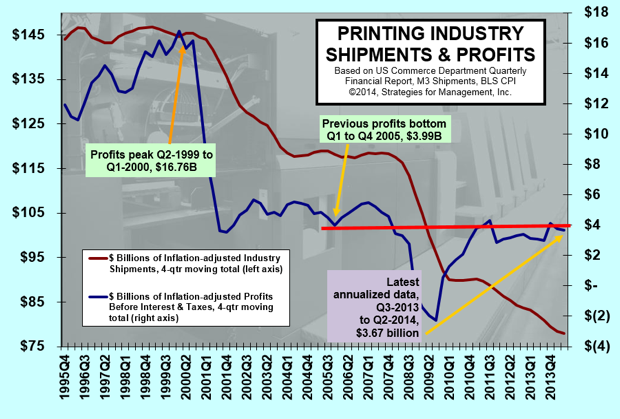
Annualized Inflation-adjusted Profit
Published: September 12, 2014
Second quarter US commercial printing profits were $1.13 billion, based on the recent Quarterly Financial Report issued by the Department of Commerce and combined with other Commerce Department and Bureau of Labor Statistics data. This was down -7.5% compared to Q2-2013. For the last four quarters, total profits were $3.67 billion, and that is +20% higher than the equivalent measure a year ago. The Q1 four-quarter moving total was revised down from $4.03 billion to $3.77 billion. Full Analysis
Sept 4th Key Recovery Indicators
Published: September 4, 2014
Dr. Joe's Key Recovery Indicators were started in 2009, and track the monthly ups and downs of the economy in terms that are relevant to small and mid-size businesses. Full Analysis
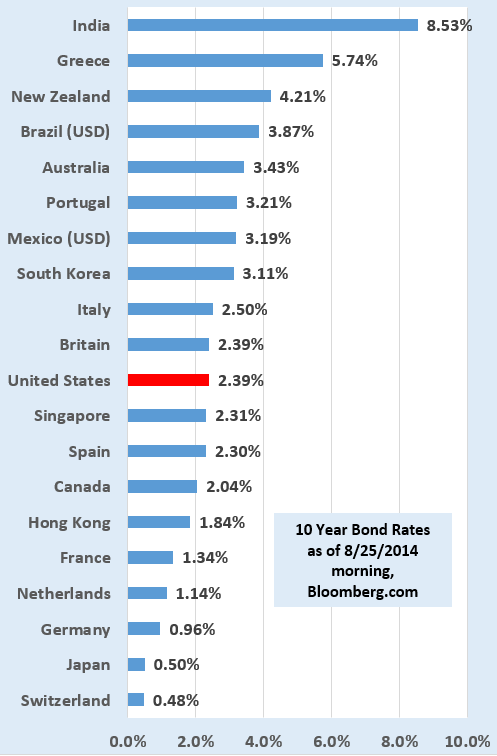
Global Bond Rates May Make it Hard for the Fed to Affect US Long-Term Rates
Published: August 29, 2014
The Fed has been in unchartered territory with its post-2008 actions, and unwinding them may take a bit of creativity. One of their obstacles might be the rates of long term government bonds around the world. The chart below shows the yield of 10-year bonds earlier this week. The rate on US 10-year bonds is more than 4x Japan's and more than 2x Germany's. In an odd situation, US bonds are actually paying less than those of Spain. Global investors looking for yield (pension funds, governments, mutual funds, and others) may thwart Fed actions by finding US funds to be compelling deals on a relative basis. The Fed can usually affect only short term rates, which was one of the reasons they became aggressive in buying long term debt in their Quantitative Easing (QE) actions. Getting yields down for all durations is what made their actions were essentially unprecedented for the US. If they attempt to sell their holdings quickly to raise rates, there might be more buyers than they anticipate, making the action fruitless. It still looks like once the QE buying is done in the next few weeks the Fed will simply let their most of their holdings mature rather than force-feed them to the market. Listen for the word “macroprudential” in the next months. That's how Fed officials are describing the gentle prodding they may have to take to reverse their course. It turns out that some of the Fed members are worried their actions may encounter resistance, so they will resort to some arm-twisting to push banks to act in the manner they want. That hasn't worked well in the past, and it probably won't work well now, but it does add a word to our vocabulary. Full Analysis
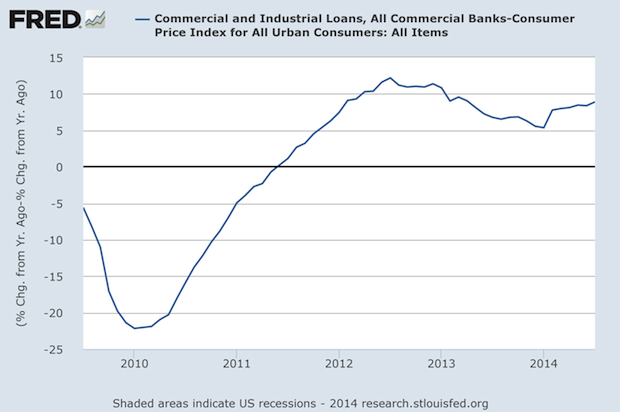
Inflation-adjusted Commercial & Industrial Loans Growing
Published: August 22, 2014
Commercial and industrial loans took a while to start growing again, almost two years after the recovery started. Loans now total $1.7 trillion, the highest amount in the history of the data series, a little more than 10% of GDP. Overall, they are up about 40% on a current dollar basis since mid-2010. Full Analysis
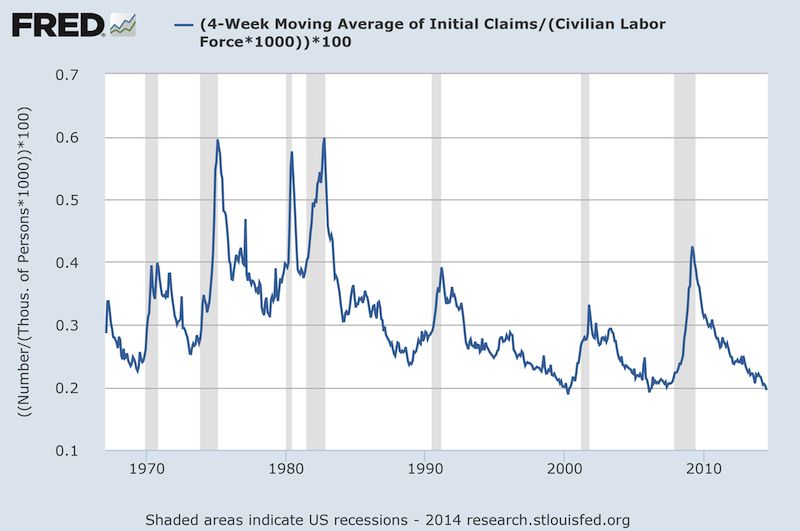
Initial Jobless Claims as a Percentage of the Workforce
Published: August 15, 2014
As the number of employed workers has been slowly increasing, and the total workforce has been growing, initial claims for unemployment have been decreasing. The historical perspective is very interesting. This past recession, as bad as it was, did not come close to the levels of the 1970s and 1980s recessions (about 0.6% of the workforce). This most recent recovery is already at the best levels of prior expansions. It doesn't feel “that good”; what's different? The workforce has not kept up with population growth, and about 2 million workers have permanently left the workforce. Also, companies have been cautious in their hiring, meaning, that there are fewer workers to dismiss when businesses of the past needed to. One could look at the chart and say that when this ratio reaches this current level (0.2%) a recession has always followed. Probably not in this case: this ratio may go to unprecedented lower levels because of the workforce exodus and the slow pace of hiring that has made this recovery so different than previous ones. Economist Mark Perry at the American Enterprise Institute discussed the steady rise in job openings at his blog. They are at a 13-year high (not adjusted for population growth), and still less than January 2000 by 800,000. Full Analysis
Latest Recovery Indicators
Published: August 8, 2014
Dr. Joe's Key Recovery Indicators were started in 2009, and track the monthly ups and downs of the economy in terms that are relevant to small and mid-size businesses. Full Analysis
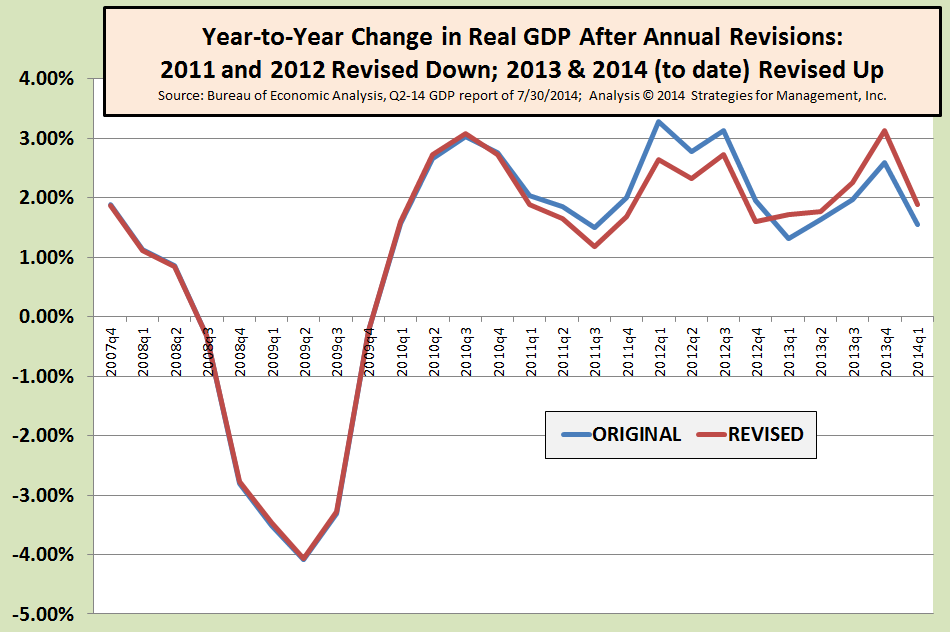
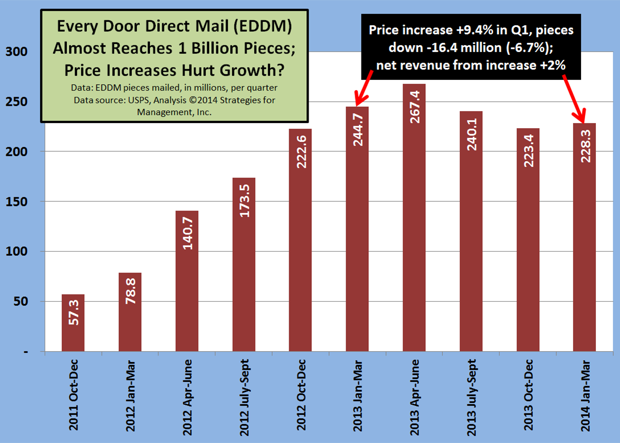
USPS' Every Door Direct Mail Program Declines After Price Increase
Published: July 24, 2014
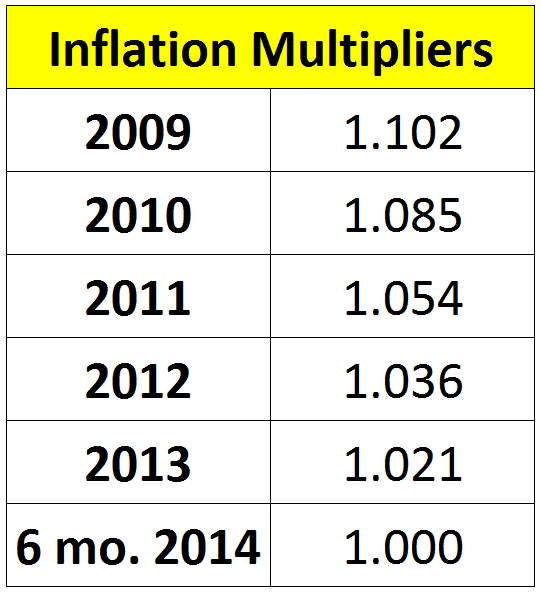
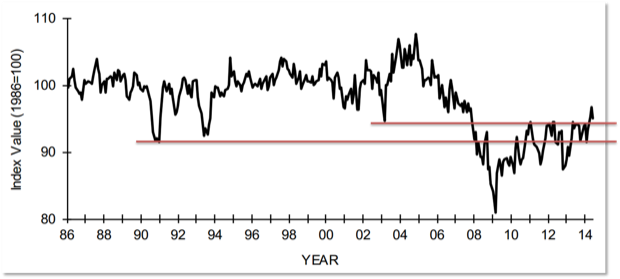
NFIB Small Business Index Breaks Through 2003 Recession Bottom for Last Two Months
Published: July 10, 2014
The NFIB index has been trapped between the bottom of two recessions, that of the early 1990s and the early 2000s recession bottom. Though the latest report retreated a bit, it's still above the 2003 low. Small business is improving at a very slow pace, but this may finally be a good sign after the very disappointing Q1 GDP report. Full Analysis
Recovery Indicators Improve
Published: July 3, 2014
The recovery indicators were mainly better this month, with the NASDAQ bouncing around then finishing well, and three of the four ISM indicators increasing. The one that didn’t is still firmly in expansion territory. The original estimate of proprietors’ income was $1,371 then it was reduced to $1,366 billion and now it’s $1,359. Full Analysis
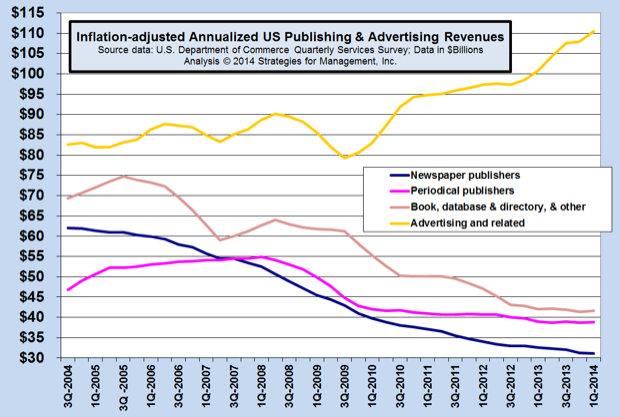
Advertising Agency Revenues Still Climbing
Published: June 24, 2014
The chart below shows the latest revenue data, on an inflation-adjusted basis, for ad agencies and publishers. Note how ad agency revenues are rising. While there have always been agencies that specialize in certain media, like television, direct mail, or others, the industry is media agnostic in the aggregate. Its job is to increase the positive visibility of its clients and help spur their customers into action. Full Analysis
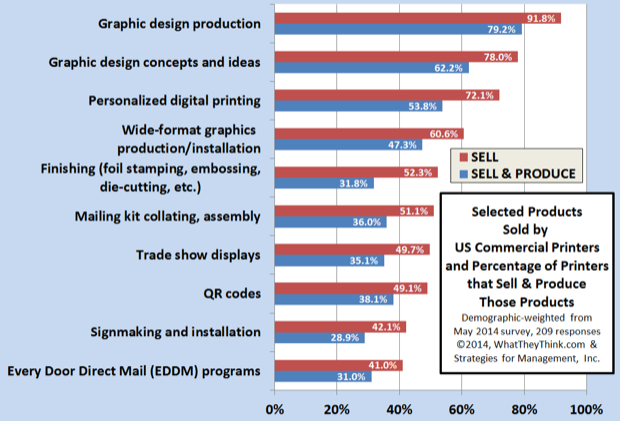
Selected Generally “Non-Offset” Products and Services Offered by US Commercial Printers
Published: June 18, 2014
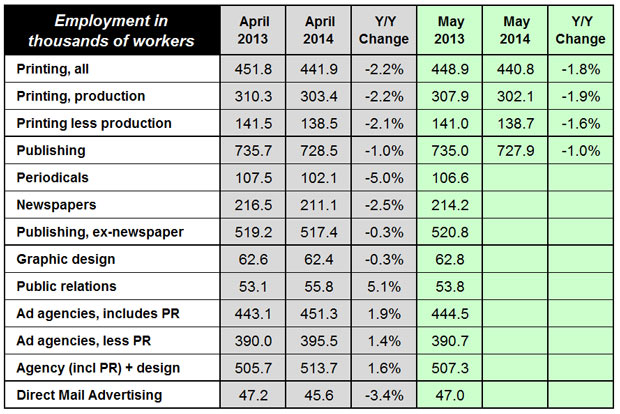
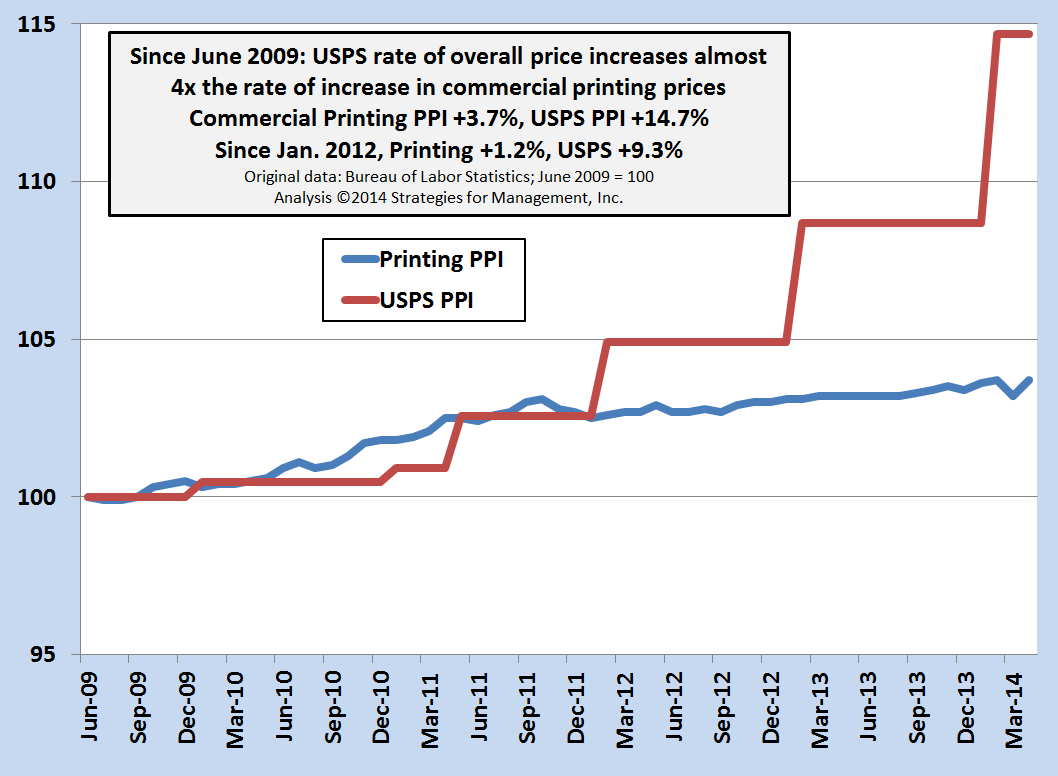
Since June 2009, rate of overall USPS price increases almost 4x the rate of increase in commercial printing prices
Published: June 5, 2014
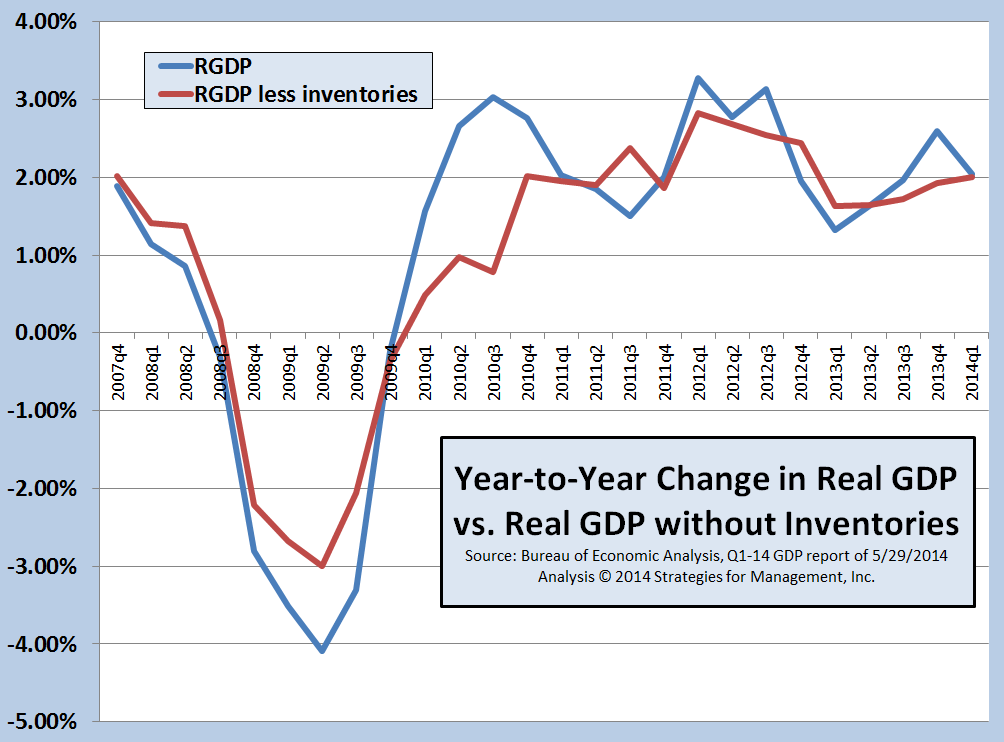
Though Q1-2014 GDP was -1%, the Year-to-Year Trend Remains in the +2% Range
Published: May 29, 2014
The Bureau of Economic Analysis released the second revision of Q1-2014 US Gross Domestic Product (GDP), indicating a contraction of the US economy in the quarter. As reported in prior (“laughable and embarassing”) analysis, an inventory buildup in the last two quarters of 2013 distorted the underlying condition of the economy. Full Analysis
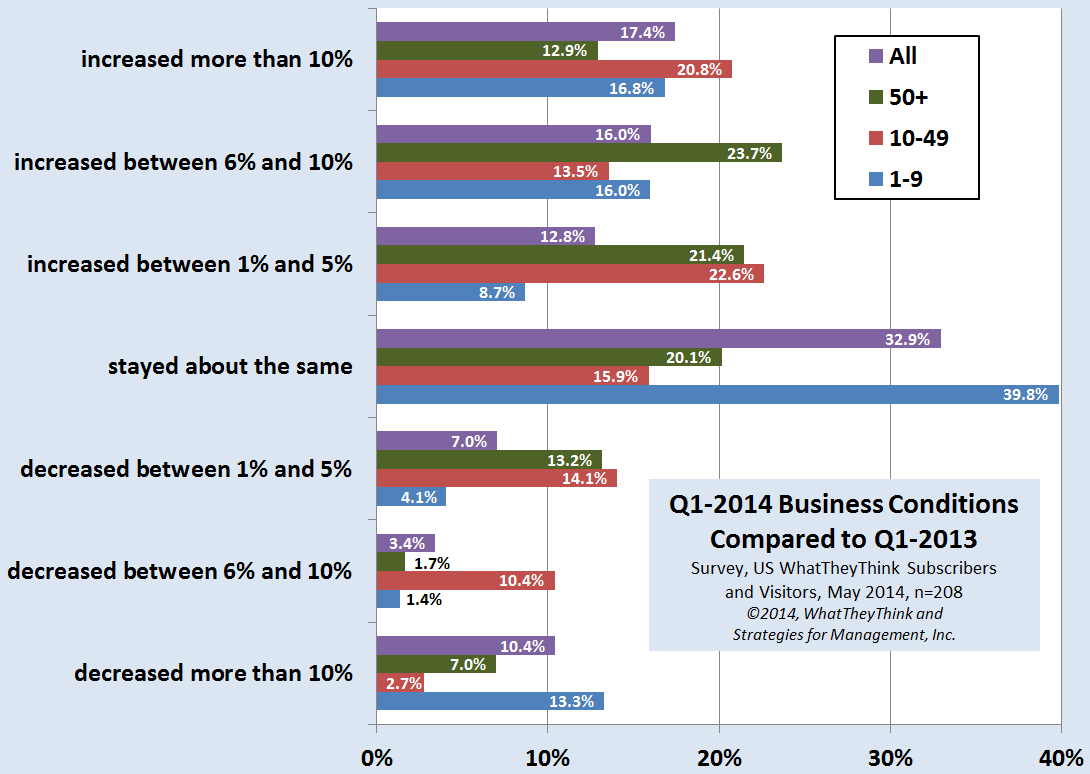
Q1-2014 Business Conditions Compared to Q1-2013
Published: May 29, 2014
Business conditions were generally good, with more than 33% reporting business increases of 6% or more. About 13% of respondents indicated business decreases of 6% or more Full Analysis
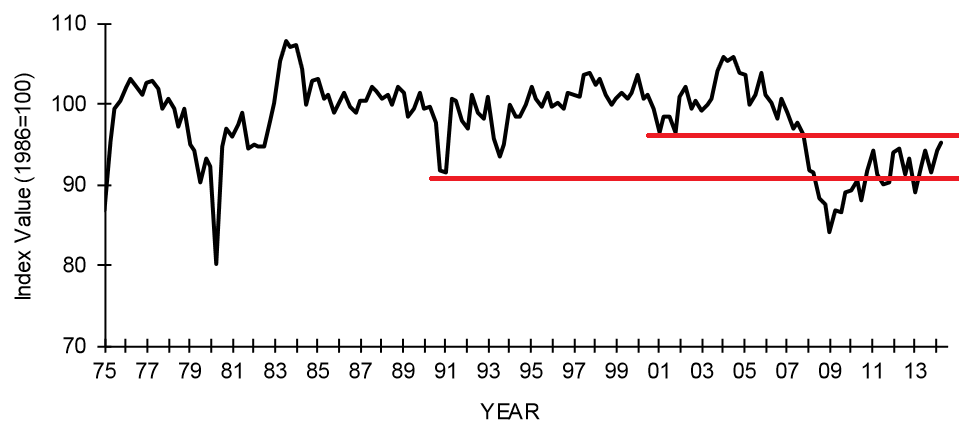
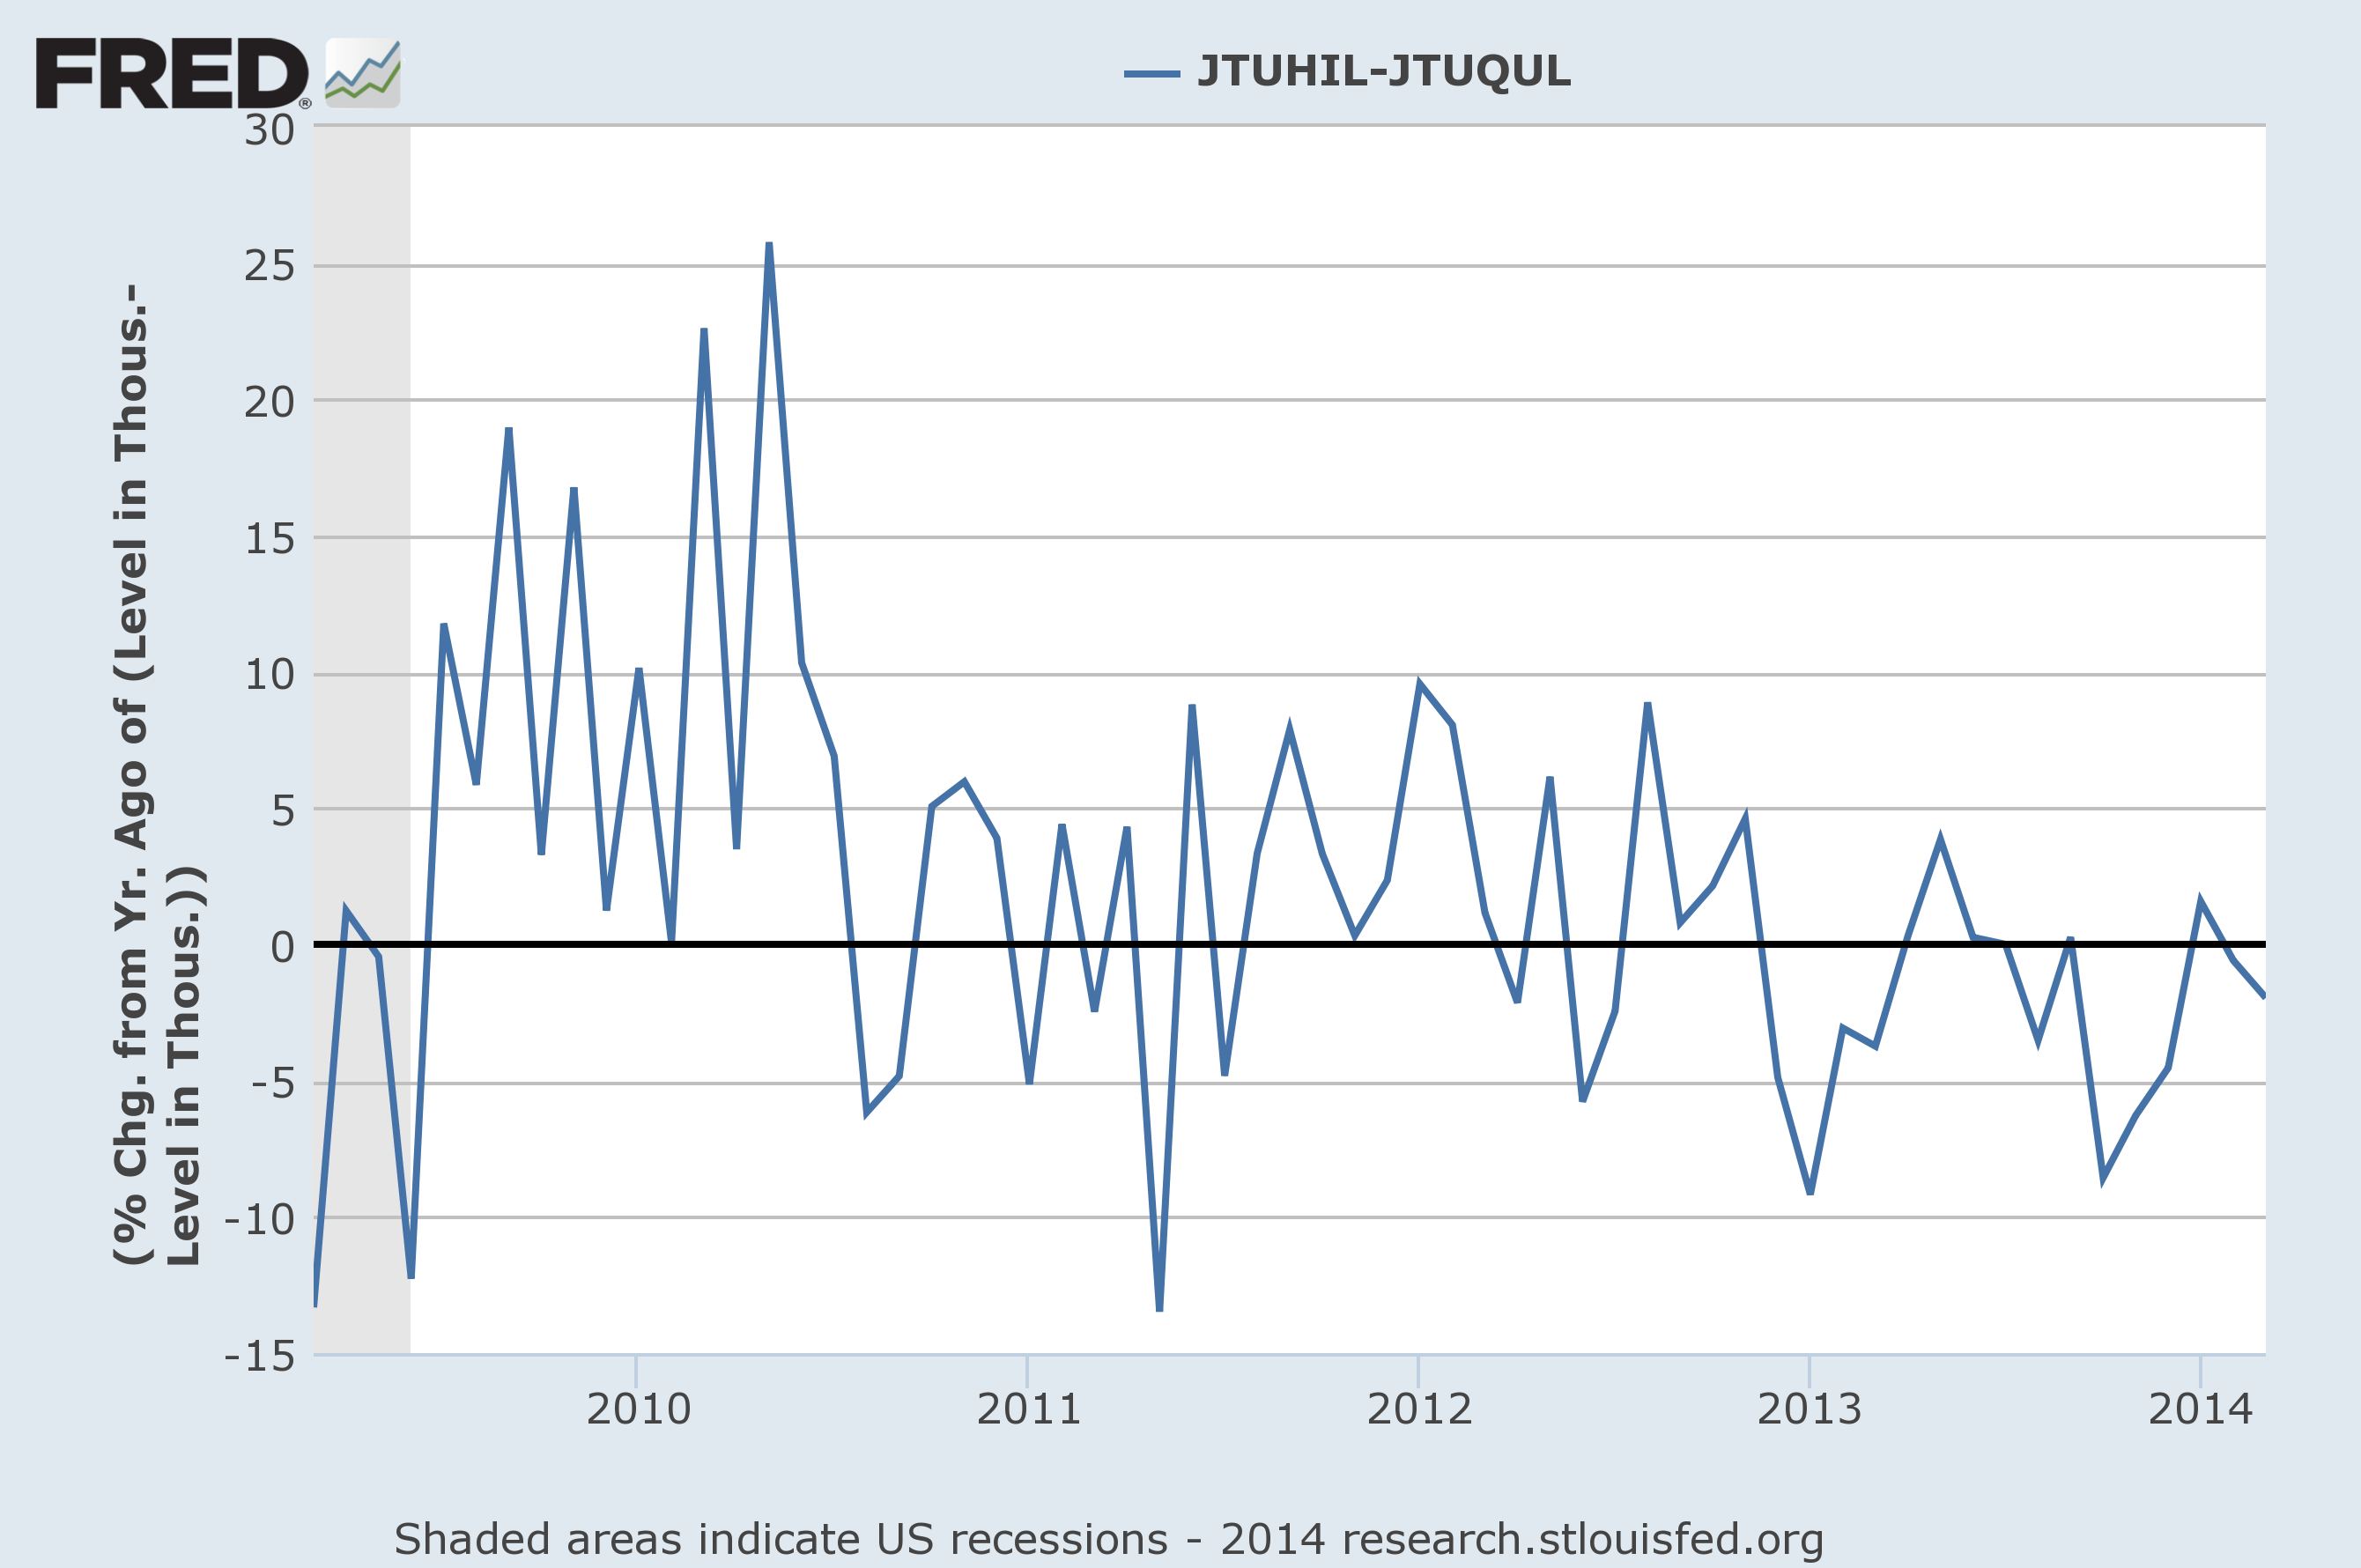
Labor Market Net Hiring Turns Negative
Published: May 15, 2014
US employment data has many cross-currents: the unemployment rate is down, but the labor participation rate is at 35-year lows. Last week the Bureau of Labor Statistics published its JOLTS report, which shows they dynamic factors at play in the labor market. This chart shows the percentage of hires less the number of quits on a year-to-year basis. Note in the chart below the rapid rise in employment as the recession ended and the recovery began, and also how it has narrowed and turned negative in recent months. It's been mainly negative for about 18 months. Full Analysis

Q1-2014 US Commercial Printing Shipments Down -4% Compared to 2013
Published: May 8, 2014
March 2013 US commercial printing shipments were down -$148 million (-2.2%) compared to 2012. The first quarter was down -$770 billion (-4%). On an inflation-adjusted basis, shipments were down -$270 million (-5.4%) and down -$1.05 billion (-5.4%) for the quarter. Full Analysis
Recovery Indicators Rebound; Q1-2014 GDP Below 1% but Corrects for Business Inventory Misjudgments
Published: May 8, 2014
The recovery indicators rebounded since last month. New orders for manufacturers remained at the same level that indicates growth. Full Analysis
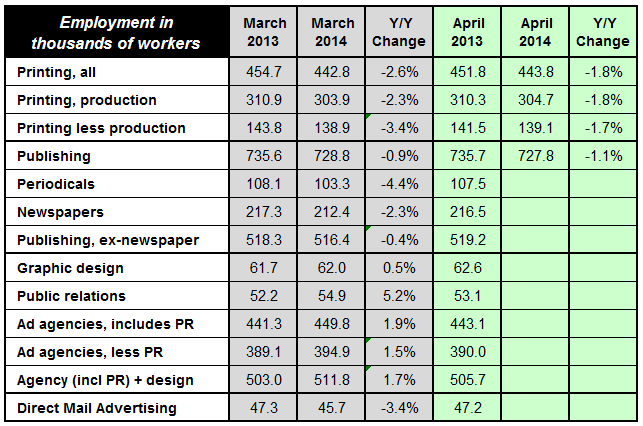
April Printing Employment +1,000
Published: May 7, 2014
Printing employment in April rose by 1,000 workers. It is always hard to determine if these were actual workers or if the changes were the result of issues with the estimation models of the Bureau of Labor Statistics. Production workers were the greatest part of the increase (800). Full Analysis
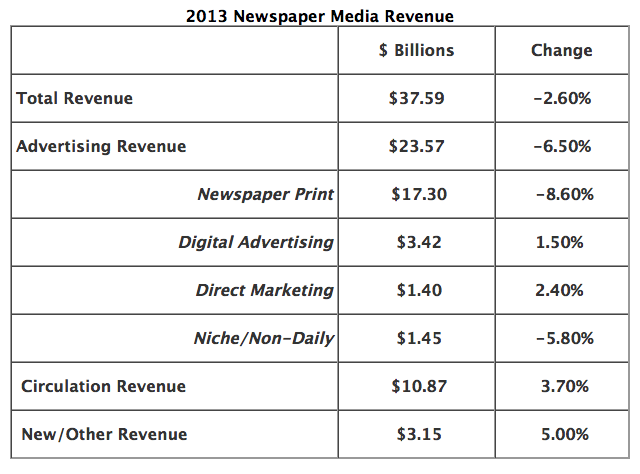
2013 Newspaper Revenue
Published: April 23, 2014
Circulation revenue for U.S. newspapers recorded a second consecutive year of growth, rising 3.7% to $10.87 billion in 2013 according to figures released by the Newspaper Association of America. Total revenue was $37.59 billion in 2013, a loss of 2.6 percent over 2012. Full Analysis
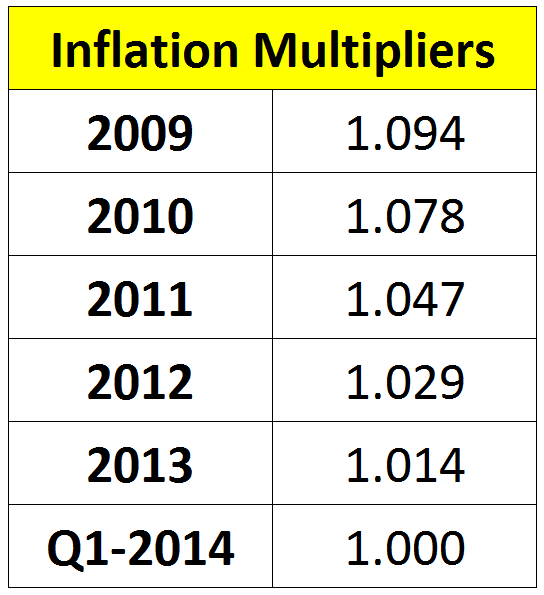
Table of Latest Inflation Multipliers
Published: April 23, 2014
Below is the latest set of multipliers based on the Consumer Price Index. Multiply your historical financial statements by the figures below to adjust data to the CPI for the first quarter of this year. Full Analysis
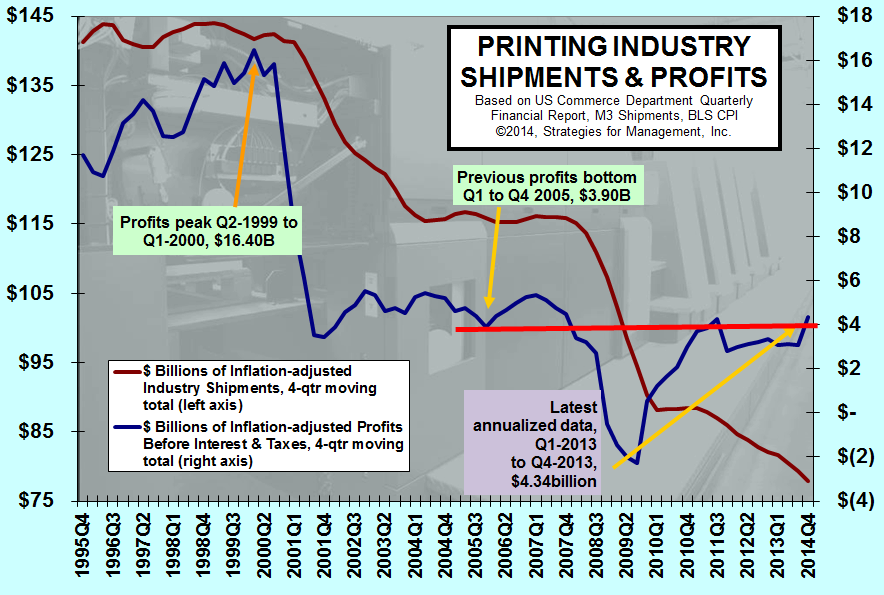
Printing Industry Shipments and Profits
Published: April 18, 2014
For the year, profits were $4.34 billion. On an inflation-adjusted basis, that was the highest level of industry profits since 2007. This is despite there being $28 billion less printing shipments, 8,000 fewer printing establishments, and 73,000 fewer employees. It was the best profits per establishment ($173,000) since 2000. Full Analysis
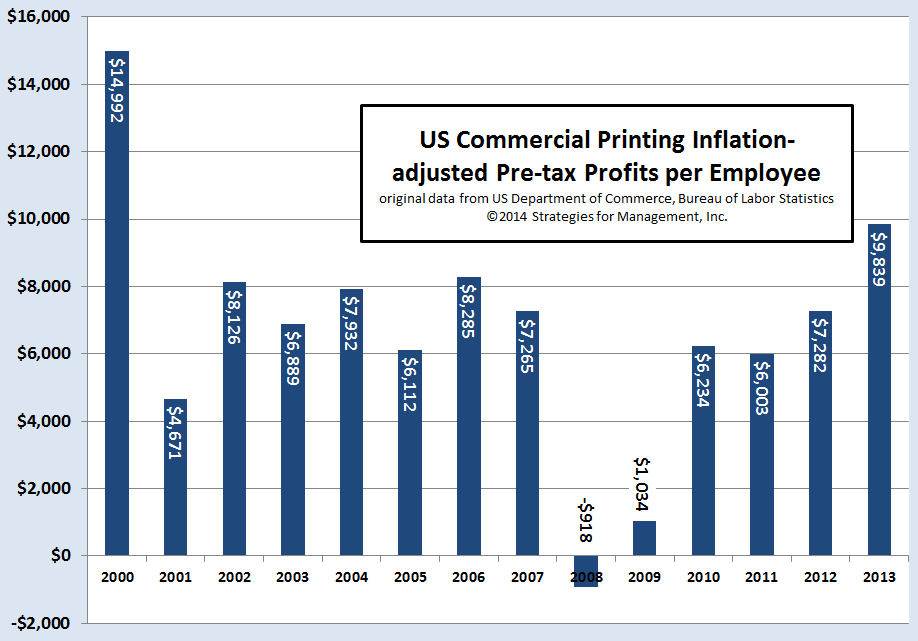
Printing Profits per Employee Rise
Published: April 17, 2014
Profits per employee increased to higher levels since 2000. Industry consolidation is a big factor in this report. It is not just mergers and acquisitions, but also plant closures and bankruptcies, and the opening of new businesses that absorb the best and most appropriate resources of the closed plants, and also the strategic changes that surviving companies make as they respond and anticipate marketplace changes, absorbing the sales volume of departed competitors. Full Analysis
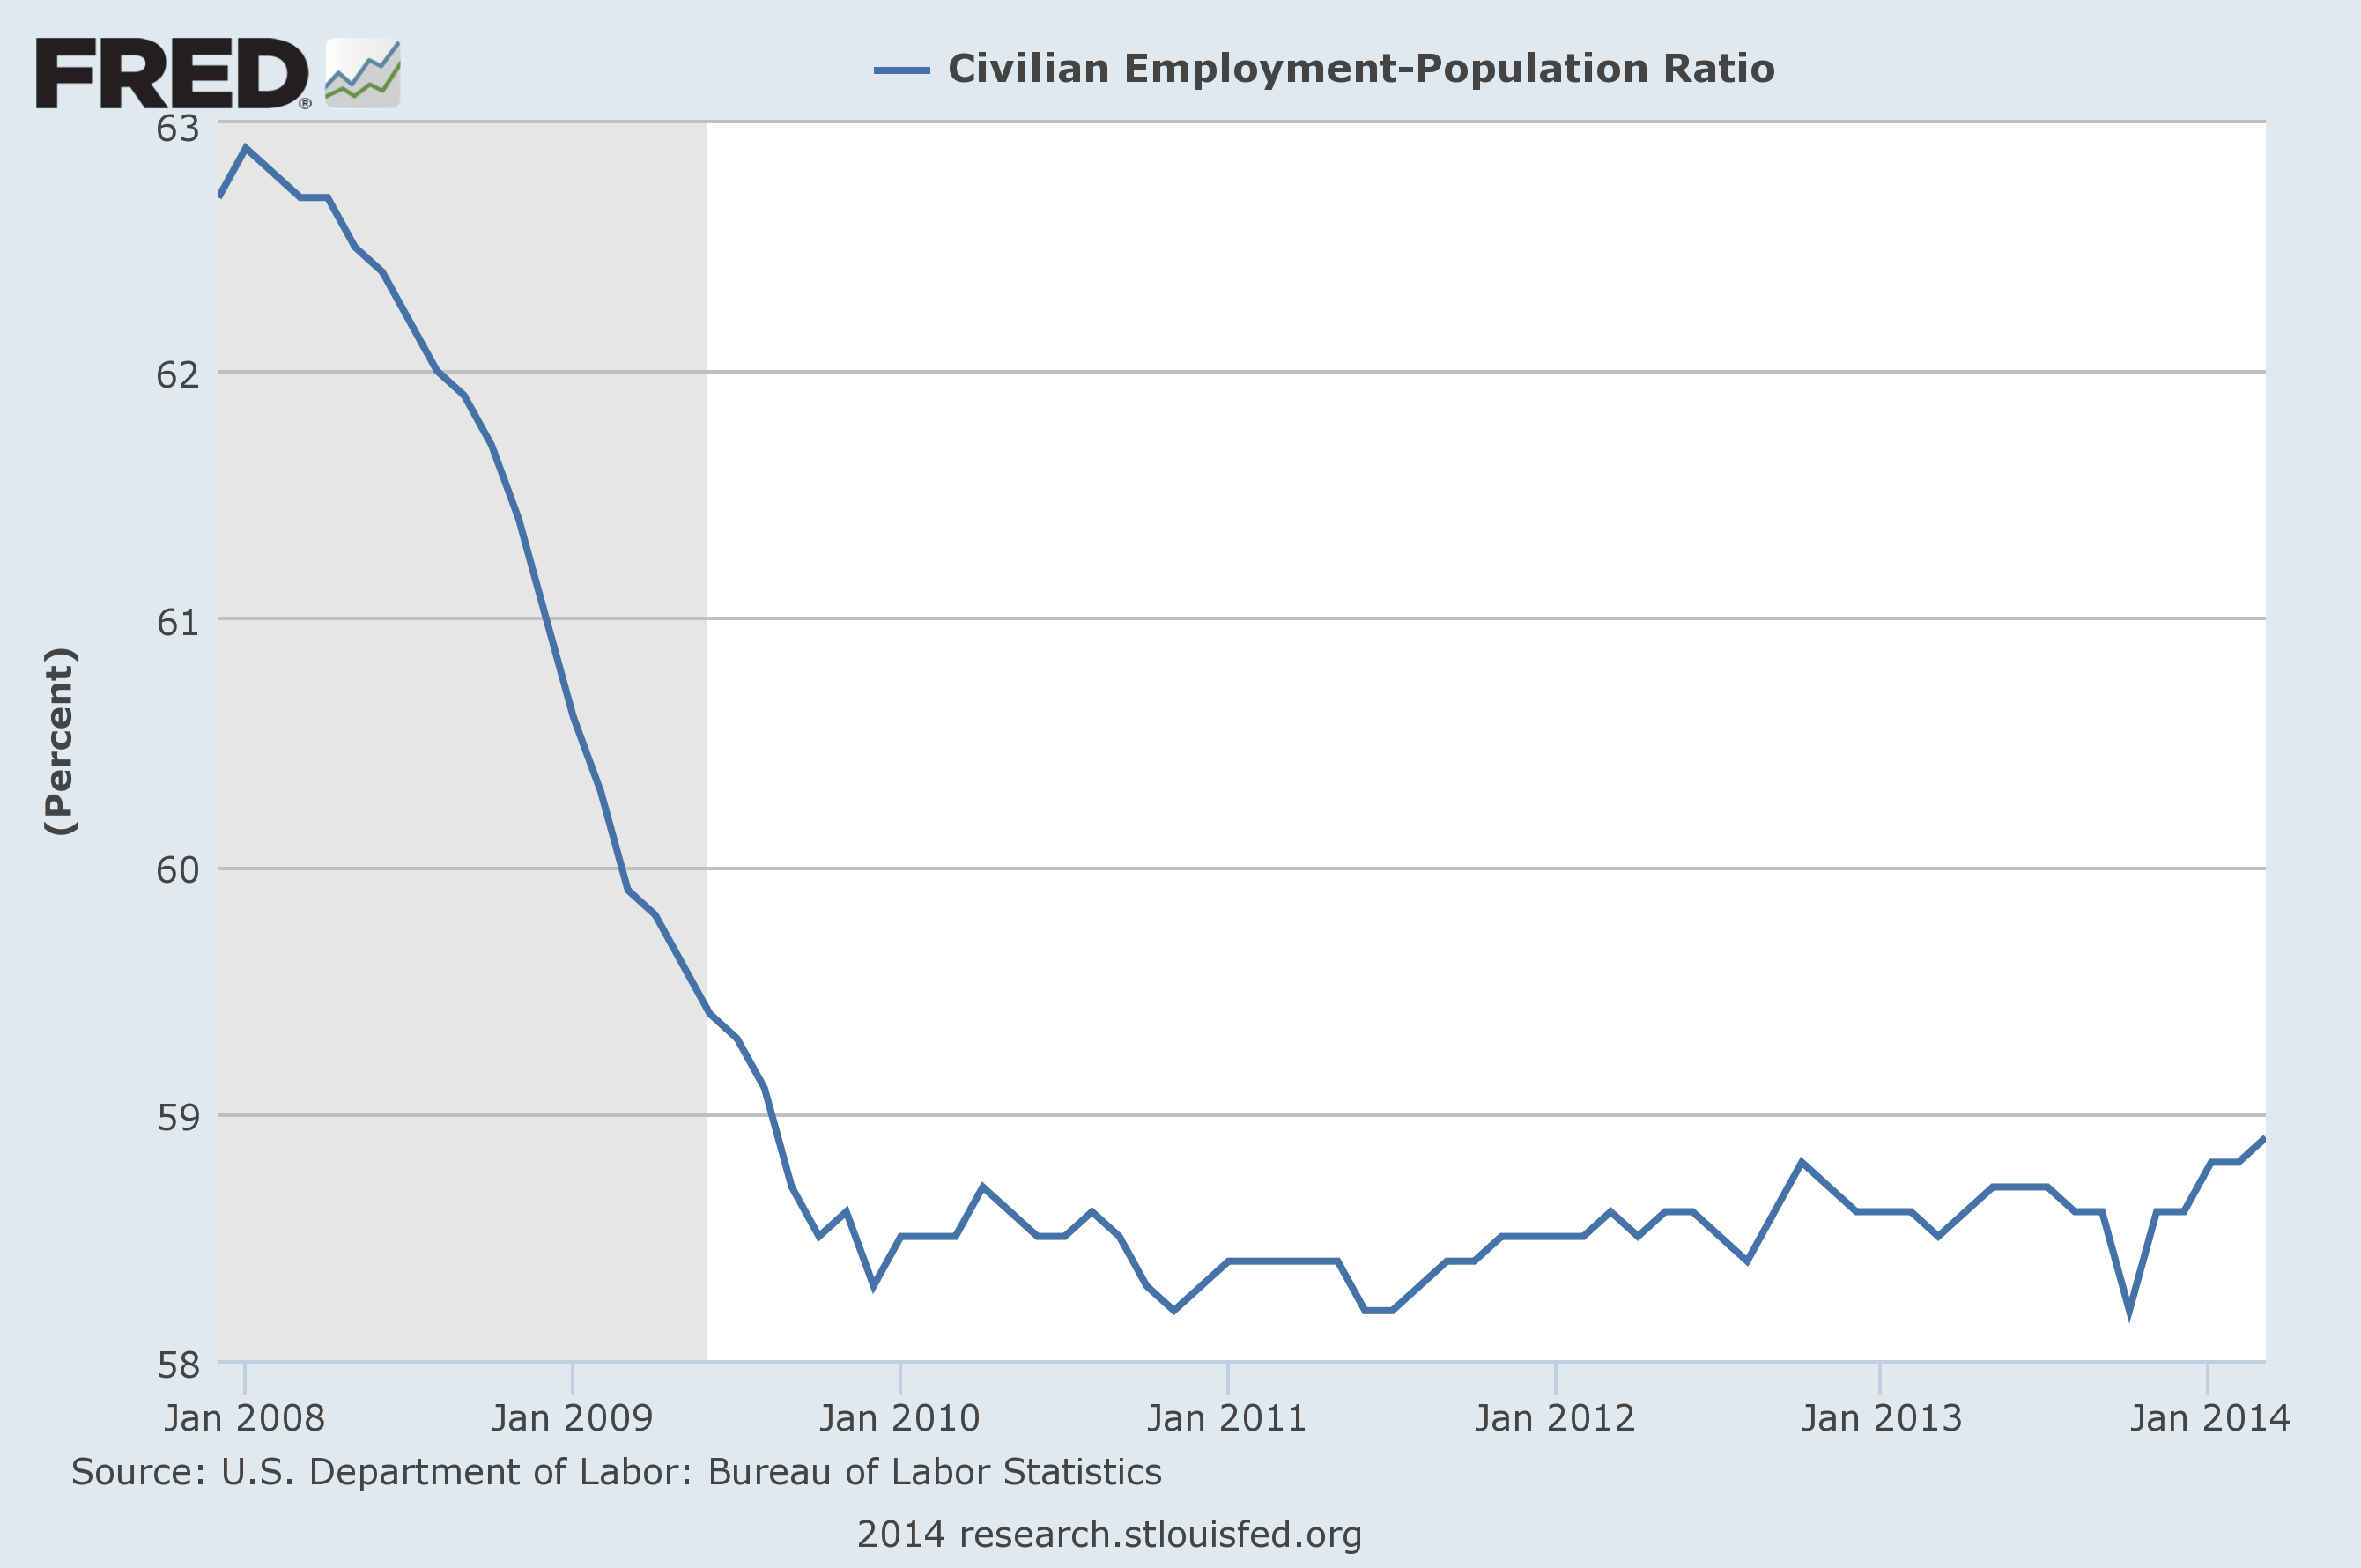
Employment-Population Ratio Still Below Pre-Recession Levels
Published: April 10, 2014
One of the measures of the health of the labor market is the comparison of the total population to civilian employment. This measure has yet to approach levels achieved prior to the recession. This measure is important because it follows the growth in population. The number of workers is now nearly what it was at the start of the recession, but population has grown about 6% since that time. In rough terms, this means that the economy is short about 5.6 million jobs. Full Analysis
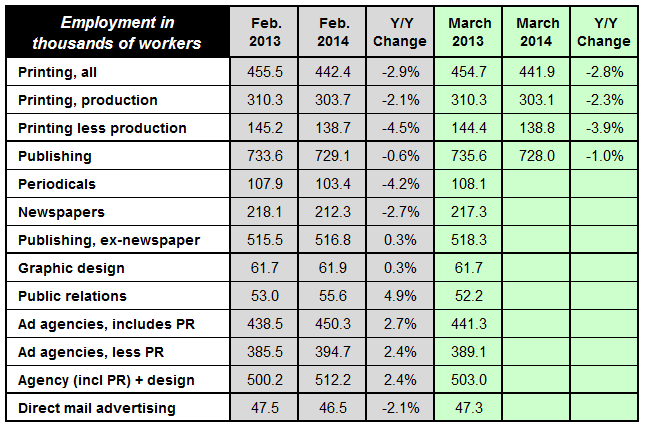
Employment Changes in the Printing and Content Creation Industries
Published: April 7, 2014
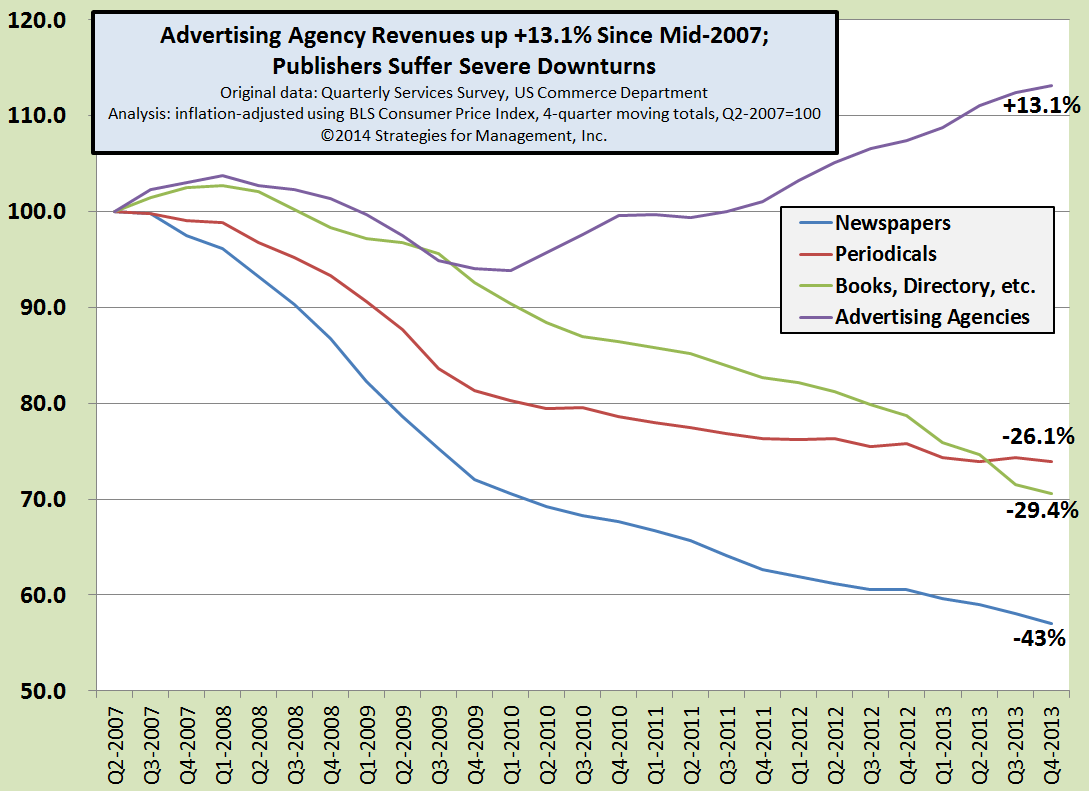
Ad Agency Revenues On Steady Rise Higher
Published: March 16, 2014
Since the second quarter of 2007, the first quarter for which we can create four-quarter inflation-adjusted moving totals, ad agency revenues are up more than 13%. Publishing industries have note fared well at all. Full Analysis

Advertising Agency Employment Surpasses Commercial Printing, Reflecting the Shift from Traditional Media
Published: February 7, 2014
The major news in the data update is that employment in advertising agencies surpassed that of the printing industry in July 2013. For 2013, printing employment was down by -12,600 (-2.8%). The biggest change was in employees outside of production who were -8,400 of that decline (-5.7%). Graphic design employment was down slightly for the year, but these data do not include freelancers, which are an essential part of that business. Inside the advertising agency employment data are public relations employees, the main area of employment growth in this sector. Full Analysis
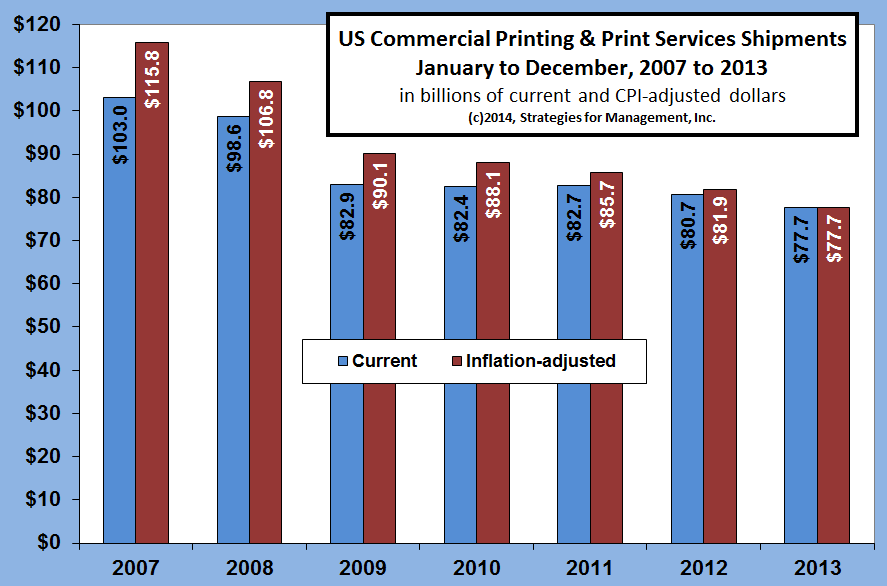
2013 US Commercial Printing Shipments Reach $77.6 Billion
Published: February 4, 2014
The Department of Commerce released December 2013 and revised November data. December shipments were $6.271B (-3.7% vs. Dec. 2012). On a current dollar basis, the total for the year was $77.6B, -3.8%. After adjusting for inflation using the Consumer Price Index, shipments were down -5.1%. The chart below shows current dollar and inflation-adjusted shipments starting with 2007 Full Analysis
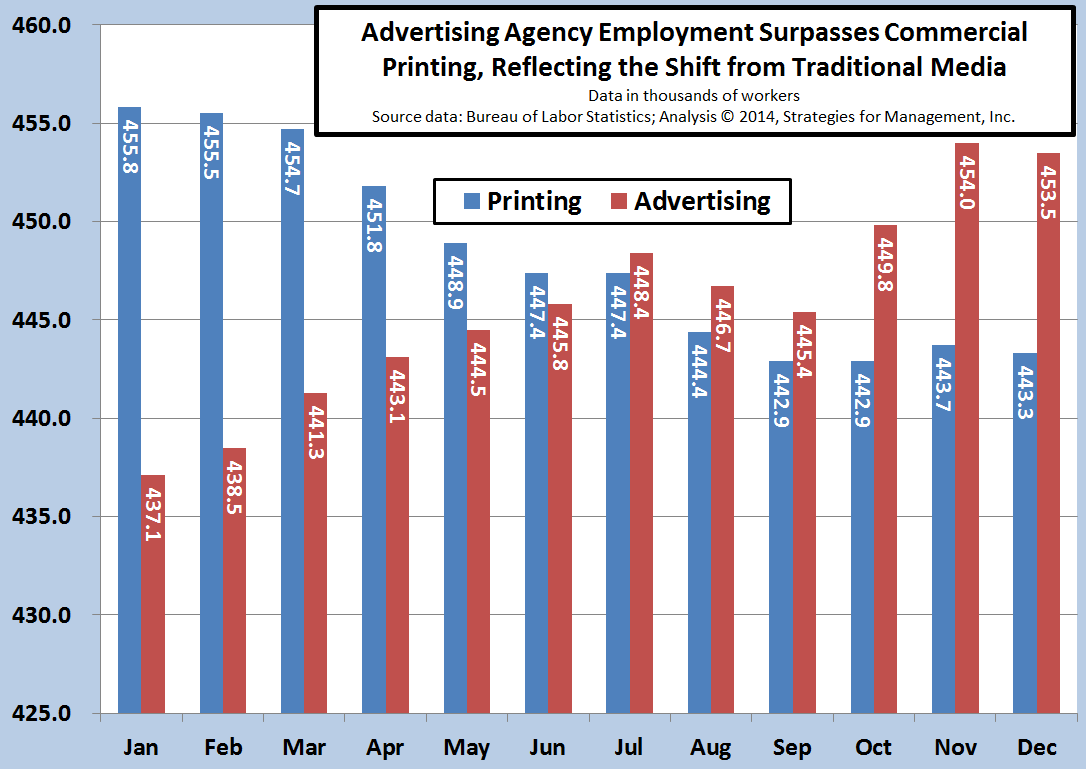
Inflation-adjusted US Printing and Print Services Shipments
Published: February 4, 2014
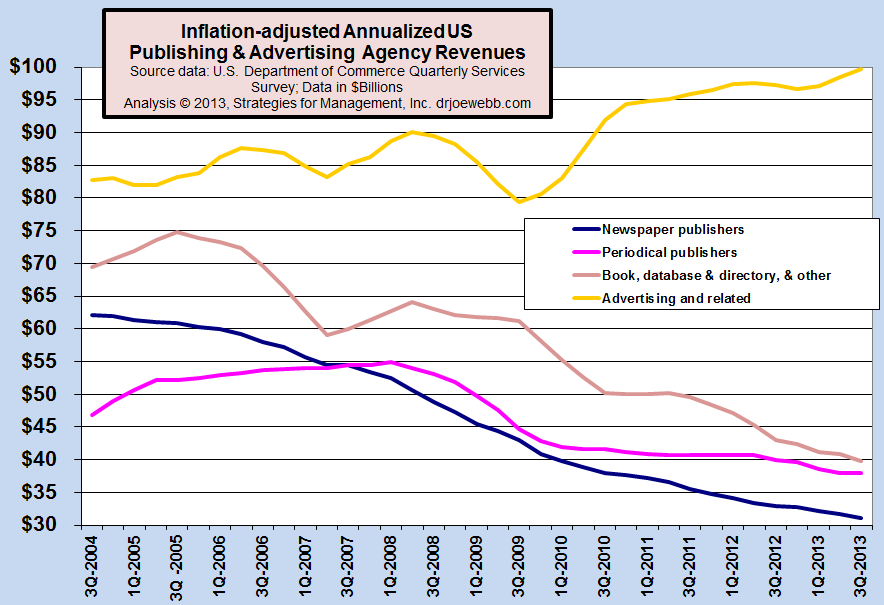
Inflation-adjusted Annualized US Publishing & Advertising Agency Revenues
Published: January 14, 2014
This chart shows the inflation-adjusted revenue trends for selected content-creation businesses. Note how advertising revenues have increased despite the declines in the revenues to publishers. Agencies have shifted much of their efforts to developing “earned media” (a/k/a search engines, social media, e-marketing and numerous other digital formats), and the production of it. Full Analysis
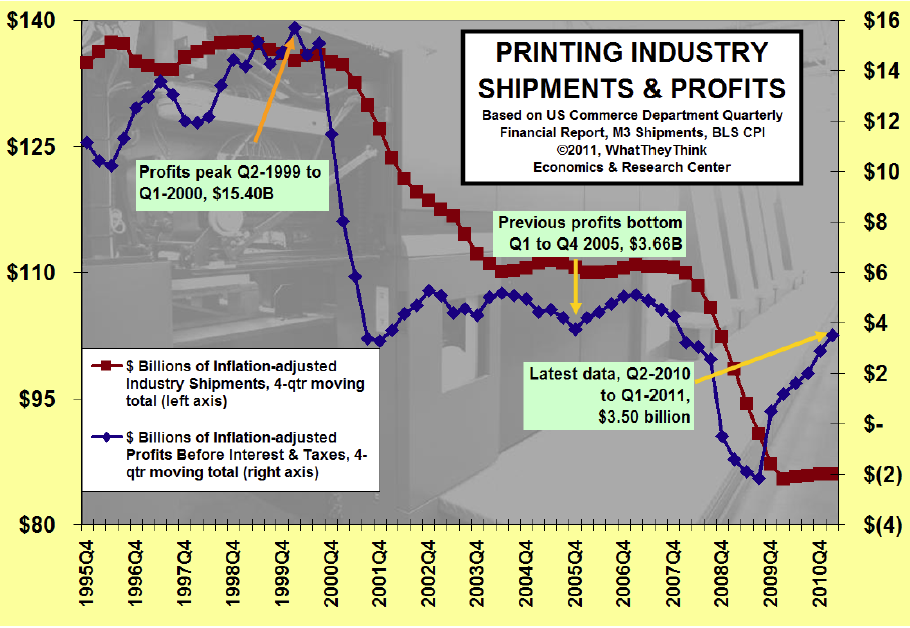
Six Consecutive Profitable Quarters for U.S. Commercial Printing Businesses
Published: June 15, 2011
The first quarter of 2011 continued a welcome continuation of profitability for the industry. The industry shakeout of unprofitable businesses, and the better management of healthier businesses continues to create an improved bottom line, but there are still great challenges ahead. The restructuring of the industry will be a continuing process in 2011 and beyond. Full Analysis
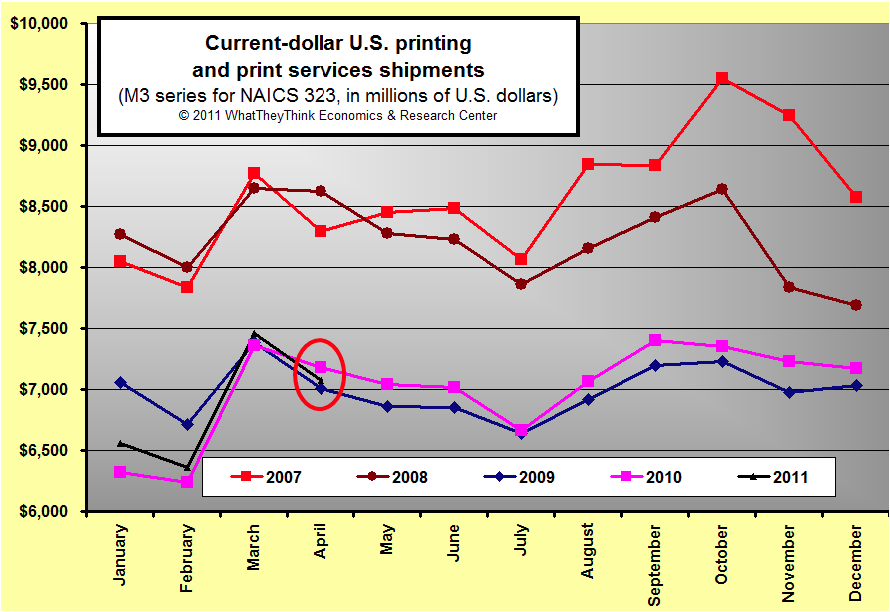
April 2011 U.S. Commercial Printing Shipments Down
Published: June 9, 2011
April 2011 commercial printing shipments were $7.08 billion, down -$109 million (-1.5%) compared to 2010. Adjusting for inflation, shipments were down -$366 million (-4.5%). Full Analysis
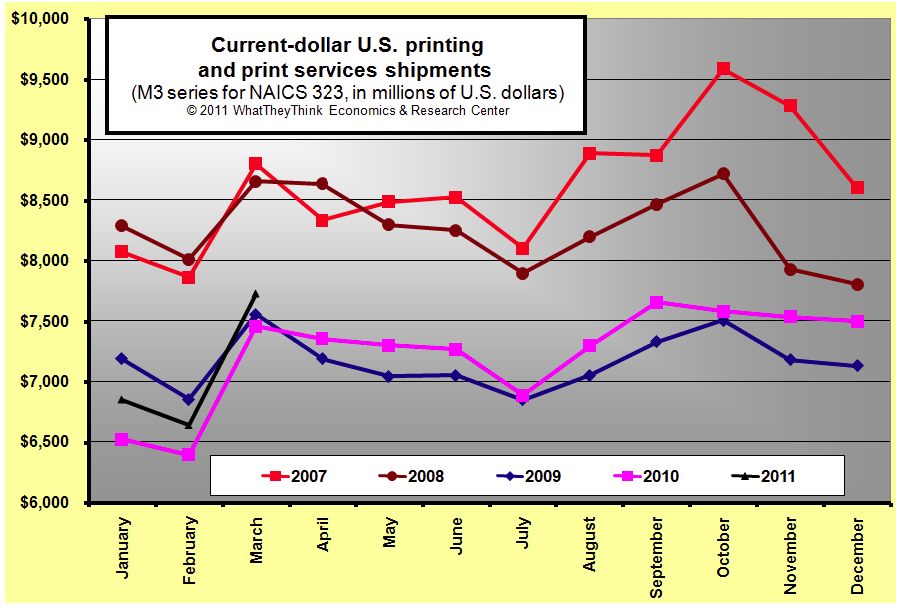
March 2011 U.S. Commercial Printing Shipments Up; Twelve Months of Increases
Published: May 6, 2011
March printing shipments were up, resulting in 12 consecutive months of increase. Dr. Webb explains how the easy comparisons to the prior year are about to end, and that the balance of 2011 will be about the same as 2010. He reviews the upcoming data revisions from the Commerce Department on May 13, the importance of inflation adjusting company financial data, and the shipment rates of Canada's commercial printing industry. Full Analysis
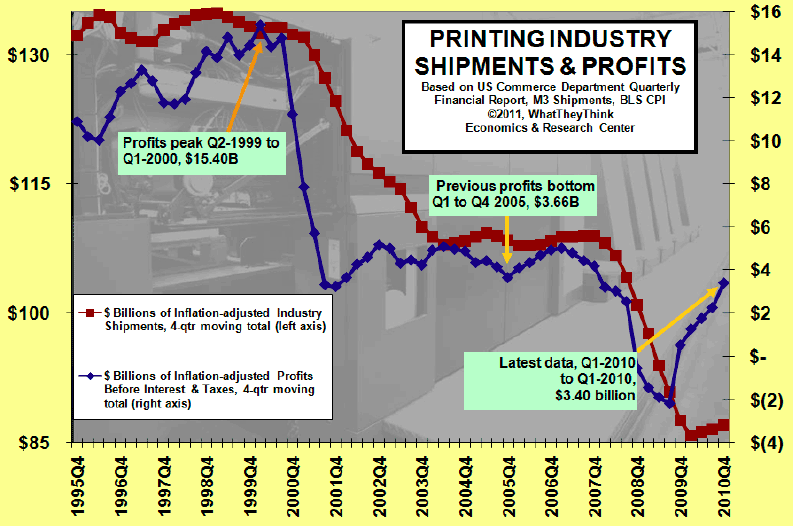
U.S. Commercial Printing Businesses Produce Estimated $1.11 Billion in Profits in Fourth Quarter 2010
Published: April 6, 2011
Dr. Joe Webb has compiled reports on US commercial printing profits going back to 1995, and brings it all current to Q4 2010. This report examines the latest trends in shipments, profits and capacity for the industry, of which the Federal Reserve just made revisions going back almost 25 years. How does Joe recommend printers steer the course? What will it take to get the print industry out of the hole? Dr. Webb has insights that can help. Full Analysis

February 2011 U.S. Commercial Printing Shipments Up +4.4%, Eleven Months of Y-O-Y Increases
Published: April 5, 2011
Dr. Webb looks at February's shipments, Canada's January shipments, and updated forecasts for the North American printing industry to 2017. There's an updated GDP Forecast model and commentary on why that model is not totally reliable for forecasting the print industry. Will the rest of 2011 be as positive as January and February? Dr. Joe discusses. Full Analysis
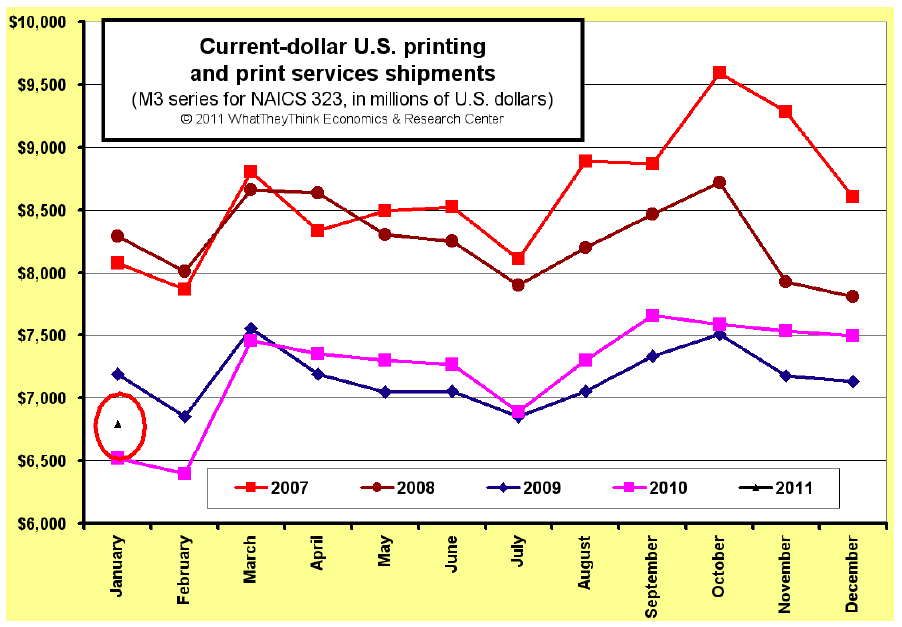
January 2011 U.S. Commercial Printing Shipments Up +4.1%, Good Start to New Year
Published: March 10, 2011
Dr. Webb comments on what the forecasting models are projecting for shipments out to 2017. The podcast also includes an analysis of how the industry has changed between 2000 and 2009 based on the latest data from the Commerce Department. Full Analysis
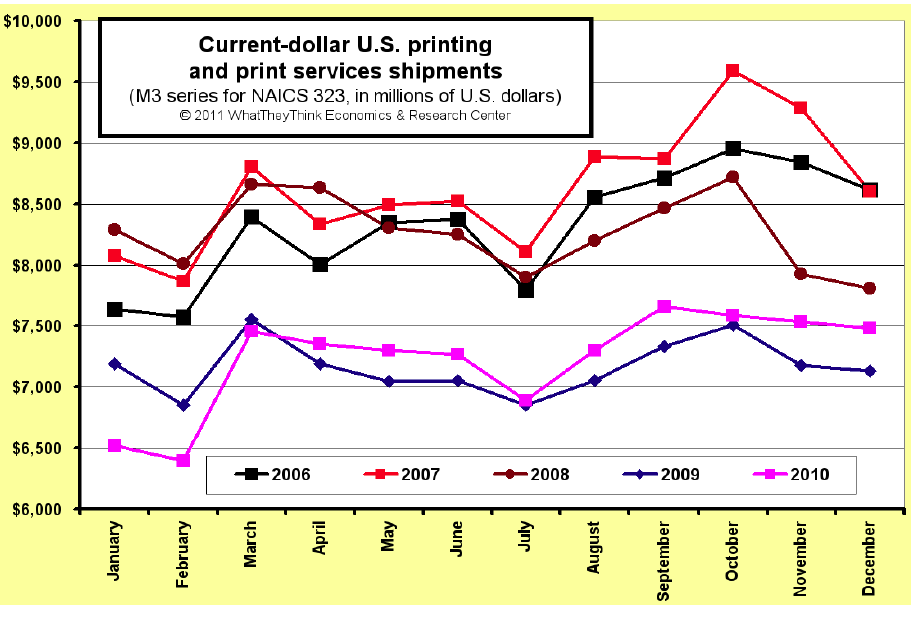
2010 U.S. Commercial Printing Shipments Finish at $86.7 Billion, +0.9% Versus 2009
Published: February 4, 2011
December 2010 commercial printing shipments were $7.48 billion, up $347 million (+4.9%) compared to 2009. Adjusting for inflation, shipments were up +3.3%. This brought the year's shipments to $86.7 billion. Full Analysis
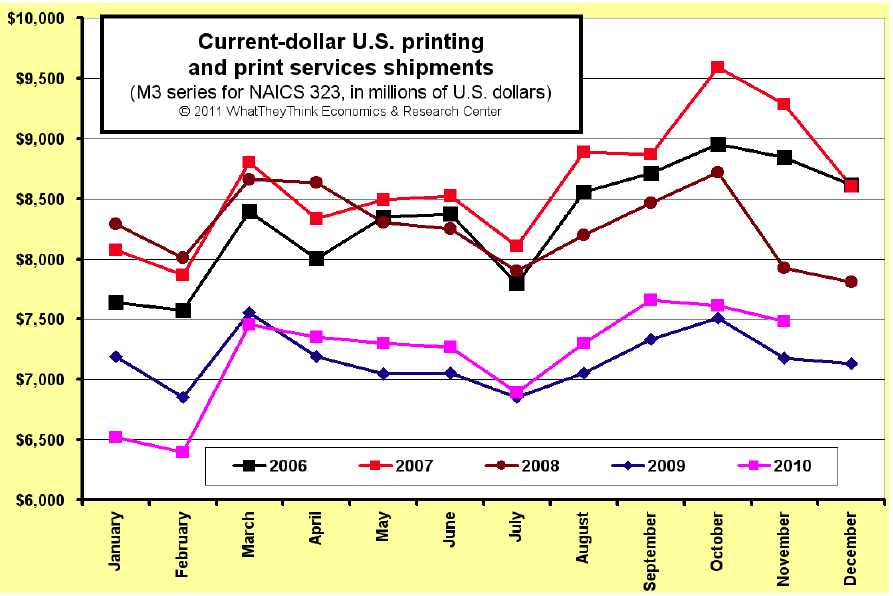
November U.S. Commercial Printing Shipments Up +4.2%
Published: January 19, 2011
November 2010 commercial printing shipments were $7.48 billion, up $303 million (+4.2%) compared to 2009. Adjusting for inflation, shipments were up +4.2%. “This was a very encouraging month, and continues the consecutive gain in current dollar shipments for eight months,” explained Dr. Joe Webb, director of WhatTheyThink's Economics and Research Center. Full Analysis
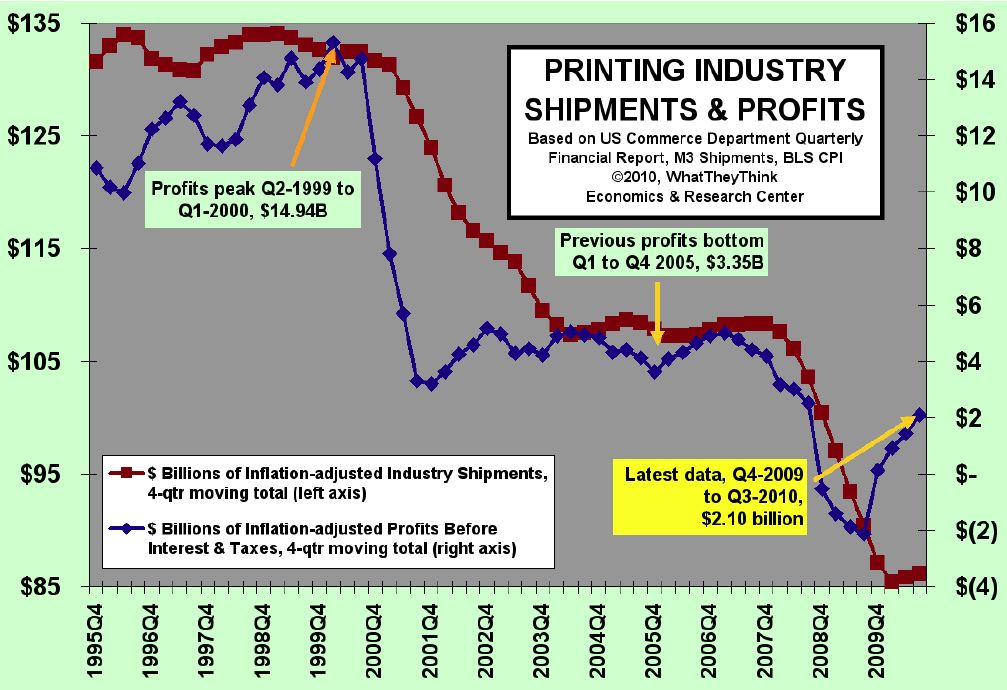
U.S. Commercial Printing Businesses Produce Estimated $1.1 Billion in Profits in Third Quarter 2010
Published: December 14, 2010
The third quarter of 2010 continued a welcome continuation of profitability for the industry. It has had seven consecutive months of increased sales, but it's clear that the profits trend is increasing, but the long term sales trend is flat. Full Analysis

October U.S. Commercial Printing Shipments Up +1.4%
Published: December 6, 2010
October 2010 commercial printing shipments were $7.61 billion, up $108 million (+1.4%) compared to 2009. Adjusting for inflation, shipments were up +0.3%. Full Analysis
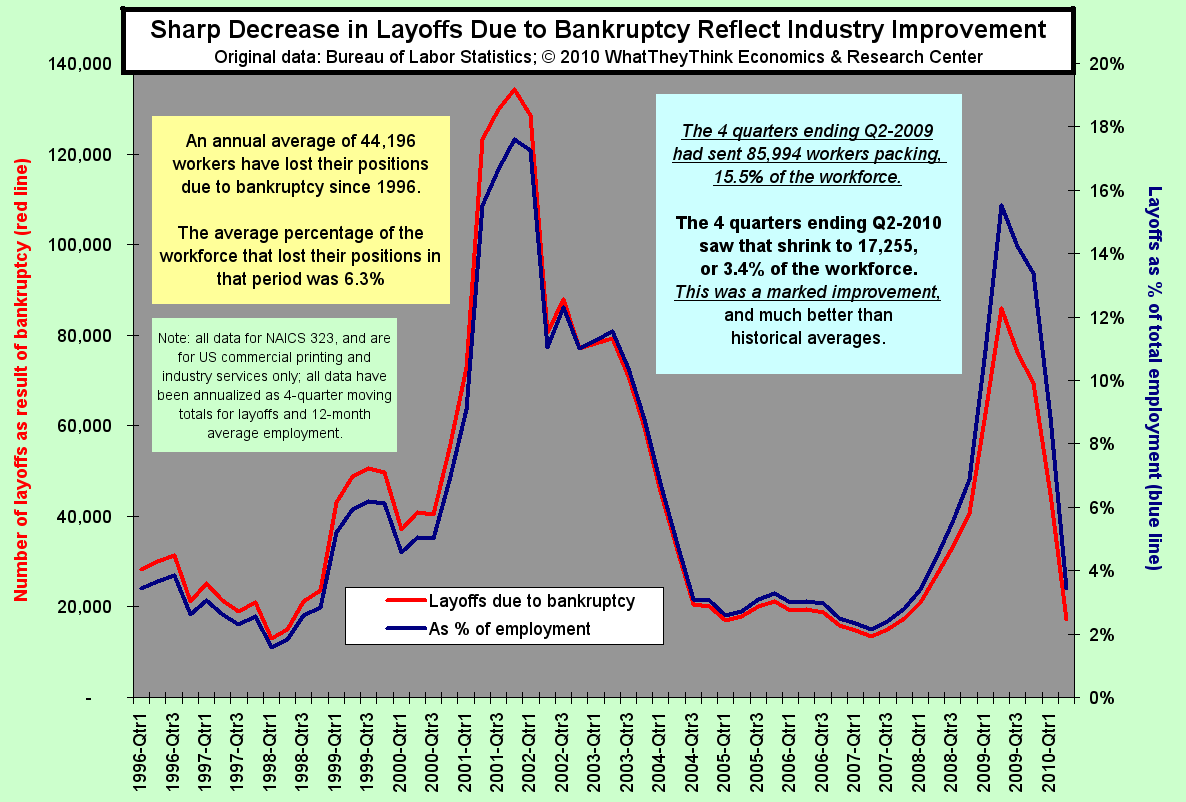
Sharp Decrease in Layoffs Due to Bankruptcy Reflect Industry Improvement
Published: November 15, 2010
Even something that sounds bad, like the number of printing industry layoffs due to bankruptcy, can be good if they're declining. Dr. Joe explains the sharp decline in the last four quarters and why it's very good news. Full Analysis
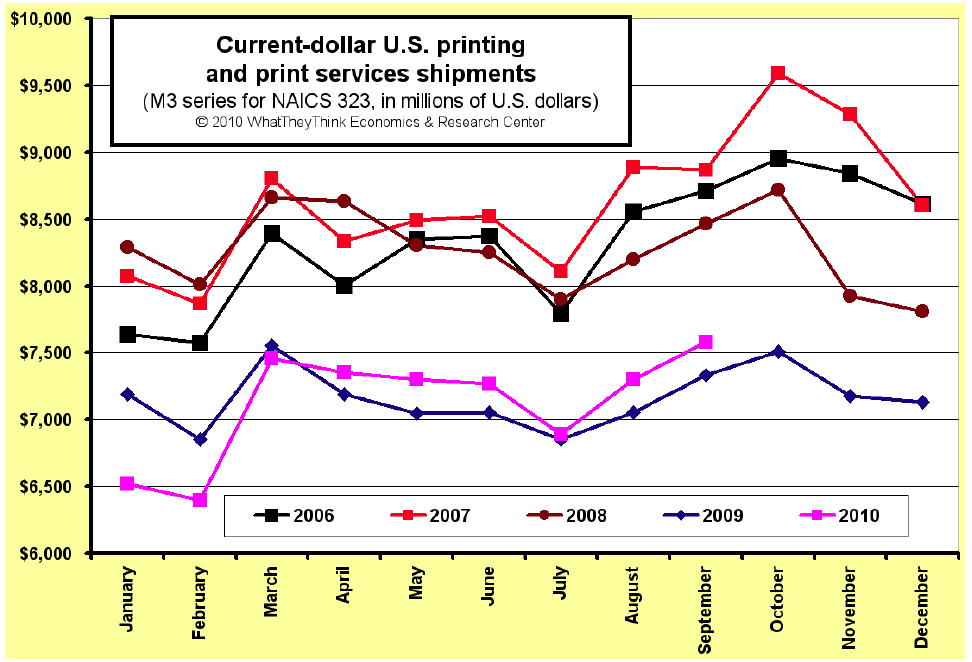
September U.S. Commercial Printing Shipments Up +3.4%; Six Consecutive Months of Growth Versus 2009
Published: November 4, 2010
September 2010 commercial printing shipments were $7.58 billion, up $248 million (+3.4%) compared to 2009. Adjusting for inflation, shipments were up +2.2%. “This continues the consecutive gain in current dollar shipments for six months, a welcome change for commercial printers,” explained Dr. Joe Webb, director of WhatTheyThink's Economics and Research Center. Full Analysis
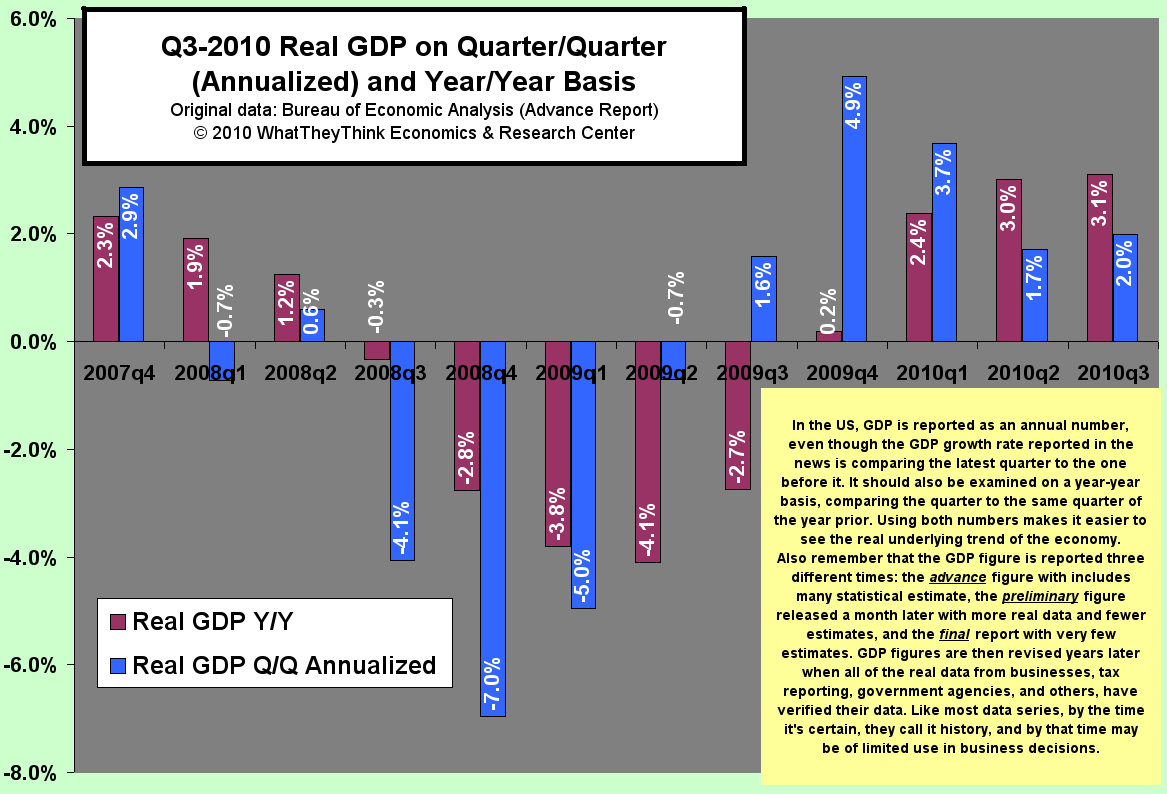
Q3 2010 Real GDP on Quarter/Quarter and Year/Year Basis
Published: November 1, 2010
Dr. Joe looks at the advance report for GDP in 2010's third quarter and explains what it means, what it doesn't, and why it might be worth ignoring. Full Analysis
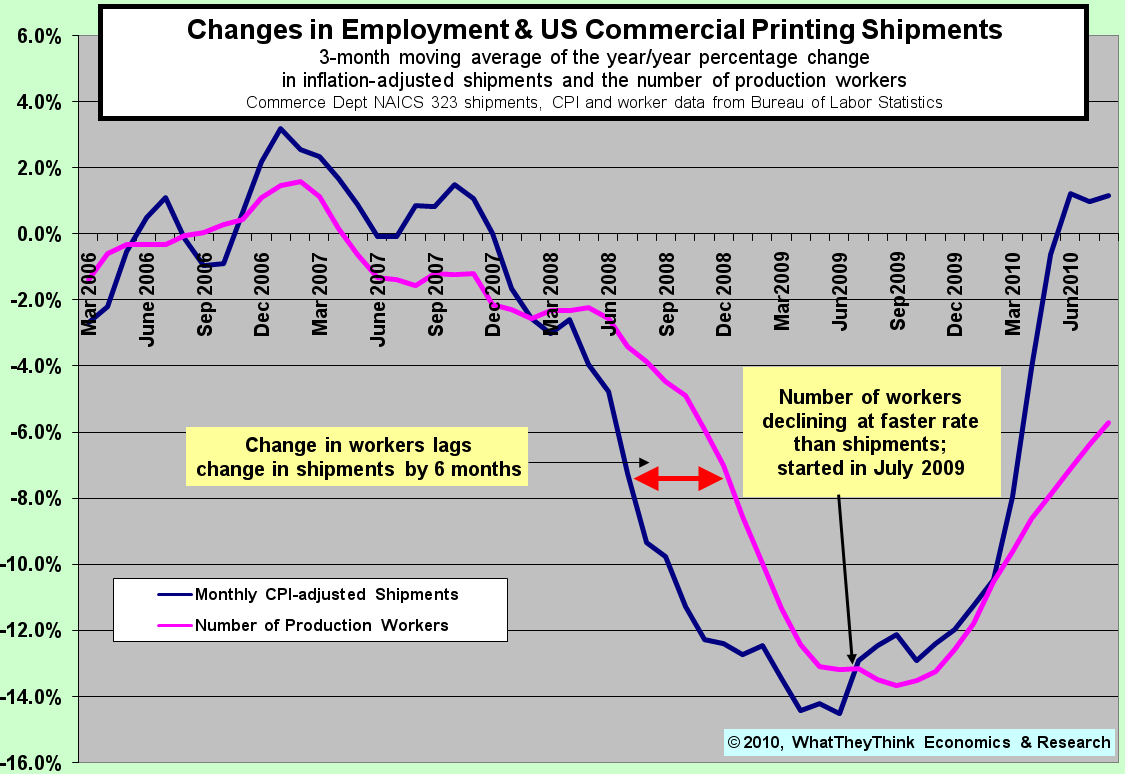
Change in Commercial Printing Segments 1997-2008
Published: October 18, 2010
Dr. Joe updates his look at the recent trends in printing industry employment and the last five months of increased sales are playing out. Full Analysis
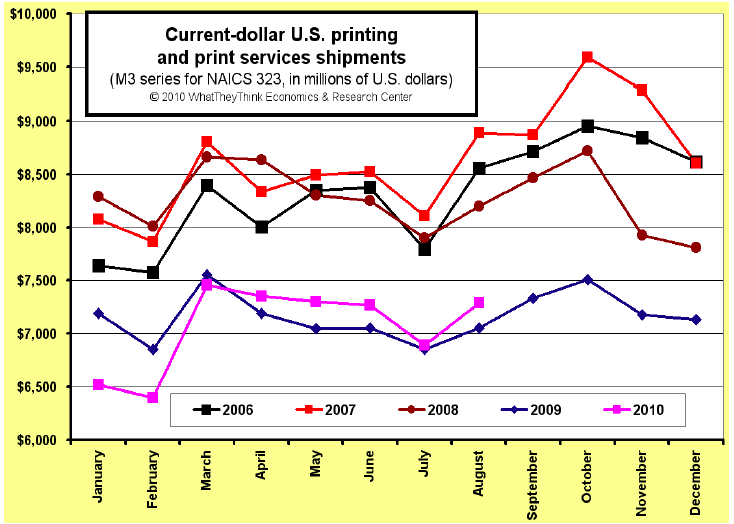
August U.S. Commercial Printing Shipments Up +3.3%
Published: October 11, 2010
August 2010 commercial printing shipments were $7.3 billion, up $235 million (+3.3%) compared to 2009. Adjusting for inflation, shipments were up +2.2. Full Analysis
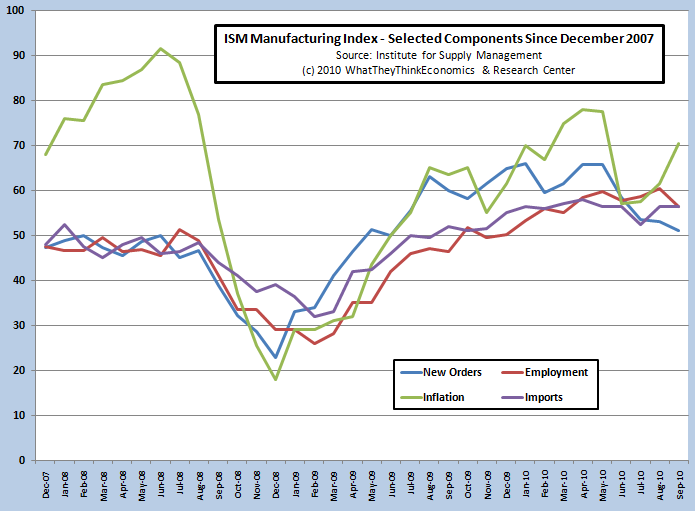
ISM Manufacturing Index - Selected Components Since December 2007
Published: October 4, 2010
Dr. Joe explains the latest Institute for Supply Management manufacturing report in terms of its key components of new orders, prices paid, employment, and imports. The manufacturing side of the economy is still growing, but it looks like it's slowing down, and inflation is starting to creep into the system. Full Analysis
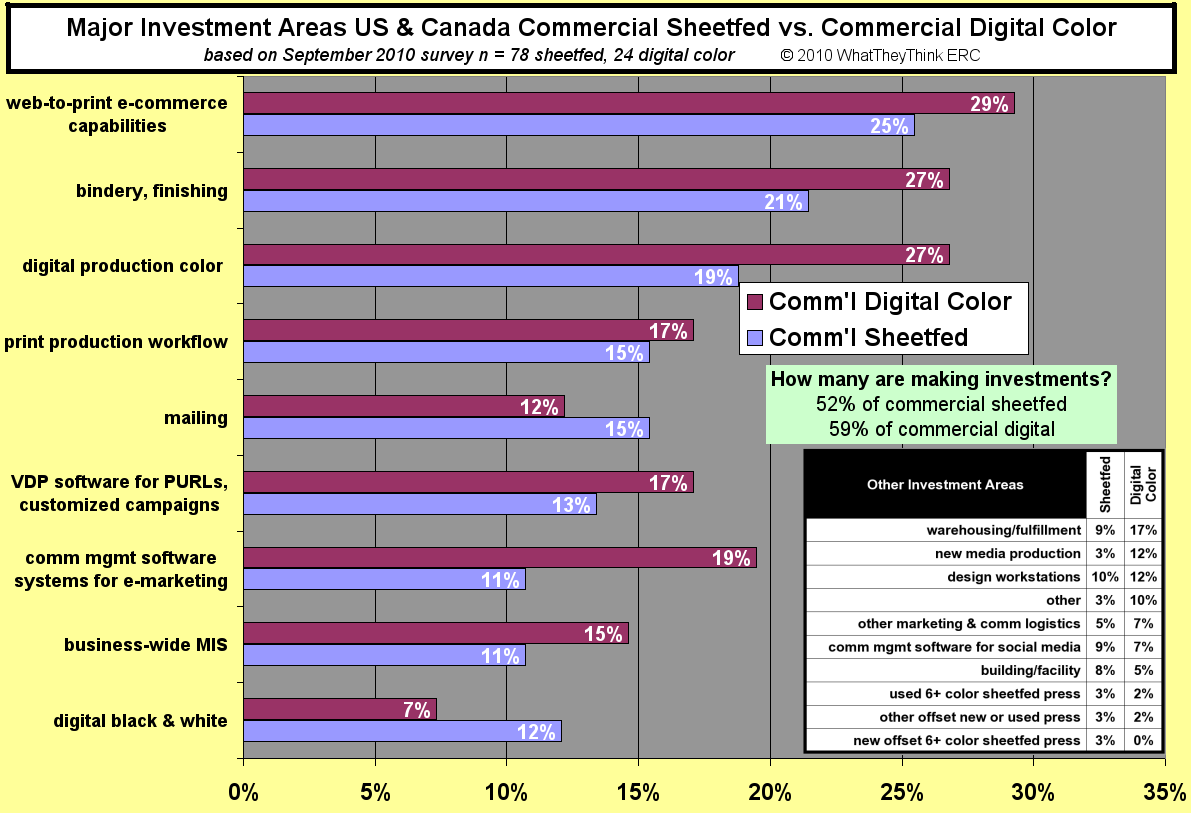
Major Investment Areas Commerical Sheetfed vs. Commercial Digital Color
Published: September 20, 2010
As we head into GraphExpo, what does our latest survey show that commercial sheetfed and commercial color digital printers are looking for? Dr. Joe explains it all Full Analysis
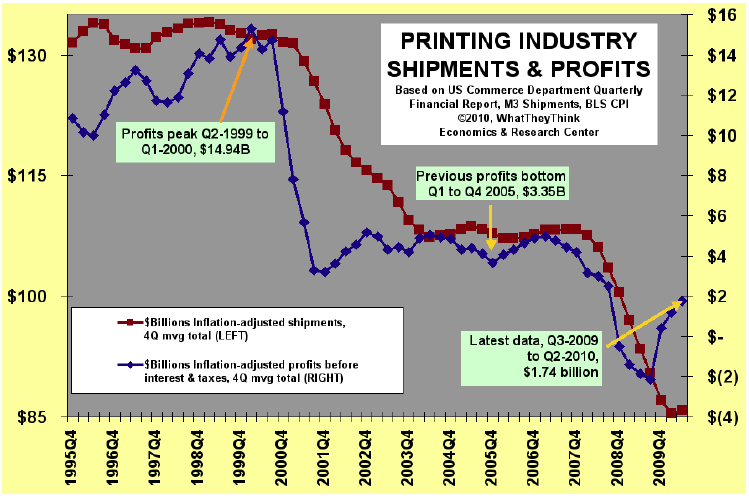
U.S. Commercial Printing Businesses Produce Estimated $1.1 Billion in Profits in Second Quarter 2010
Published: September 15, 2010
The second quarter of 2010 continued a welcome continuation of mild profitability for the industry. Much of the industry is still recovering from a very difficult 2009, and two quarters of profits can't really make up for that. But we're on the right track, even though there are still challenges ahead. Full Analysis
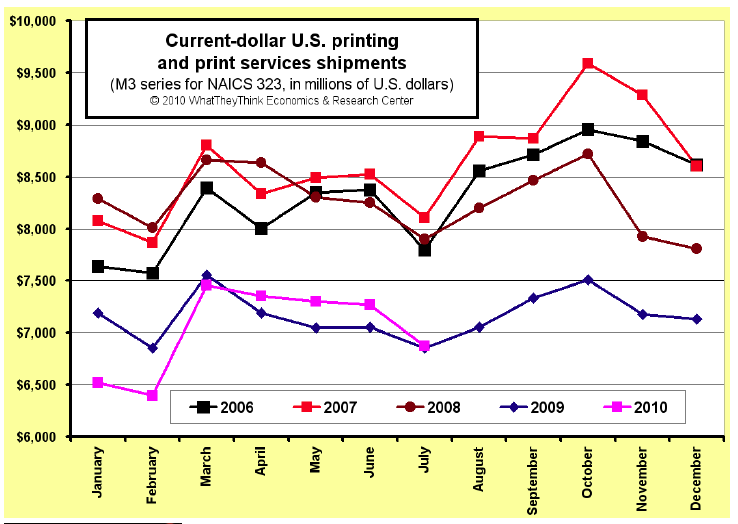
July U.S. Commercial Printing Shipments Up +0.3%
Published: September 7, 2010
July 2010 commercial printing shipments were $6.87 billion, up $18 million (+0.3%) compared to 2009. Adjusting for inflation, shipments were down -1%. This continues the consecutive gain in current dollar shipments for four months, the first time we have had a period of that extent since November 2007. Full Analysis
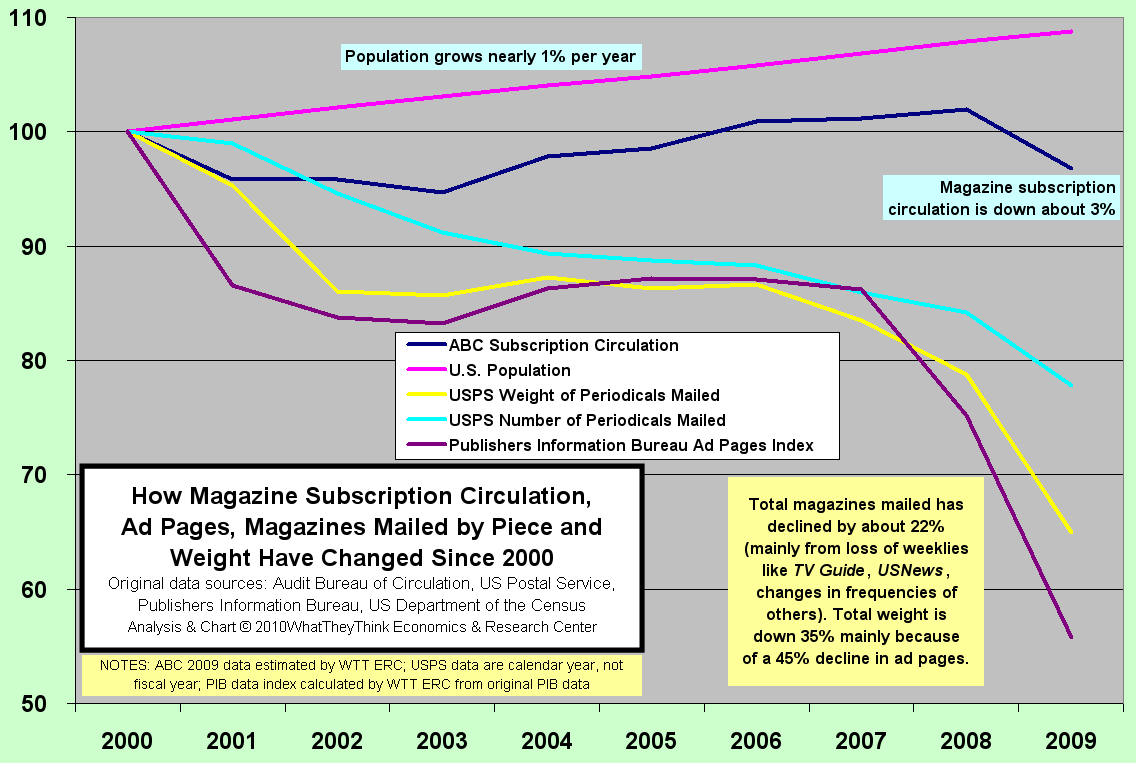
How magazine circulation, ad pages and mailed by piece has changed since 2000
Published: August 16, 2010
How have magazines changed over the last 10 years? Dr. Joe looks at subscription circulation, ad pages, postal shipments and weight, and what they tell us about this critical segment of our industry. Full Analysis
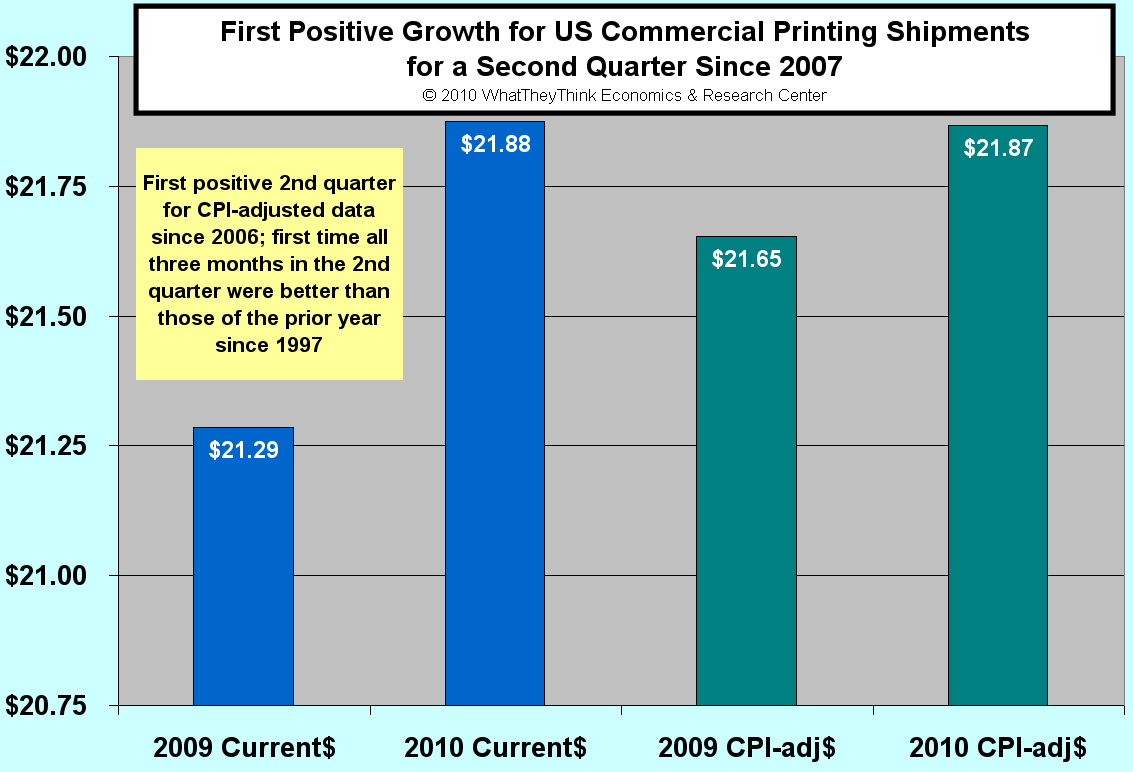
Second Quarter U.S. Commercial Printing Shipments Up +2.8%
Published: August 3, 2010
June 2010 commercial printing shipments were $7.2 billion, up +2.4% compared to 2009. Adjusting for inflation, shipments were up +1.3%. “This is the first three month gain in shipments on an inflation-adjusted basis since the period of October 2006 through April 2007. Full Analysis
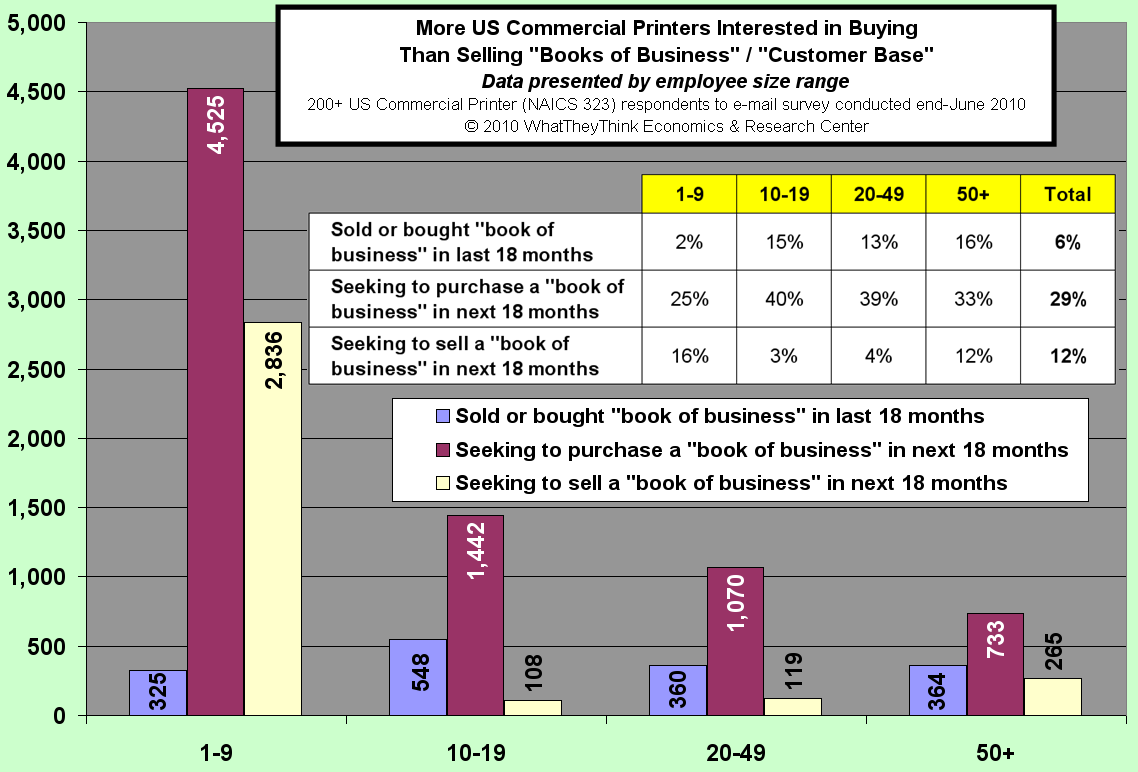
More printers interested in buying than selling books of business customer base
Published: August 2, 2010
Who's buying and who's selling? The print business has been consolidating, and we're certain there is more to go, especially with the popularity of "tuck-ins." Dr. Joe explains why "tuck-ins" are not about what you should do with your shirt, but how it has slowly been creating a more efficient industry. Full Analysis
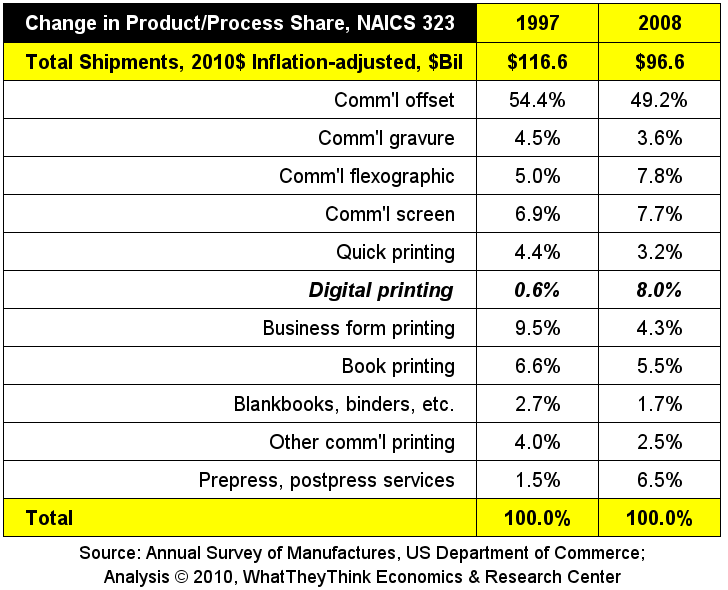
Change in Commerical Printing Segments 1997-2008
Published: July 19, 2010
Dr. Joe discusses how commercial printing segments have changed their share of industry shipments from 1997 through 2008, and why digital printing's share might be even larger than the data indicate. Full Analysis
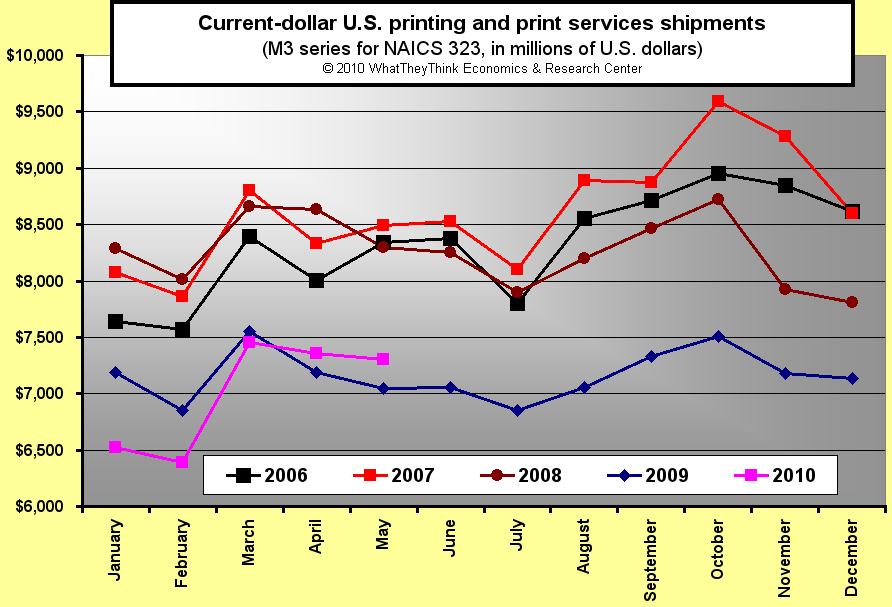
May U.S. Commercial Printing Shipments Up +3.6%
Published: July 6, 2010
May's shipments were up compared to 2009, and April's were revised significantly upward. This is the first time since early 2008 that the industry produced two consecutive months with shipment increases. For complete details see this month's printing shipments report. Full Analysis
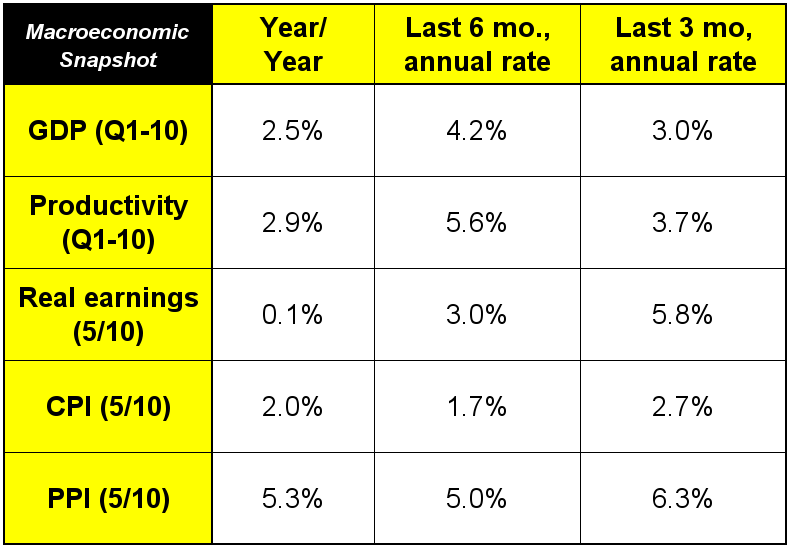
Dr. Joe reviews the latest economic data
Published: June 21, 2010
Dr. Joe reviews the latest economic data and explains where we're headed for the third and fourth quarters and why. Full Analysis
April 2010 commercial printing shipments
Published: June 7, 2010
April 2010 commercial printing shipments were $7.05 billion, down -1.9% compared to 2009. Adjusting for inflation, shipments were down -4.1%. For the first four months of 2010, shipments were down -4.7% on a current dollar basis. Full Analysis
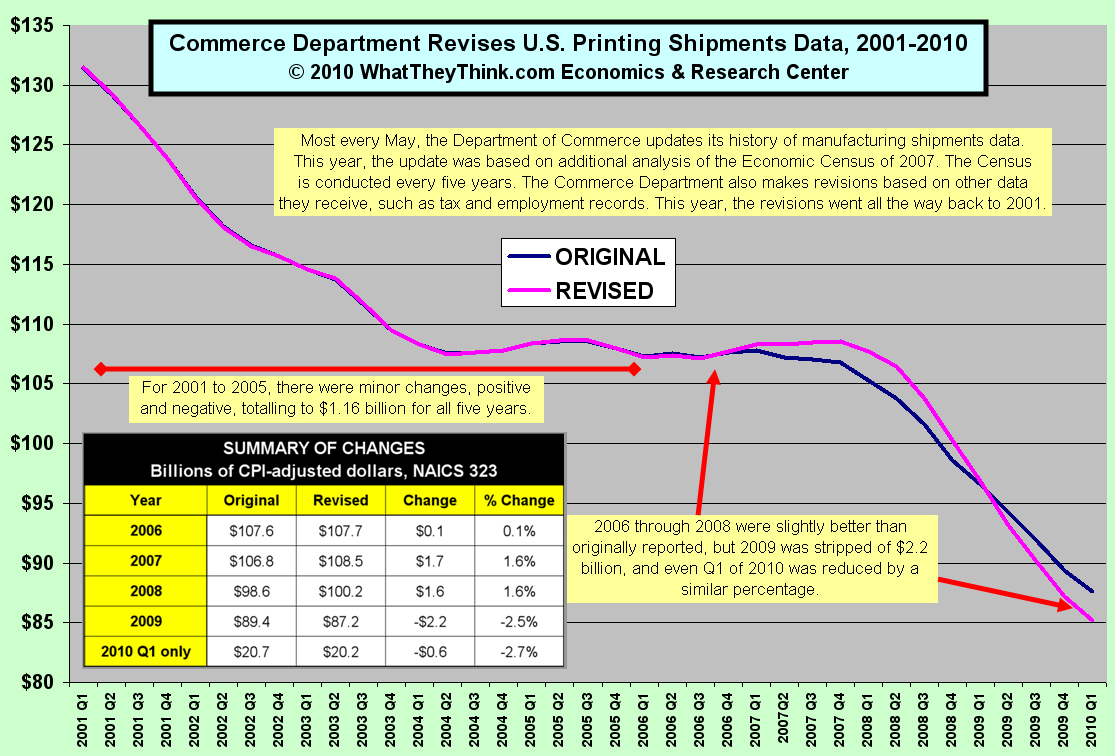
Commerce Department Revises Printing Shipments Data
Published: May 17, 2010
The Department of Commerce revised almost 10 years of printing industry shipments data last week. The WhatTheyThink economic data elves dug into the data and explain what those revisions mean, what years were revised up, and which ones were revised down. Full Analysis
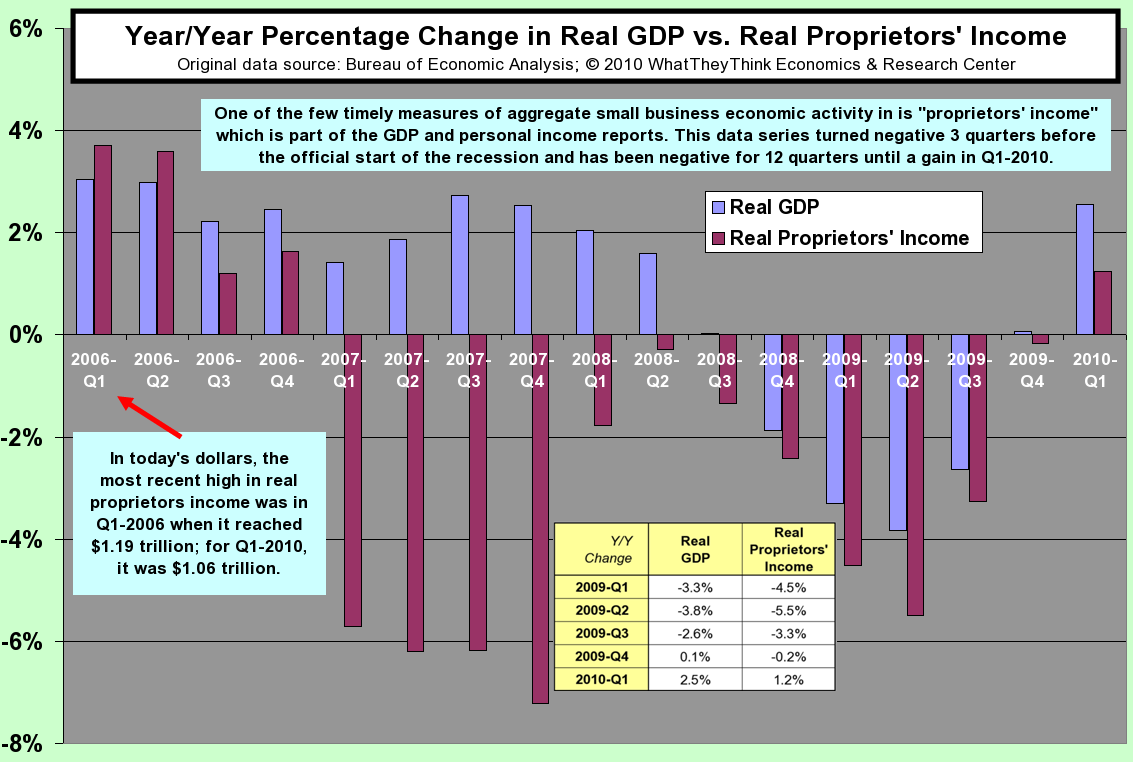
Year/Year Changes in Real GDP vs. Real Proprietors Income
Published: May 3, 2010
The first quarter GDP showed that the economy is growing, but that was compared to the fourth quarter. How is GDP changing on a year-to-year comparison? The GDP data are about the whole economy, but how is small business doing? Dr. Joe explains how a rarely reported part of the quarterly GDP data helps us judge the health of small businesses. Full Analysis
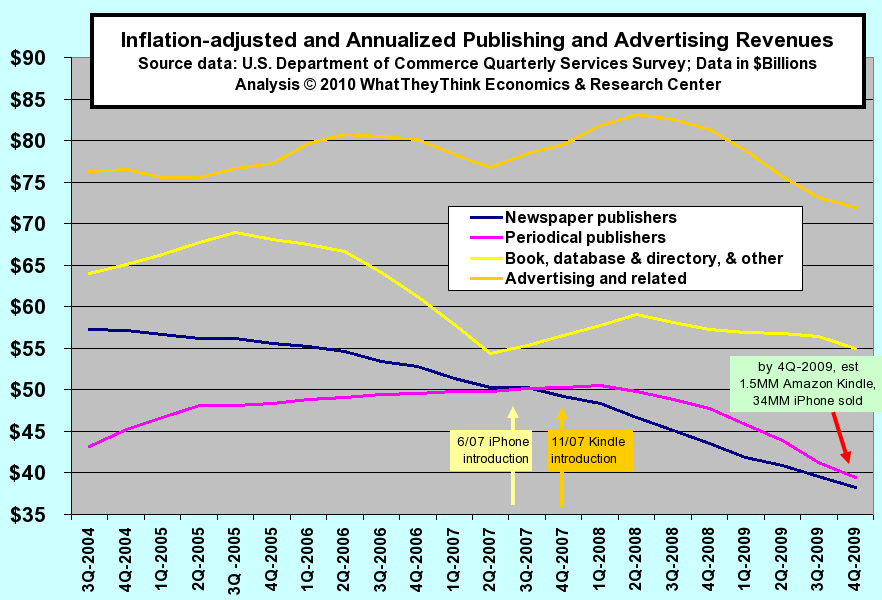
Inflation-adjusted and Annualized Publishing and Advertising Revenues
Published: April 19, 2010
The trends in industry revenues of advertising and publishing sectors each tell an interesting story. They get more interesting once iPhones, Kindles, and iPads are added to the mix. Dr. Joe explains it all, but may have more questions than answers, which might spell opportunities for print businesses. Full Analysis
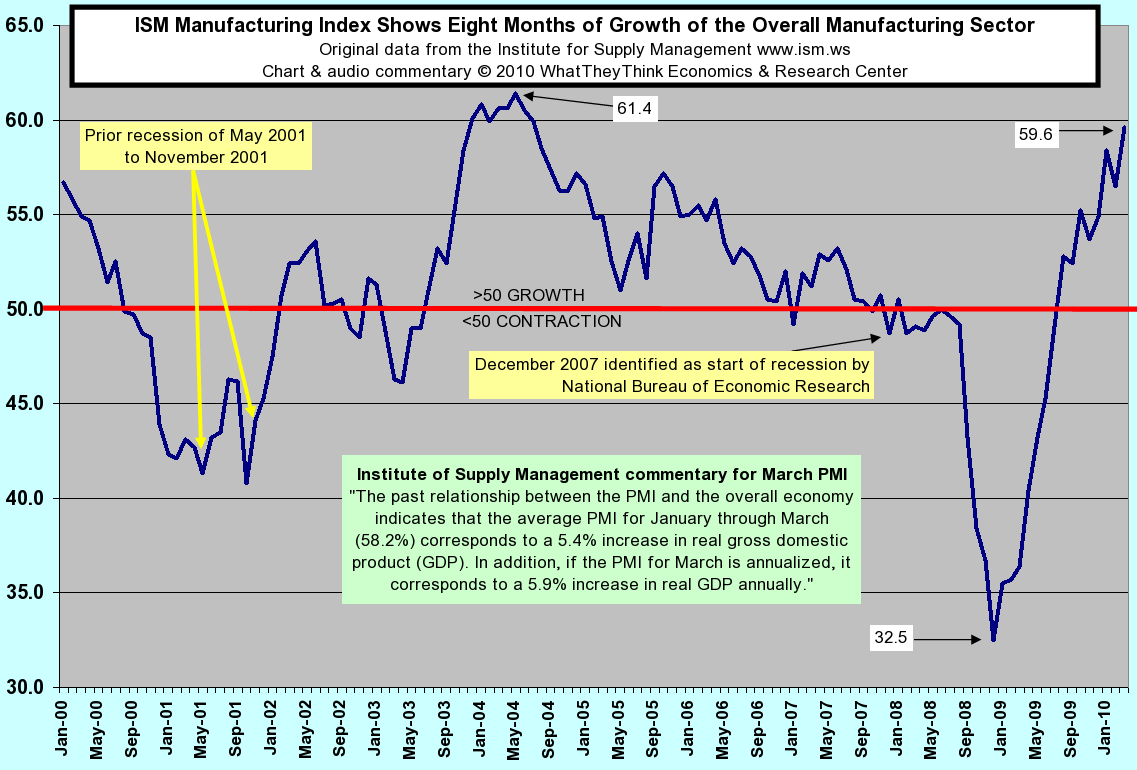
ISM Manufacturing Index Shows Eight Months of Growth
Published: April 5, 2010
The ISM Manufacturing Index is one of the most watched economic indicators. It's up for 8 consecutive months, and the latest release was one of the strongest of this decade. Dr. Joe gives some background and explains what this latest reading means. Full Analysis
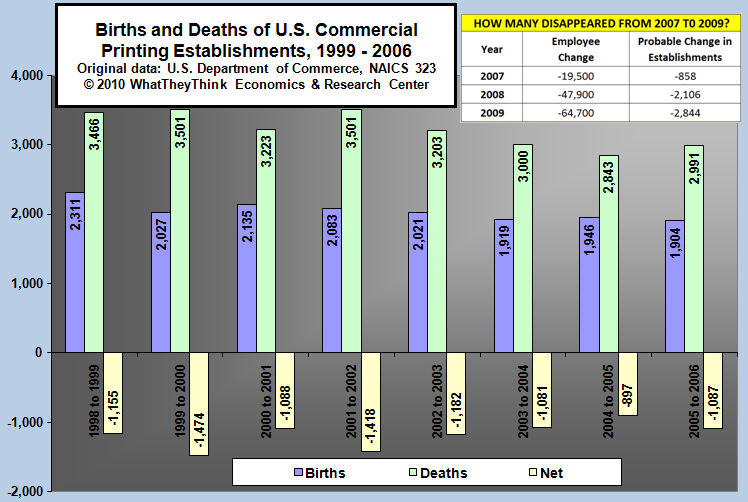
As The Industry Churns
Published: March 15, 2010
The Census Bureau publishes printing industry births and deaths data, but the data take years to be published. The latest data are from 2006, but Dr. Joe estimates what's happened since,especially 2008 and 2009. Full Analysis
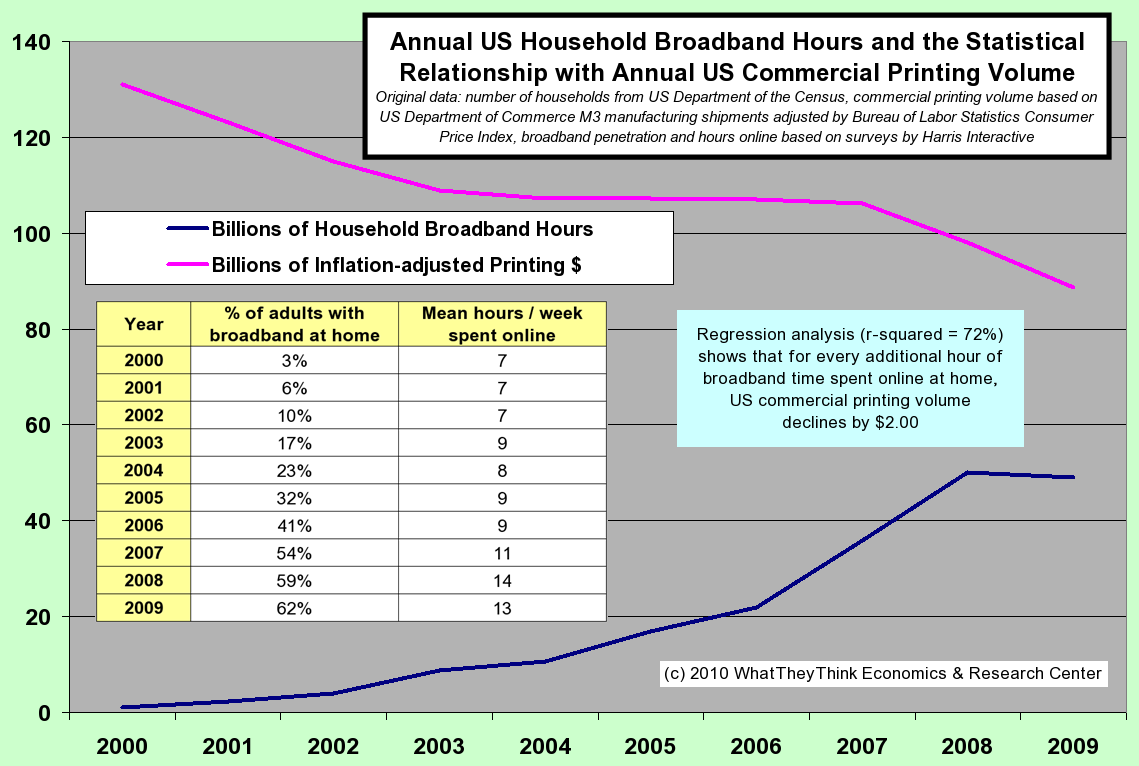
Broadband hours and the statistical relationship with printing volumes
Published: February 15, 2010
Broadband use by adults has been increasing and the number of households with broadband service has almost doubled since 2005. What's the relationship with commercial printing volume? Last year, there were about 48 billion hours of broadband use by households, and every additional hour of use decreases commercial print volume by about $2. Full Analysis
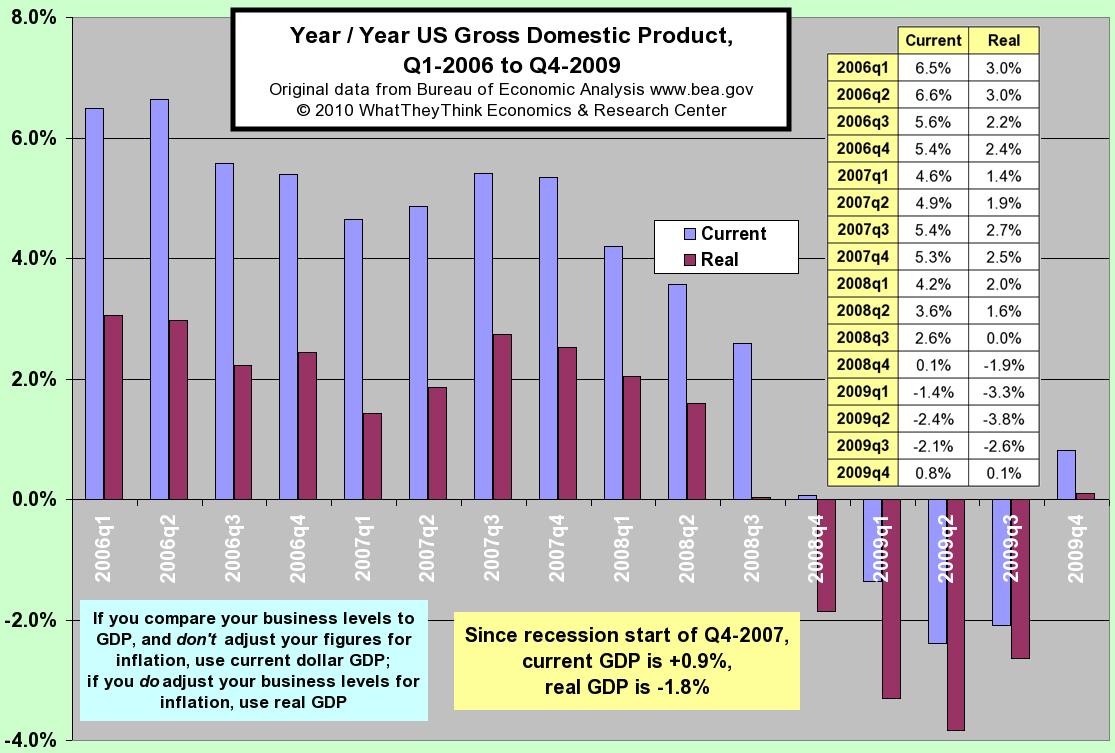
Year/Year US Gross Domestic Product
Published: February 1, 2010
Why was Q4-09 GDP +5.7% met with a stock market decline and more handwringing about the economy? Dr. Joe looks at the yearly change in GDP, and explains it all. Full Analysis
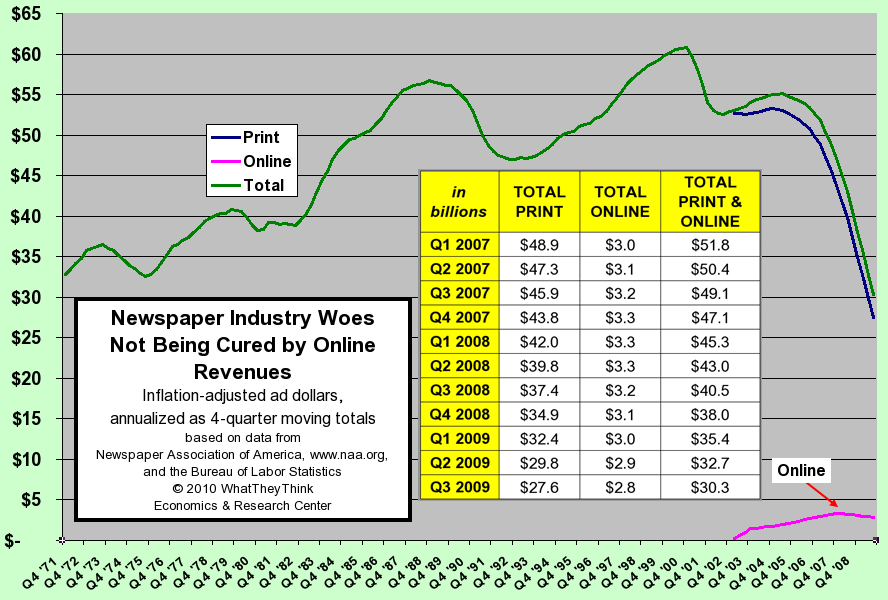
Newspaper Industry Woes Not Being Cured By Online Revenues
Published: January 25, 2010
Newspapers were supposed to survive the new media age because of their highly educated, high income audience, and then when that didn't work, their superior content would make news websites into Internet advertising magnets. Now, even online advertising is shrinking for newspapers. What's next? Full Analysis
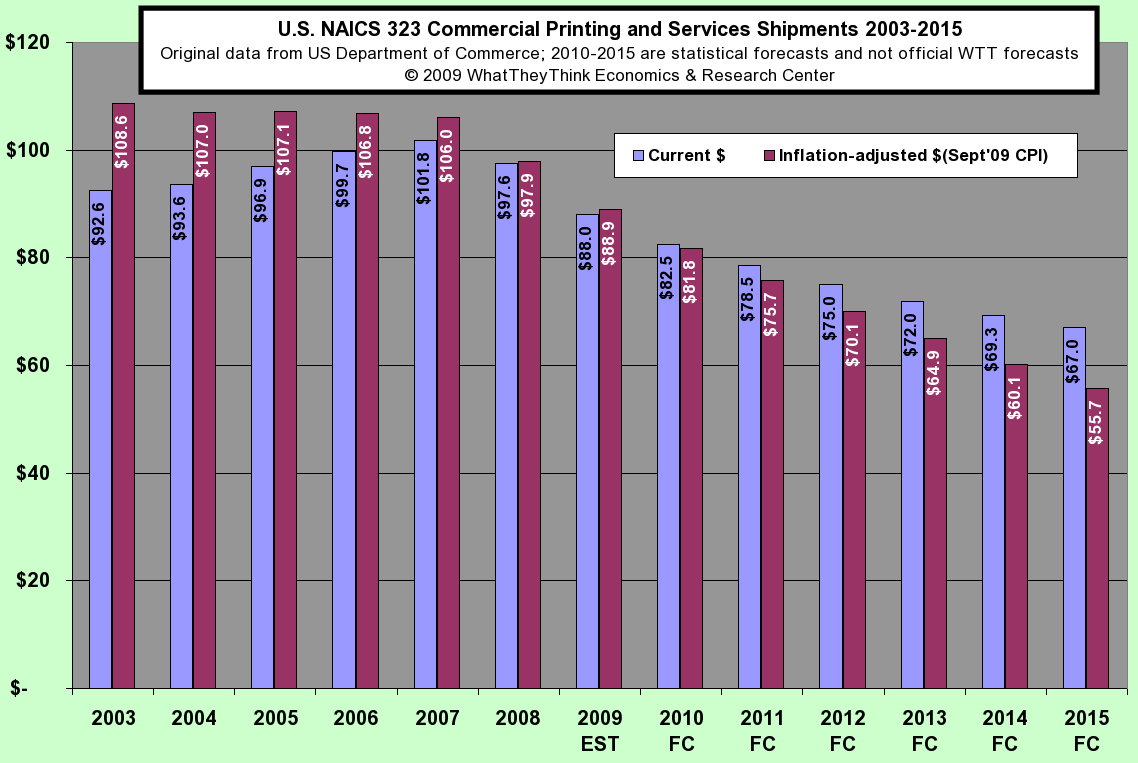
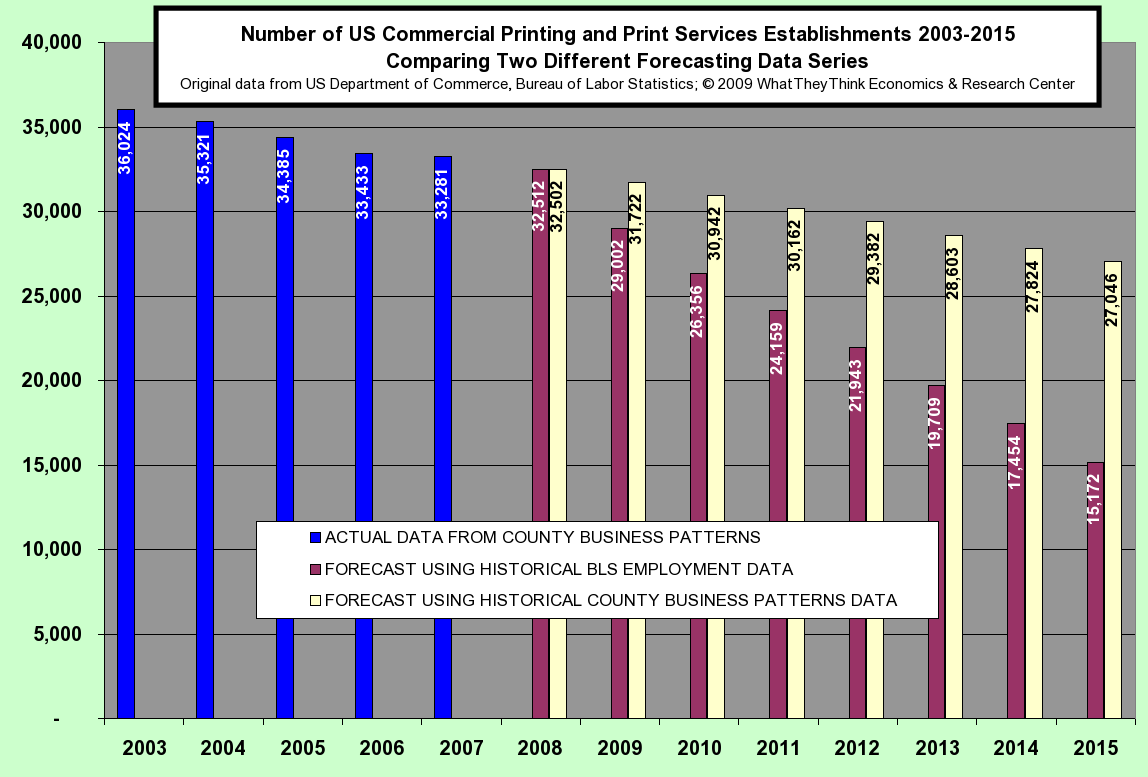
Number of US Commercial Printing and Print Services Establishments 2003-2015
Published: December 7, 2009
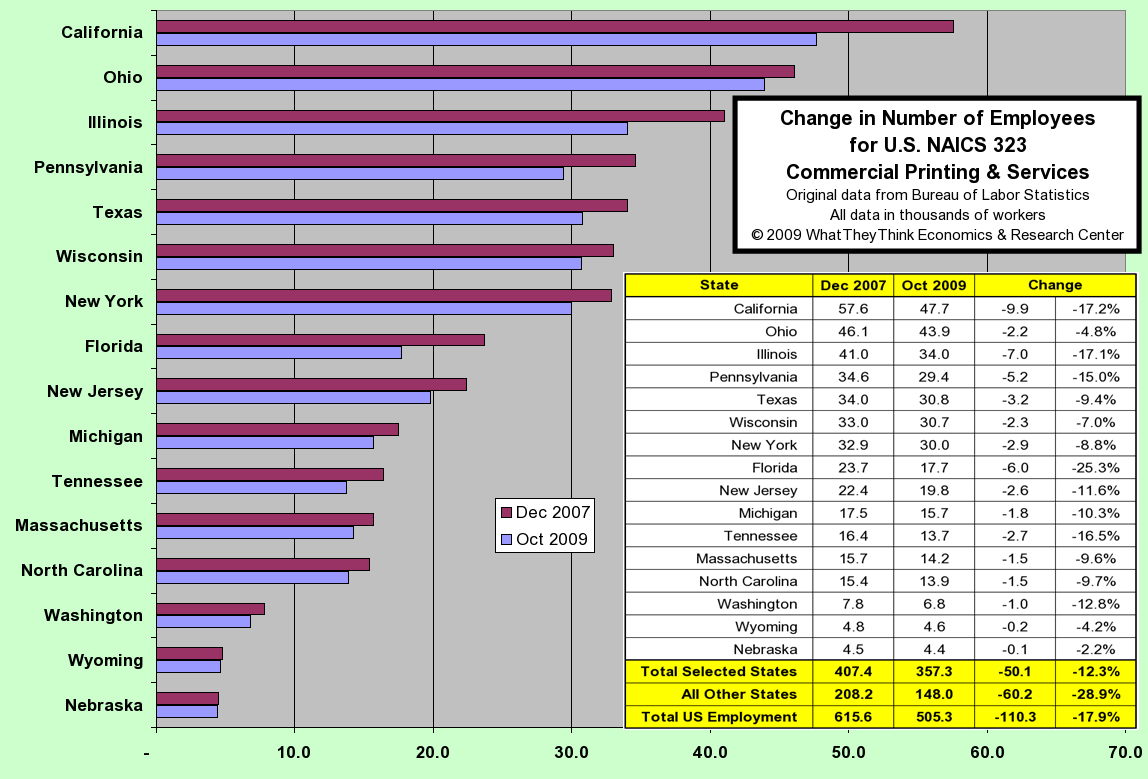
Change In Number Of Employees For Commerical Printing & Services
Published: November 30, 2009
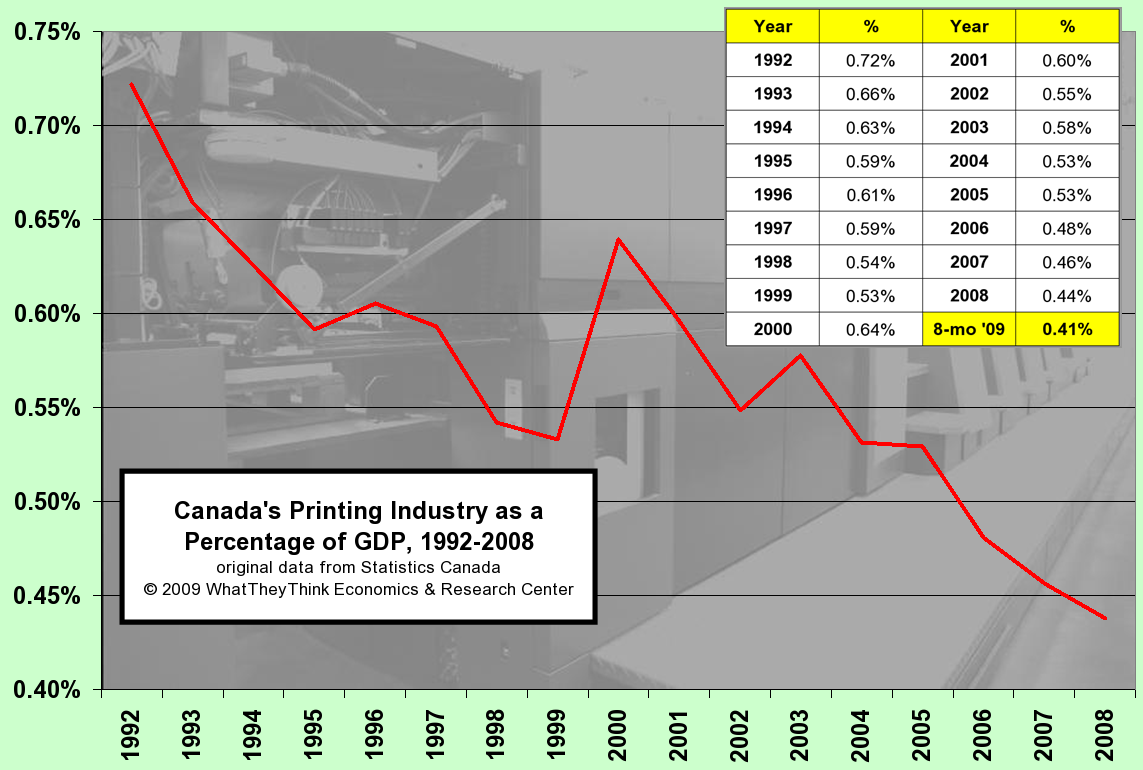
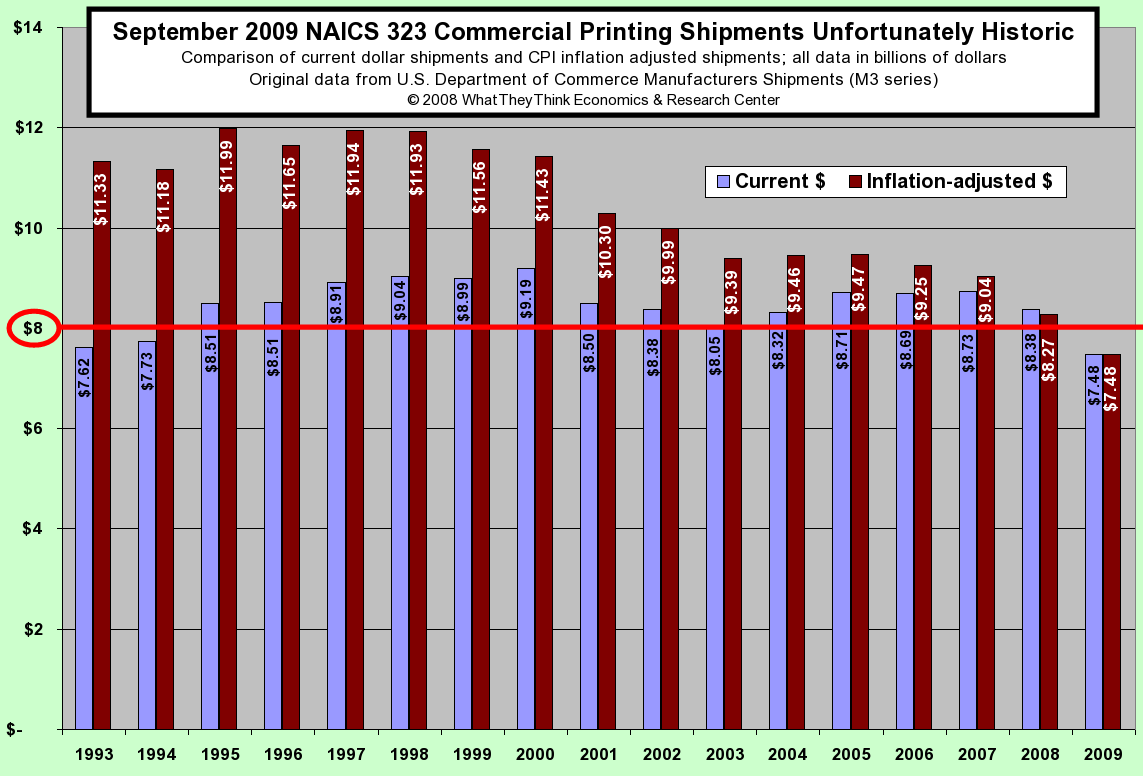
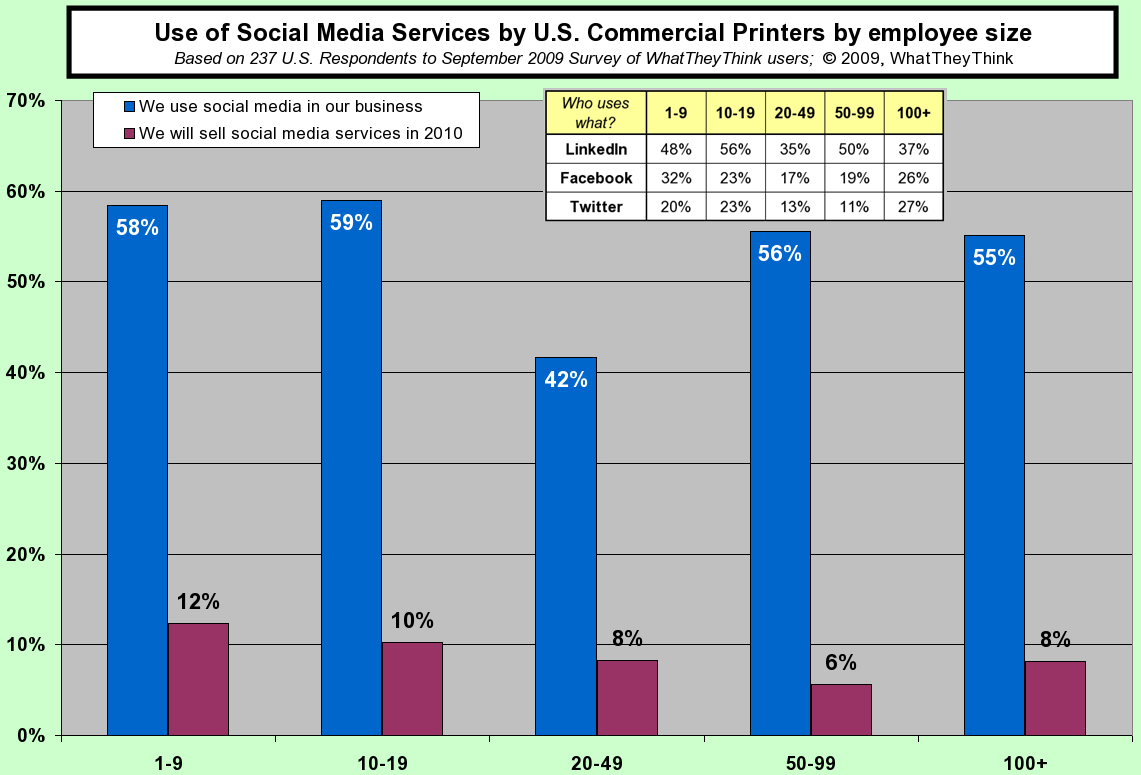
Use of Social Media Services by Commercial Printers by employee size
Published: November 2, 2009
Use of Social Media Services by Commercial Printers by employee size Full Analysis
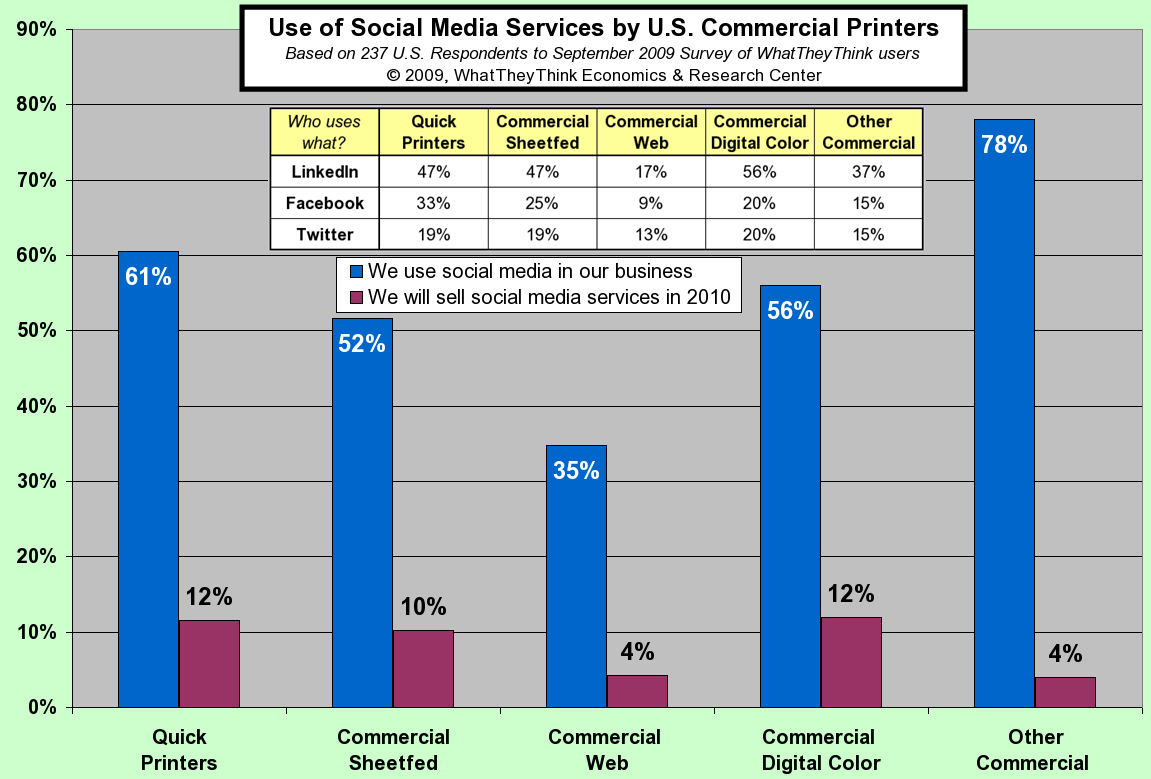
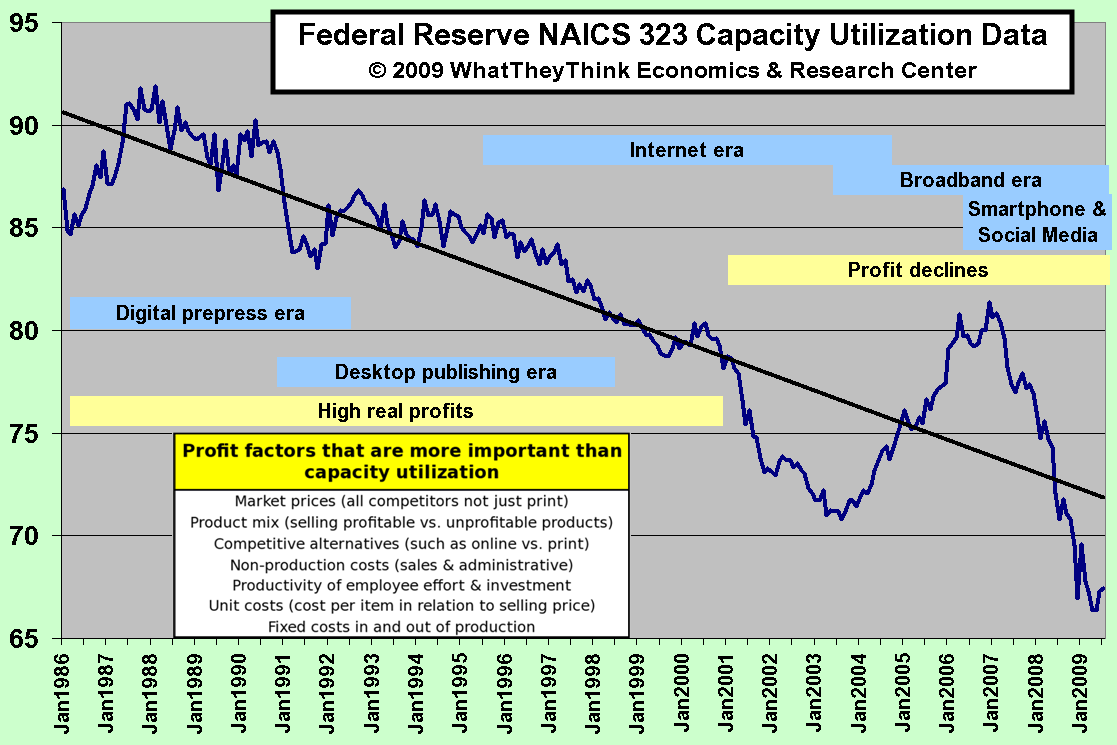
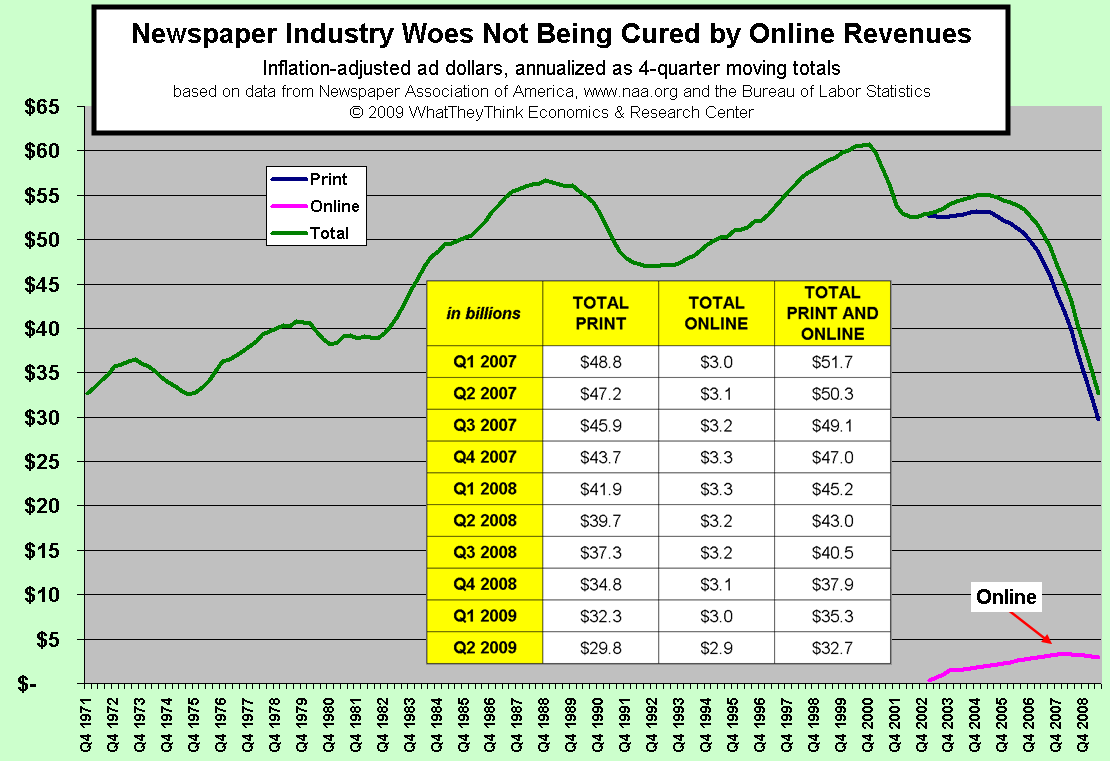
Newspaper Industry Woes Not Being Cured by Online Revenues
Published: October 12, 2009
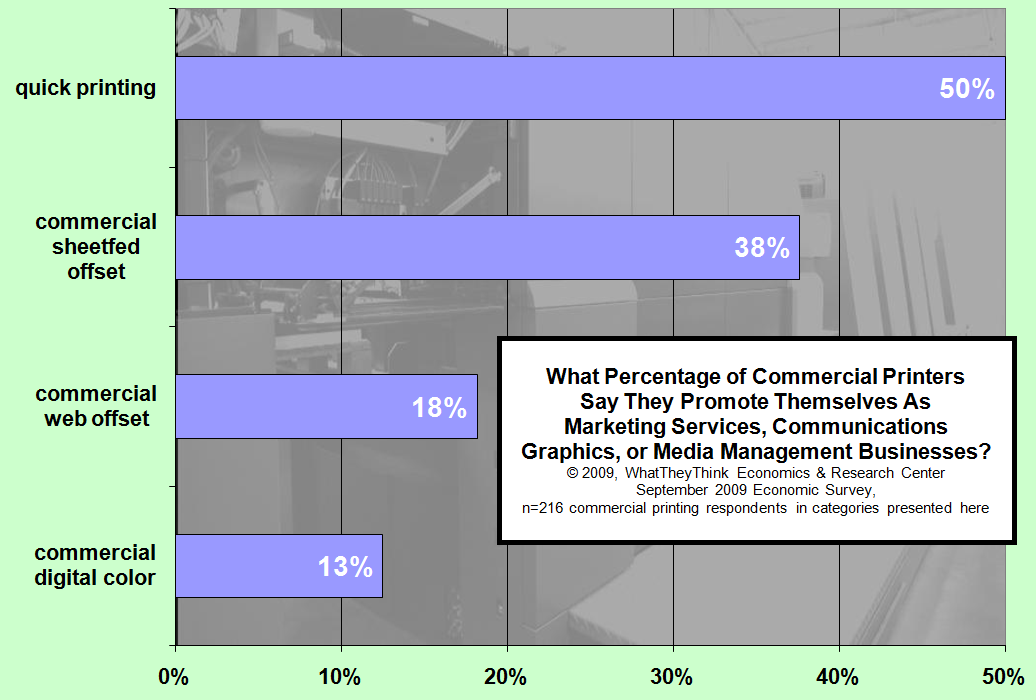
Percentage of Printers That Promote Themselves as Marketing Services, Communications Graphics or Media Management Businesses
Published: October 5, 2009
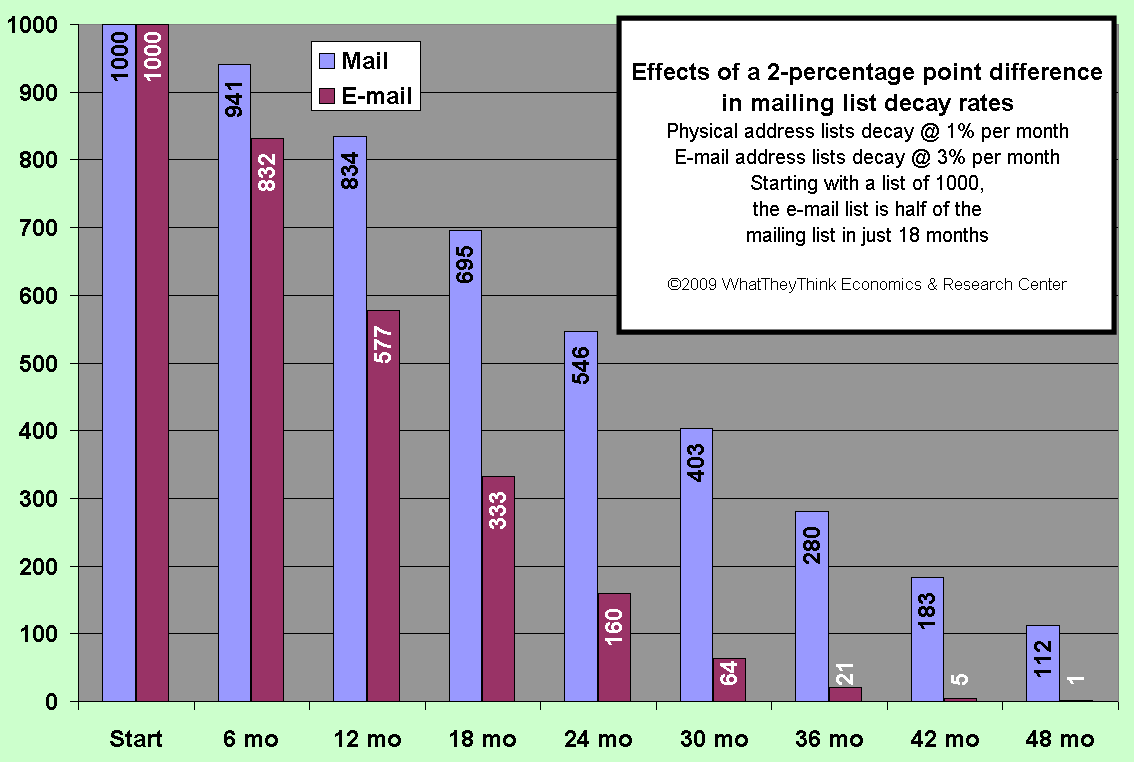
Effects of a 2-percentage point difference in mailing list decay rates
Published: September 28, 2009
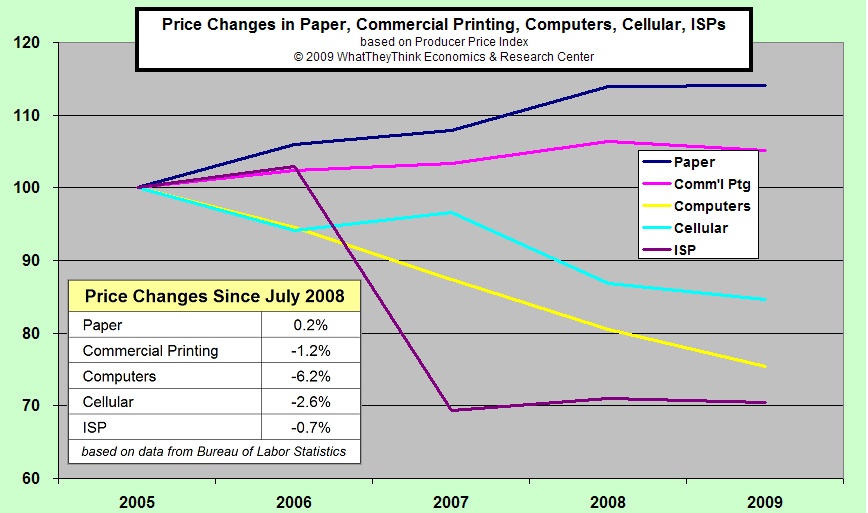
Price Changes in Paper, Commerical Printing, Computers, Cellular, ISPs
Published: September 21, 2009
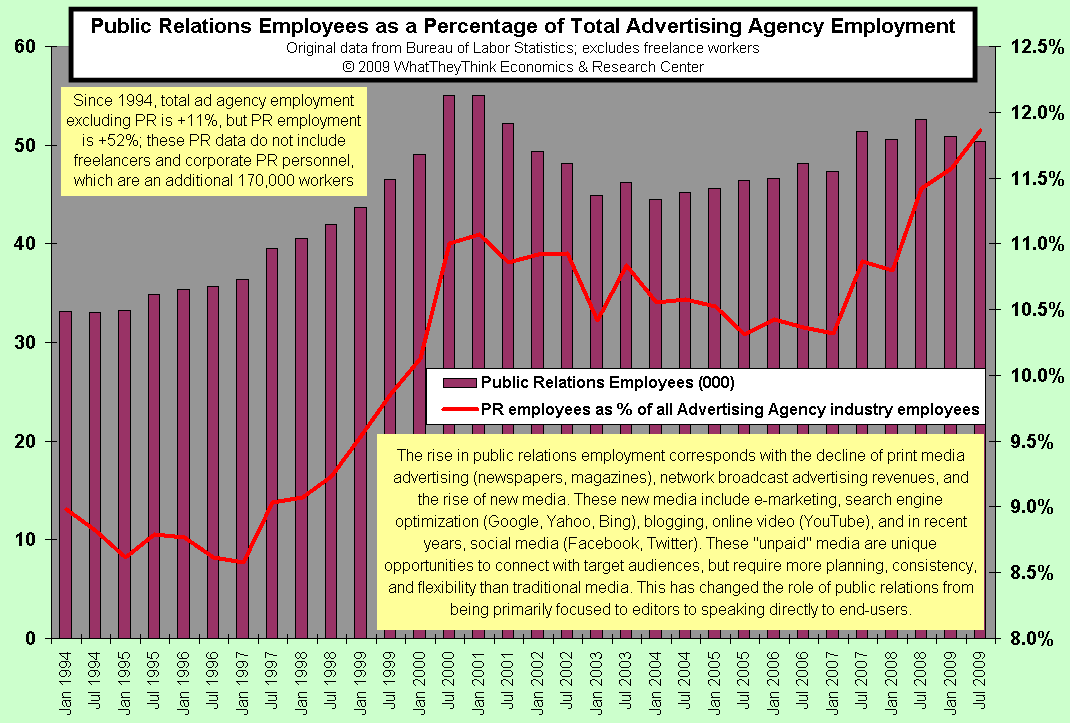
Public Relations Employees as a Percentage of Total Advertising Agency Employment
Published: September 14, 2009
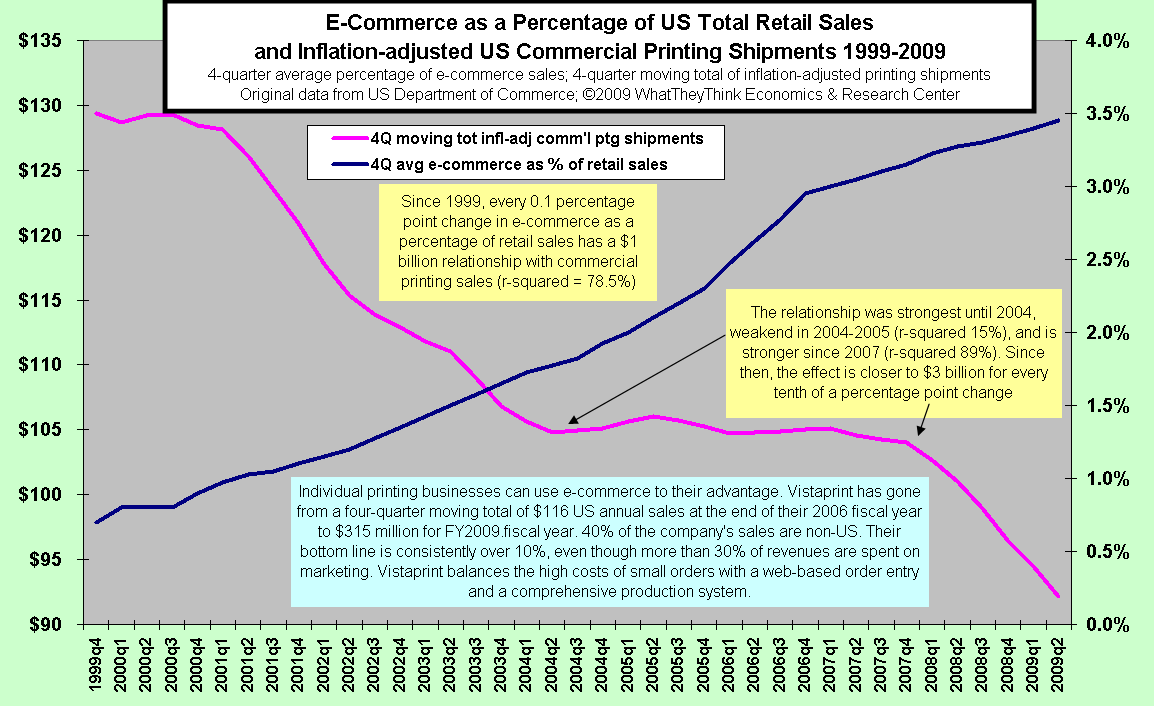
E-Commerce as a Percentage of US Total Retail Sales and Inflation-adjusted US Commercial Printing Shipments
Published: September 7, 2009
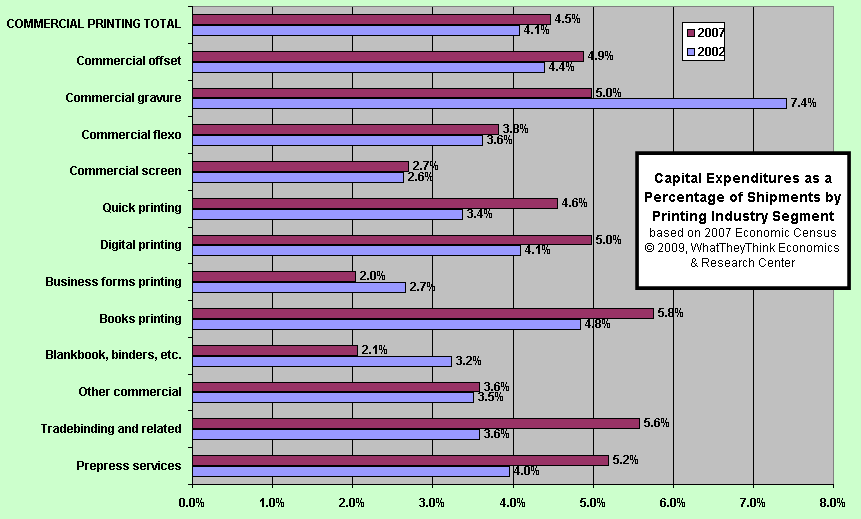
Capital Expenditures as a Percentage of Shipments by Printing Industry Segment
Published: August 31, 2009
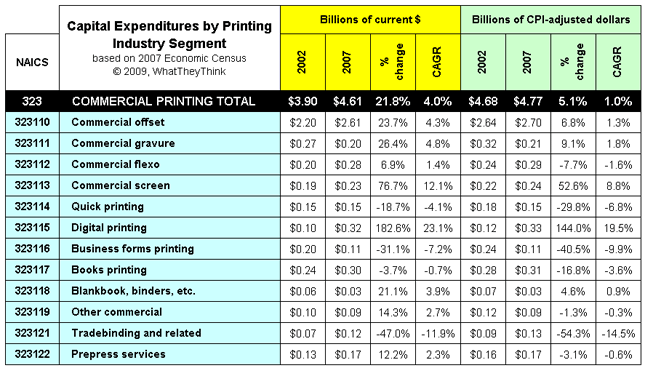
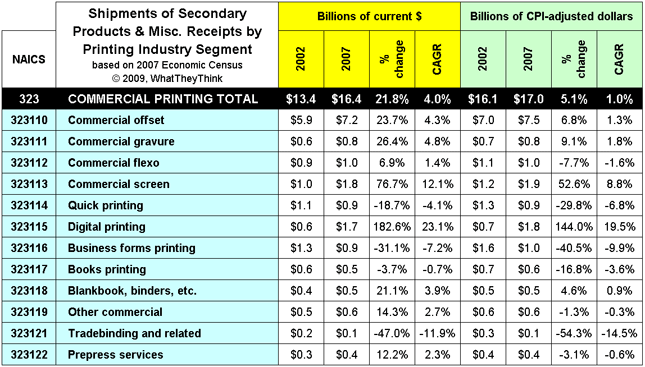
Shipments of Secondary Products & Misc. Receipts by Printing Industry
Published: August 17, 2009
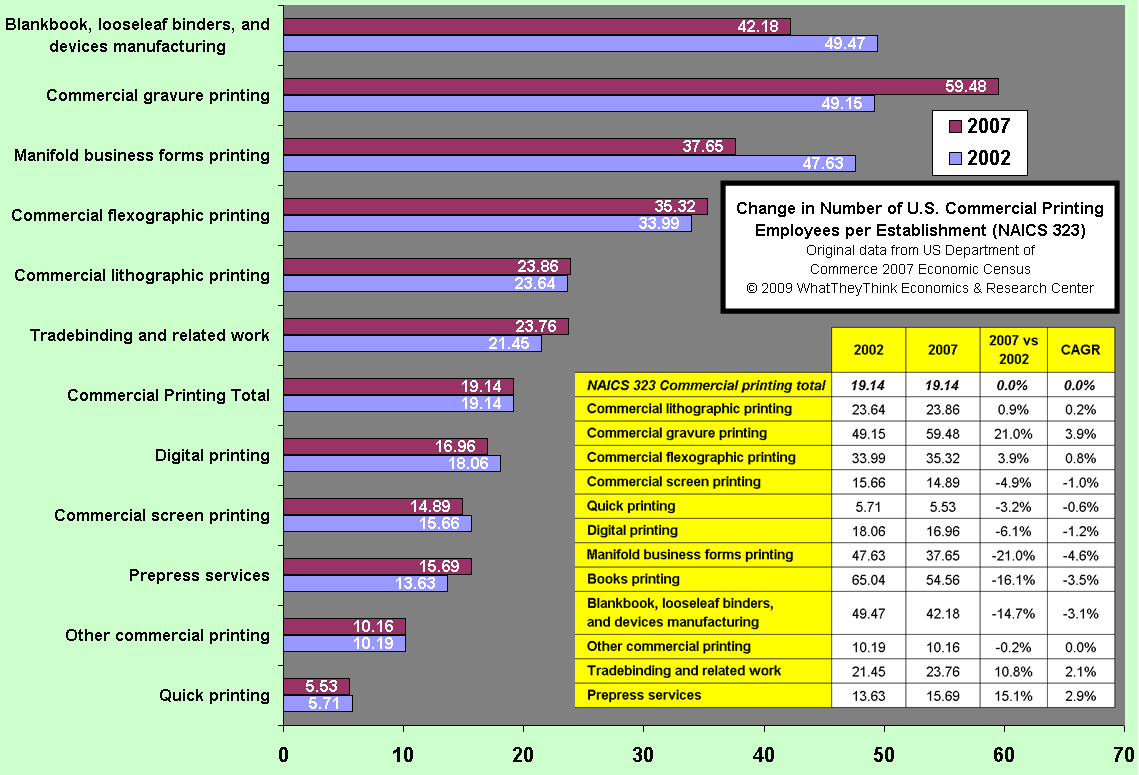
Change in Number of U.S. Commercial Printing Employees Per Establishment
Published: August 10, 2009
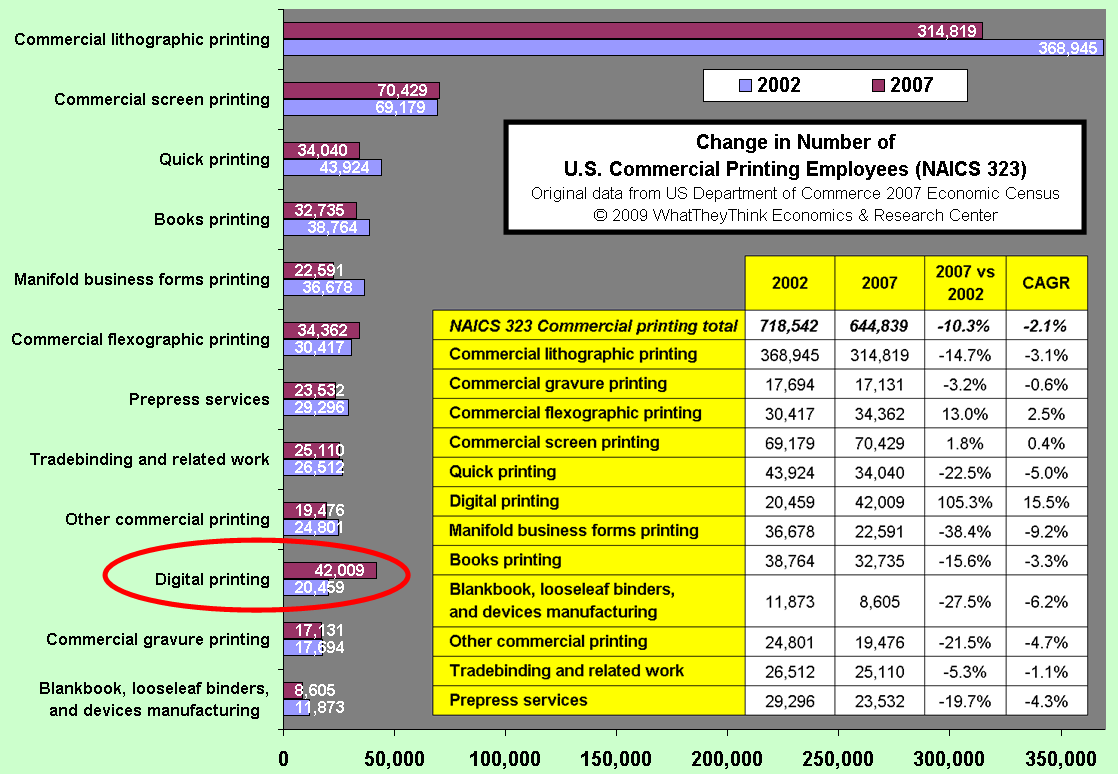
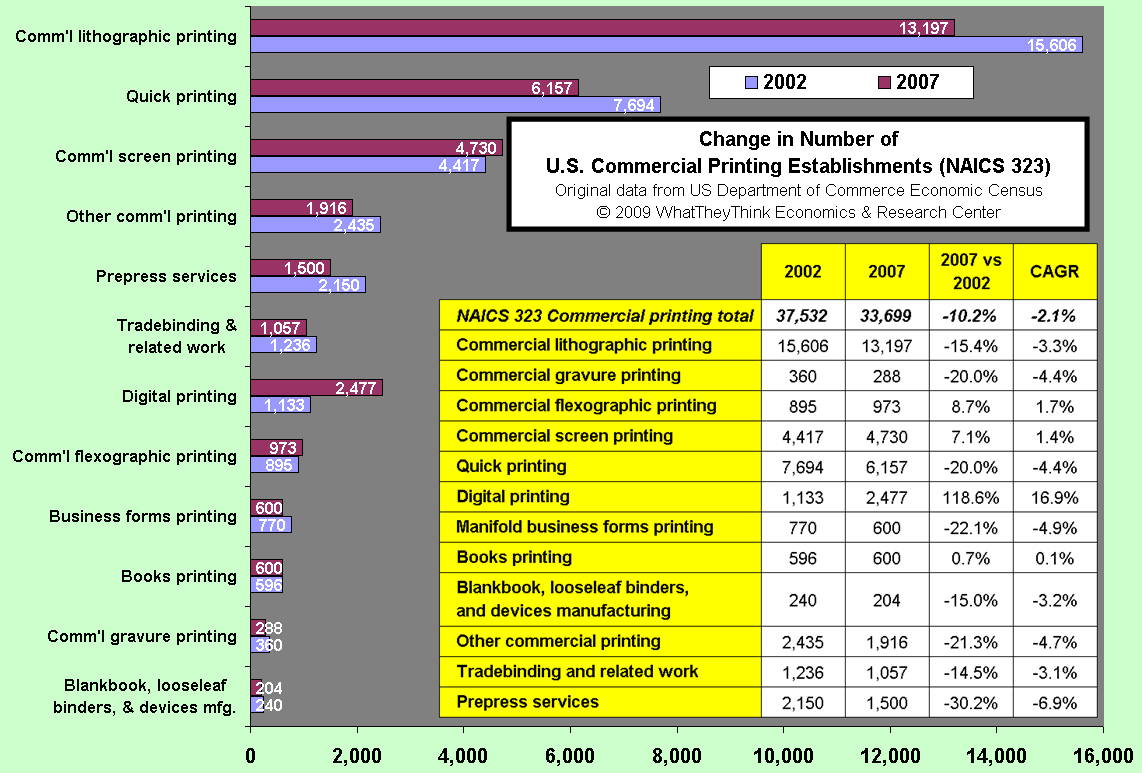
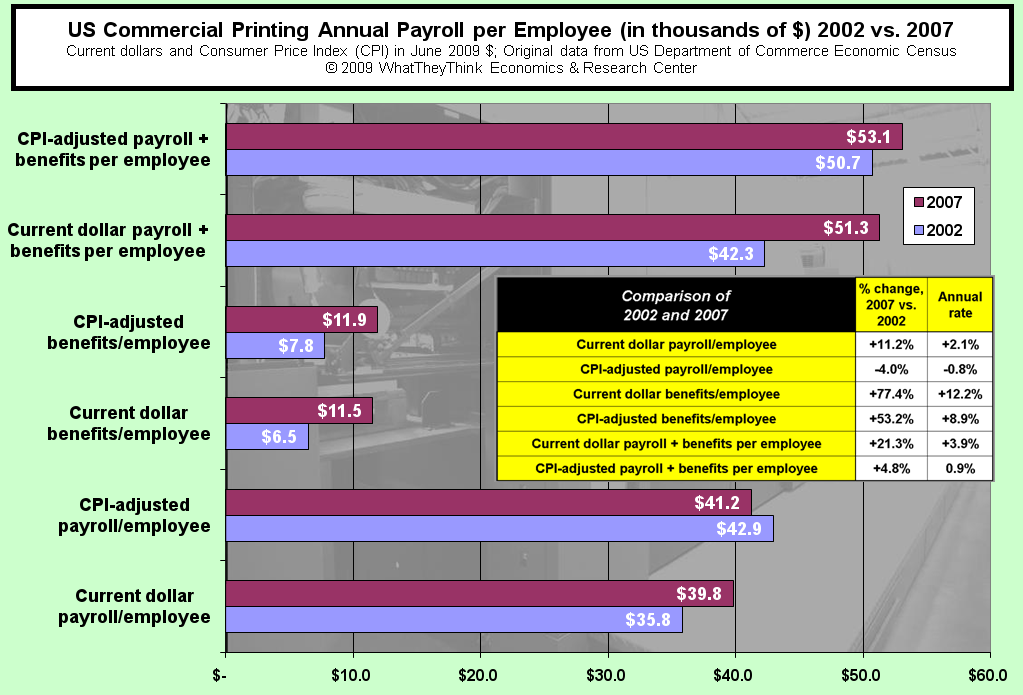
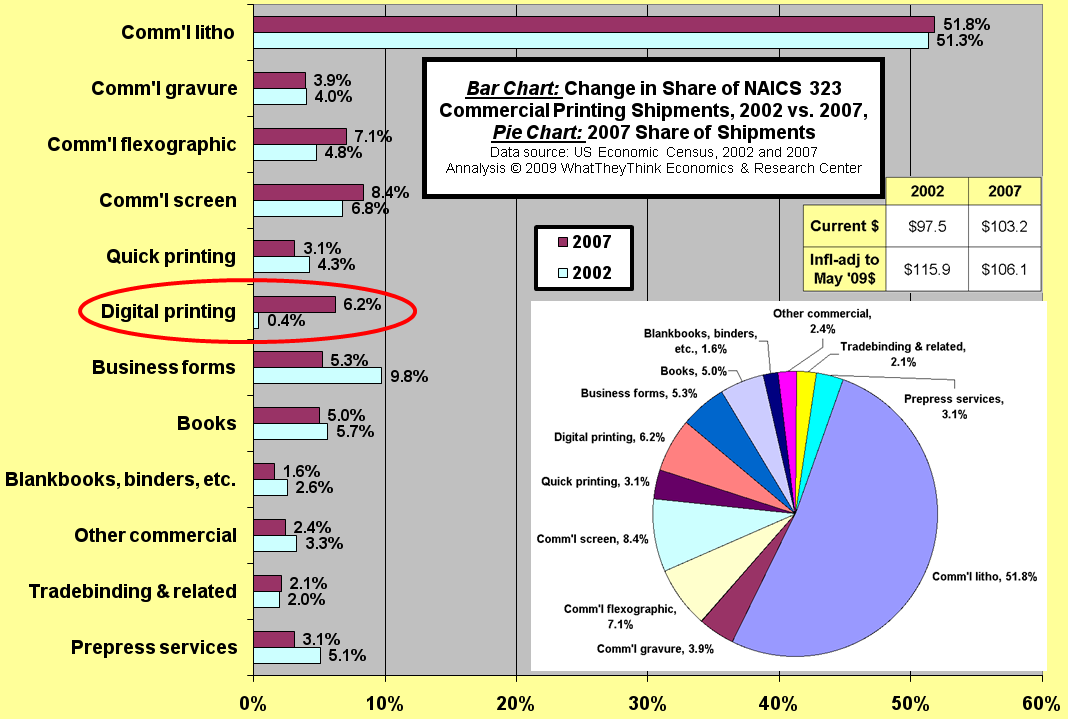
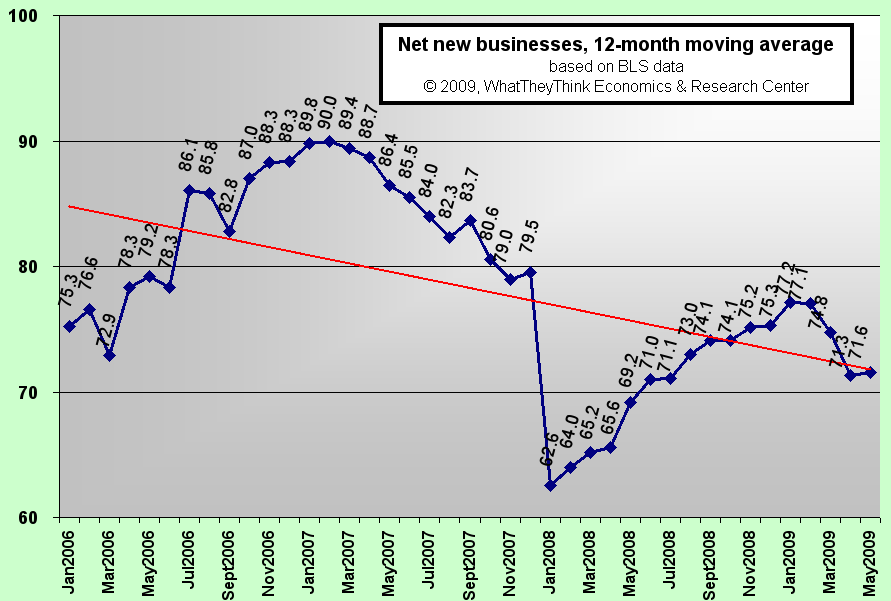
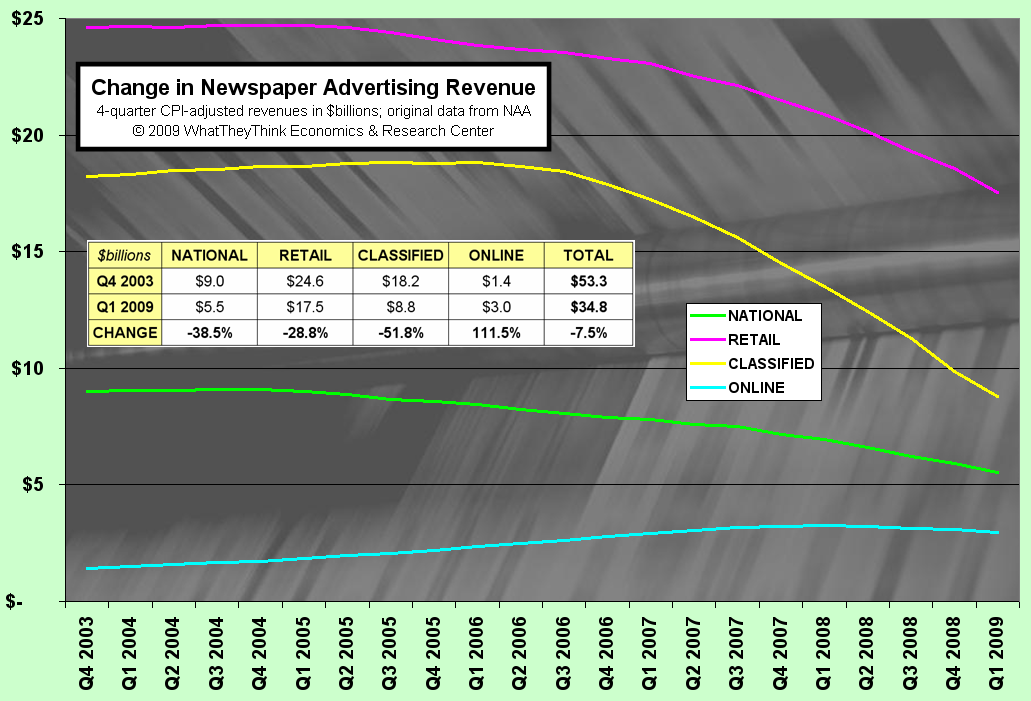
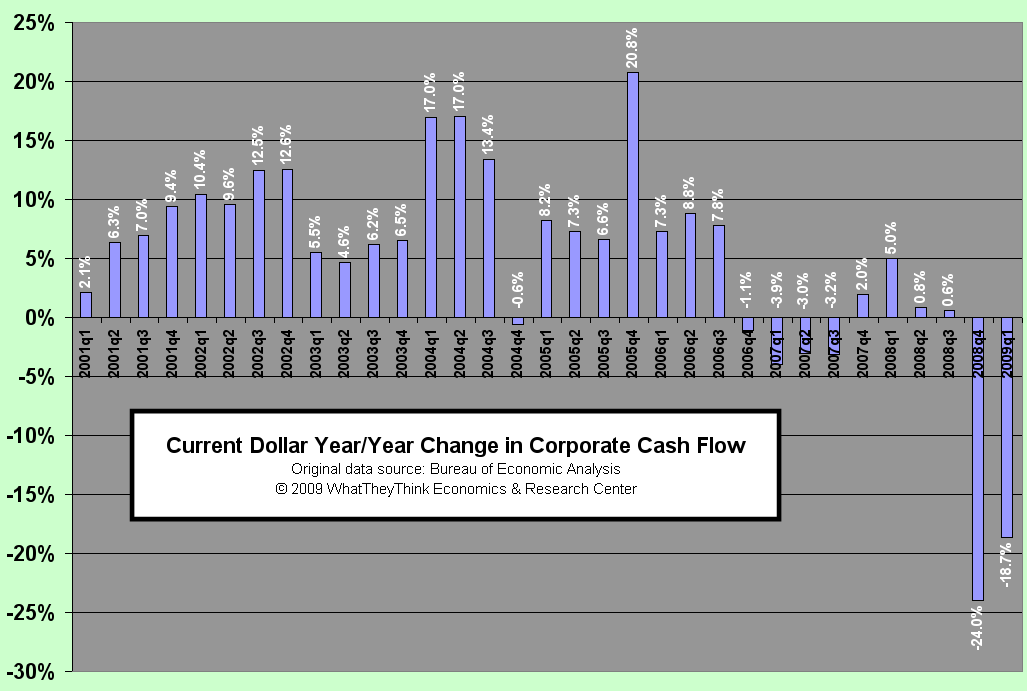
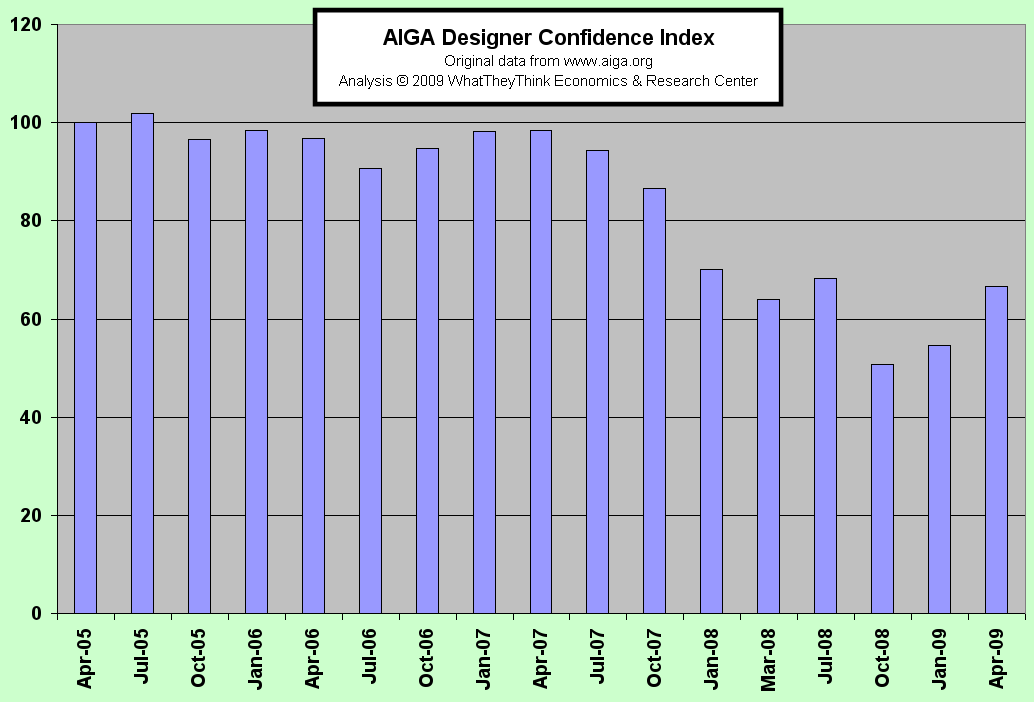
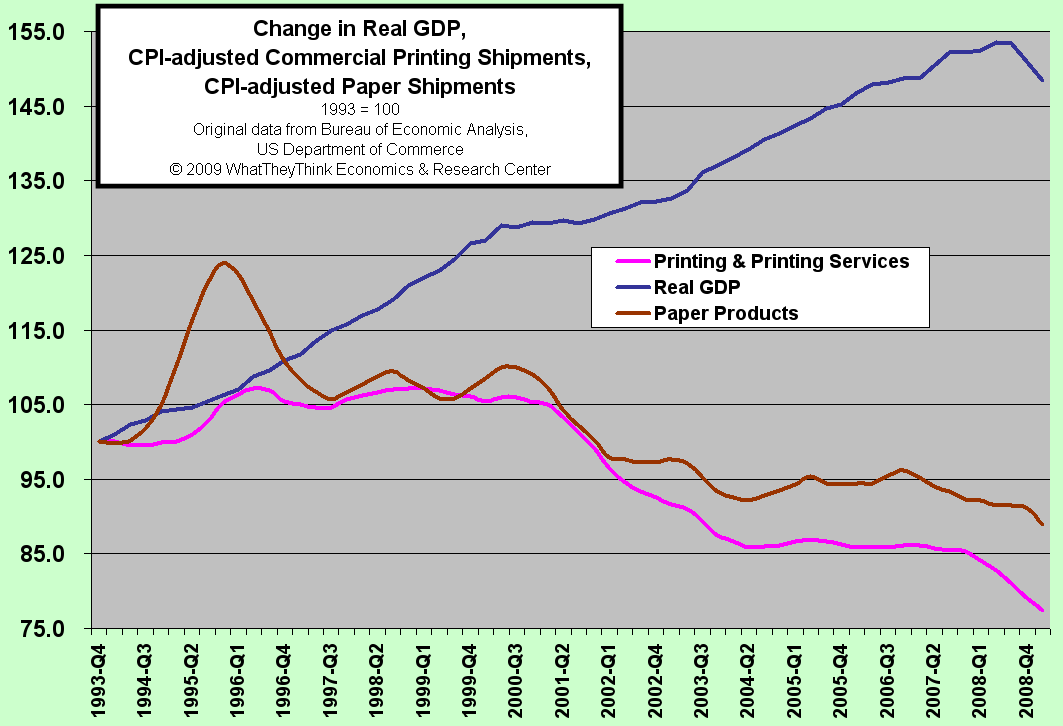
Change in Real GDP, CPI-adjusted Print Shipments & Paper Shipments
Published: June 1, 2009
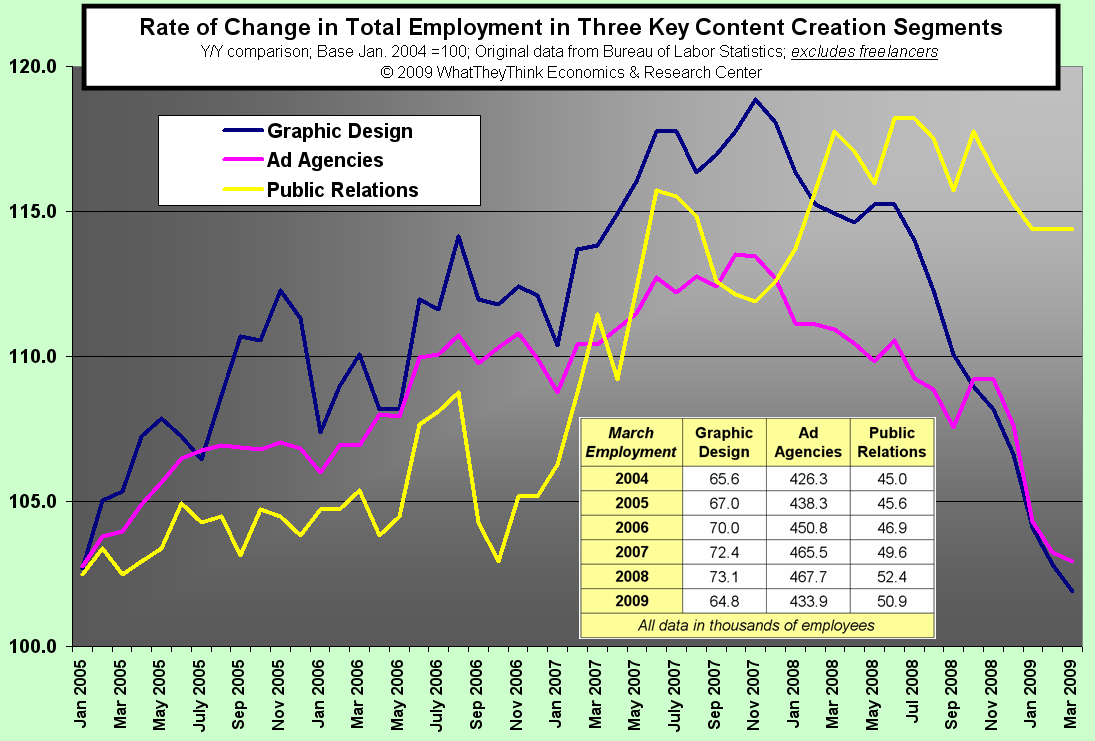
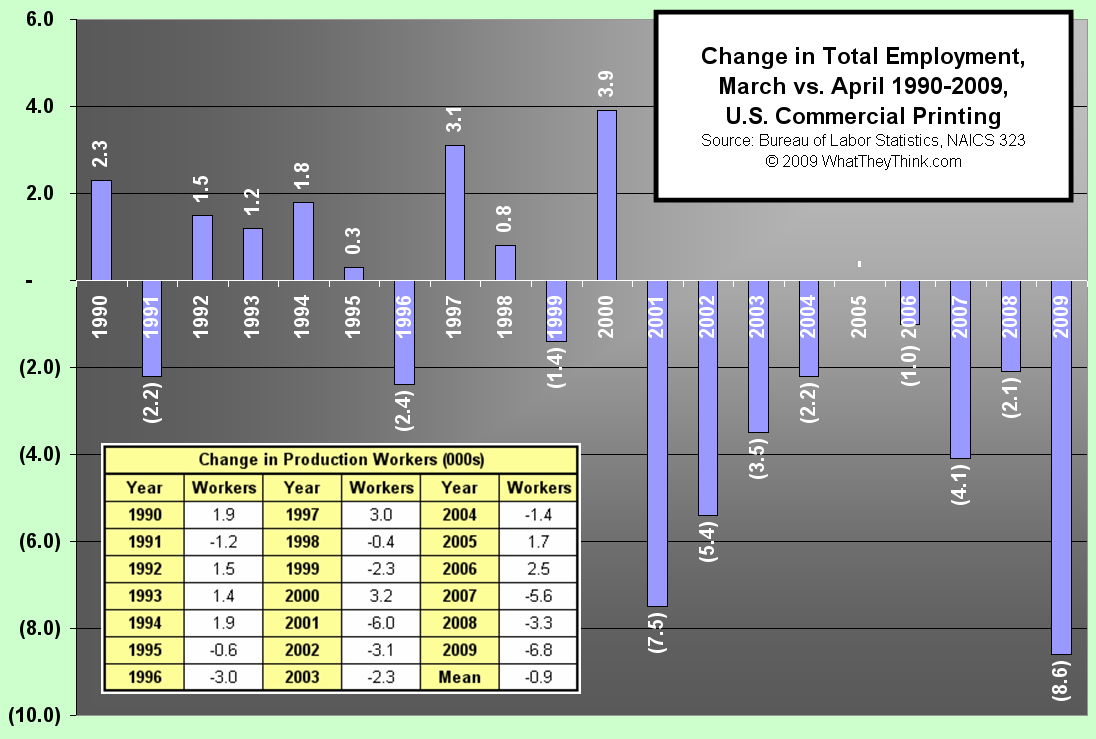
Change in Total Employment, March vs. April 1990-2009, US Commercial Printing
Published: May 18, 2009
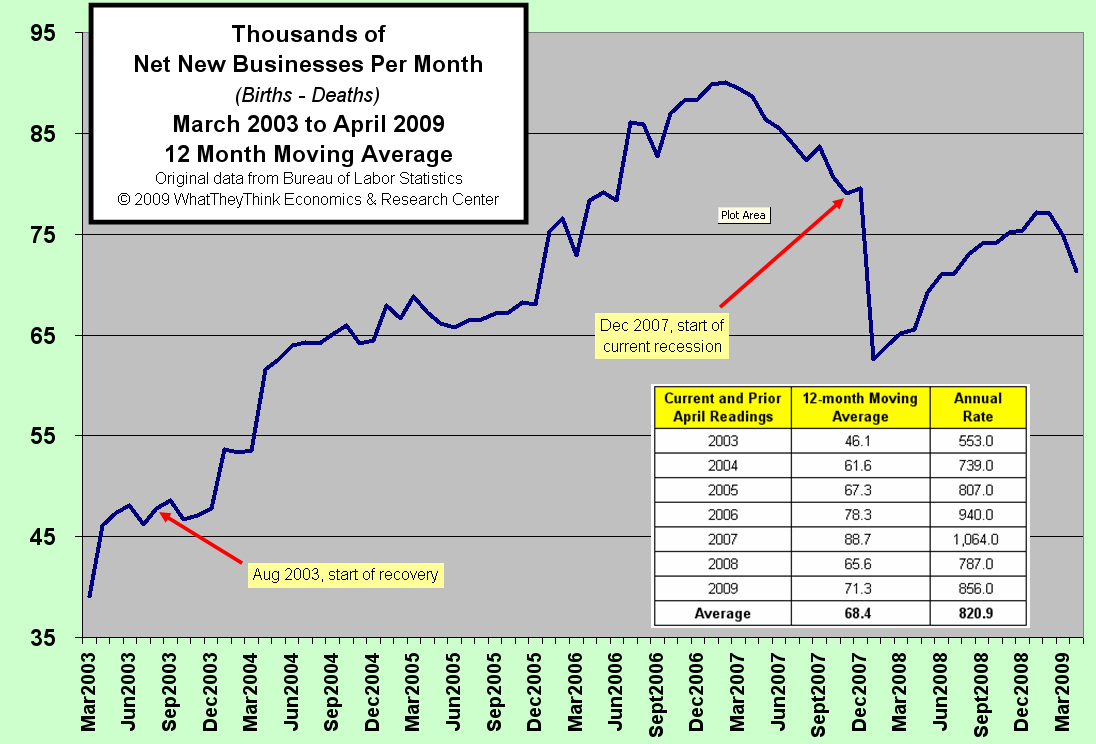
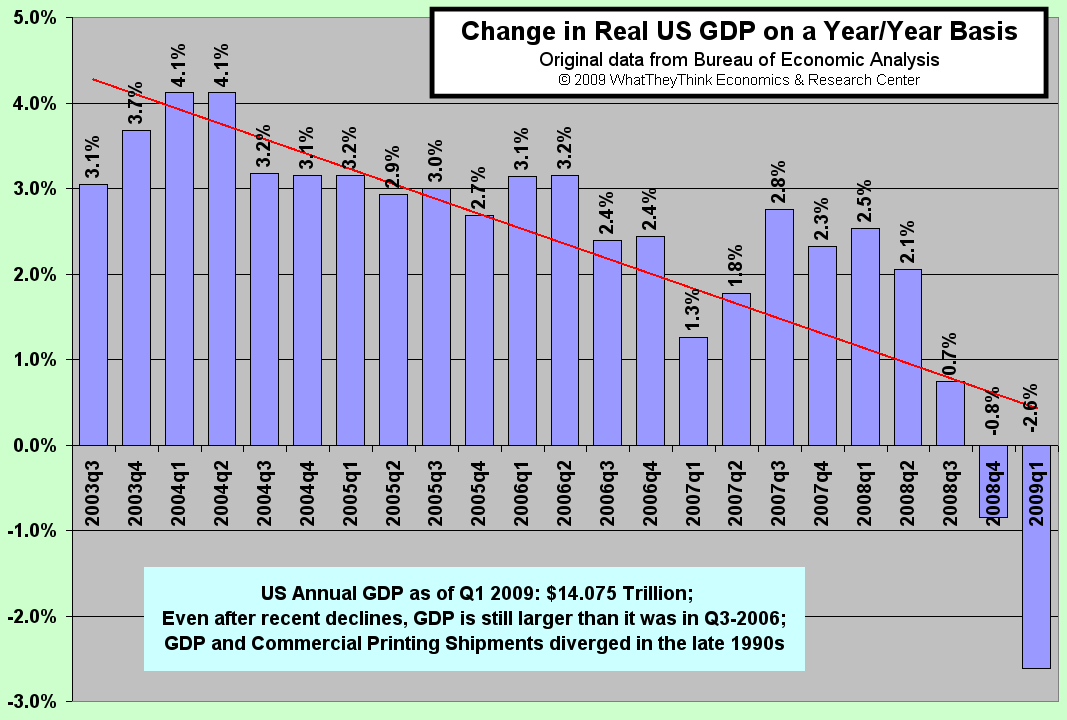
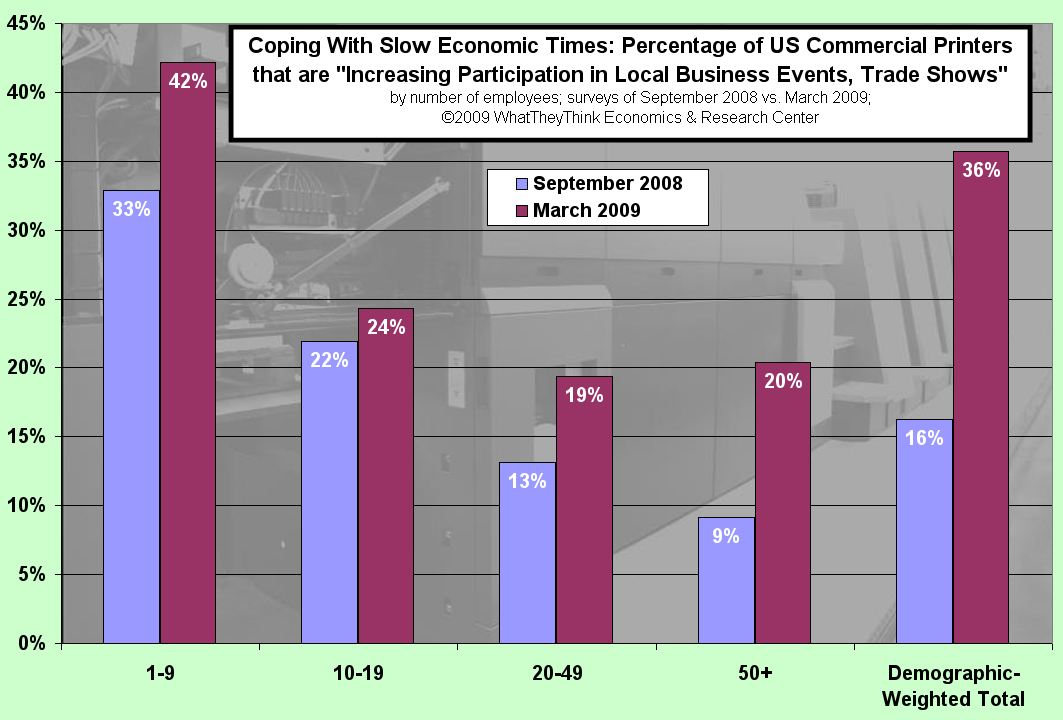
Percentage of Printers Increasing Participation in Local Business Events, Trade Shows
Published: April 27, 2009
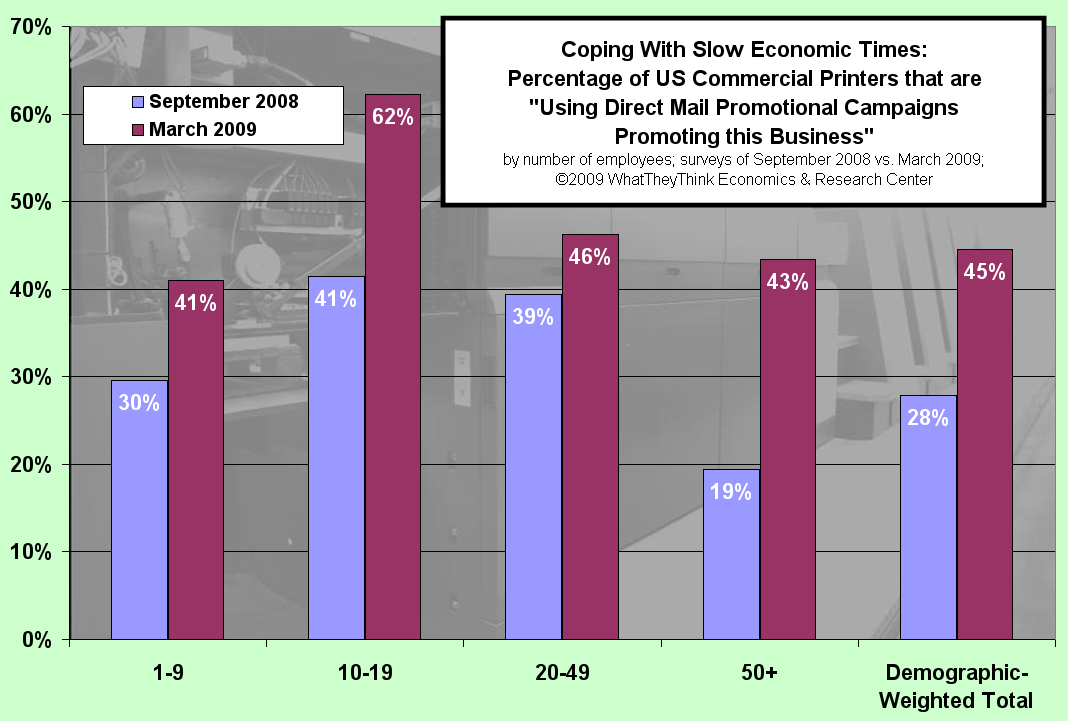
Percentage of Printers Using Direct Mail Promotional Campaigns to Promote Business
Published: April 20, 2009
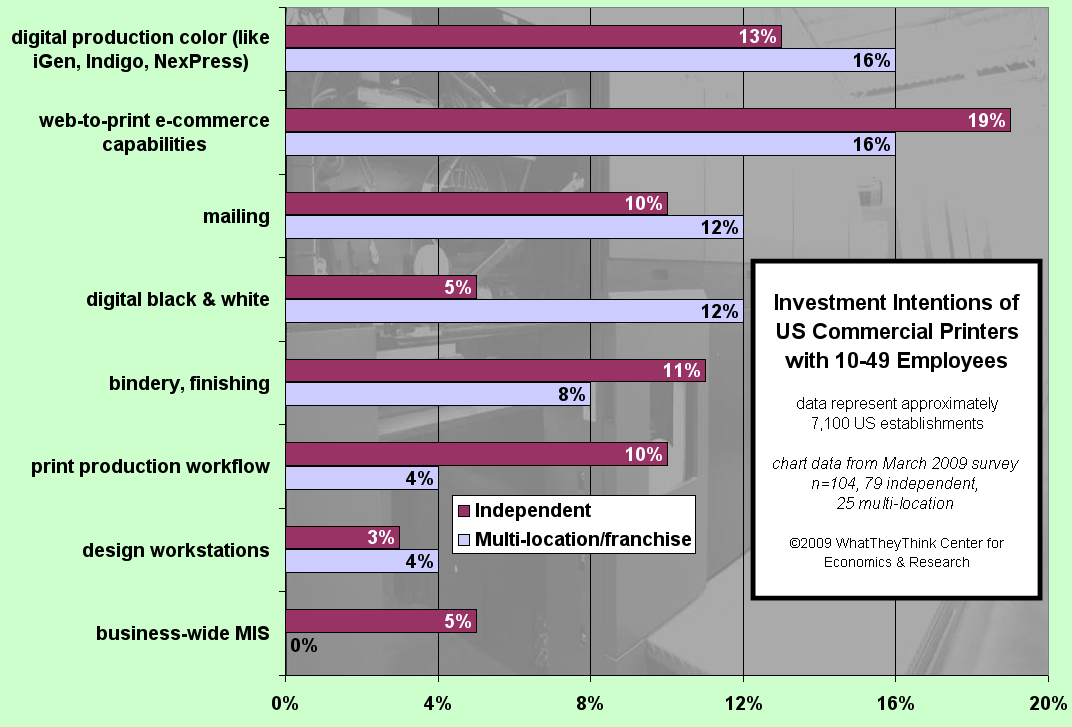
Investment Intentions of Commercial Printers with 10-49 Employees
Published: April 13, 2009
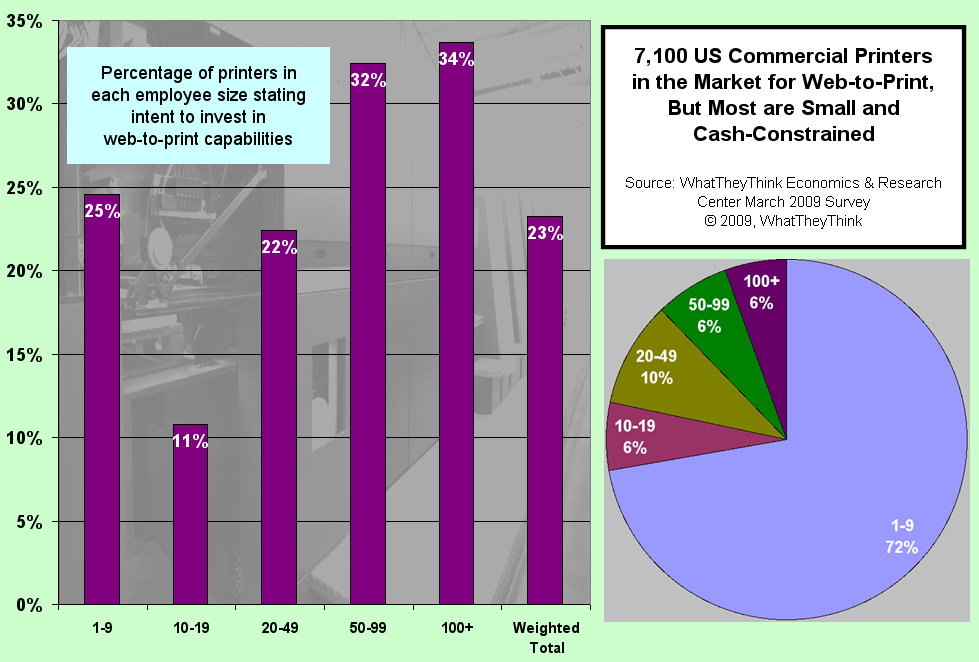
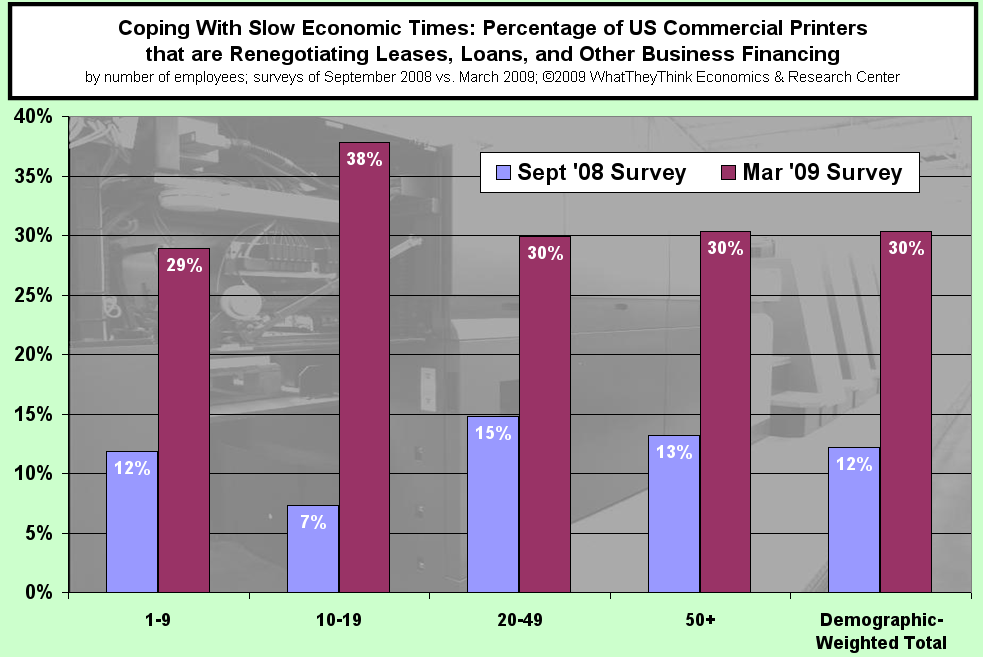
Percentage of US Commercial Printers Renegotiating Leases, Loans and other Financing
Published: March 30, 2009
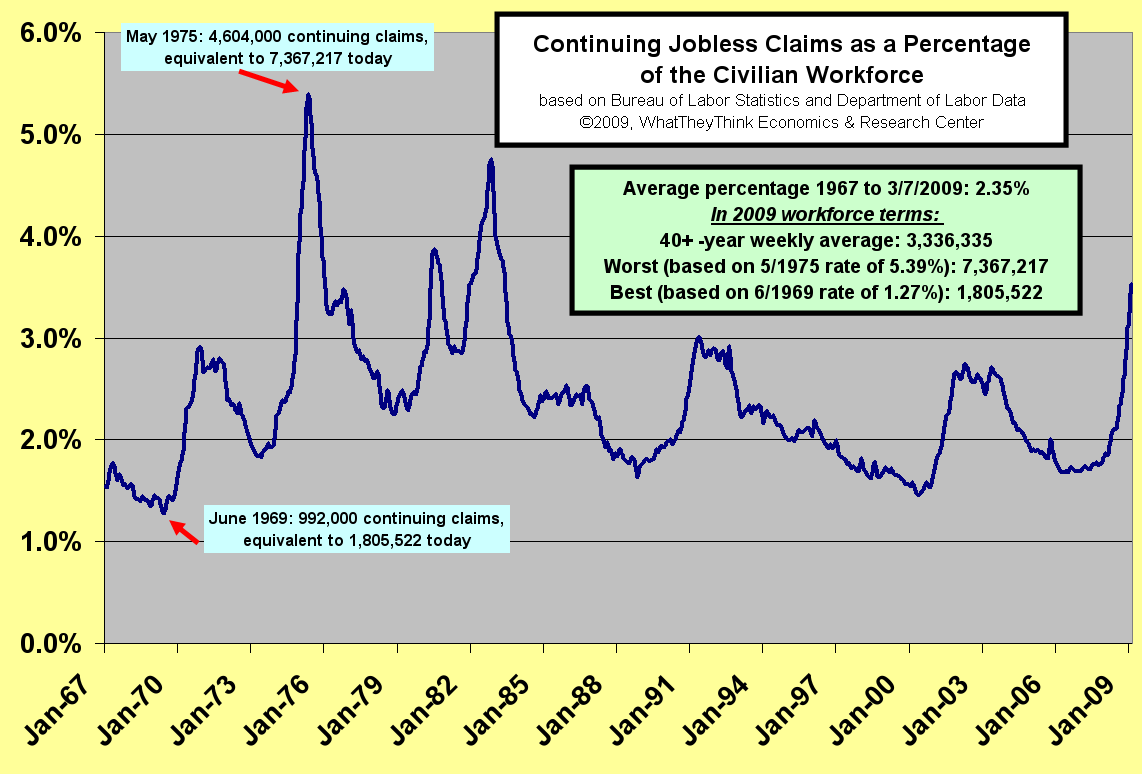
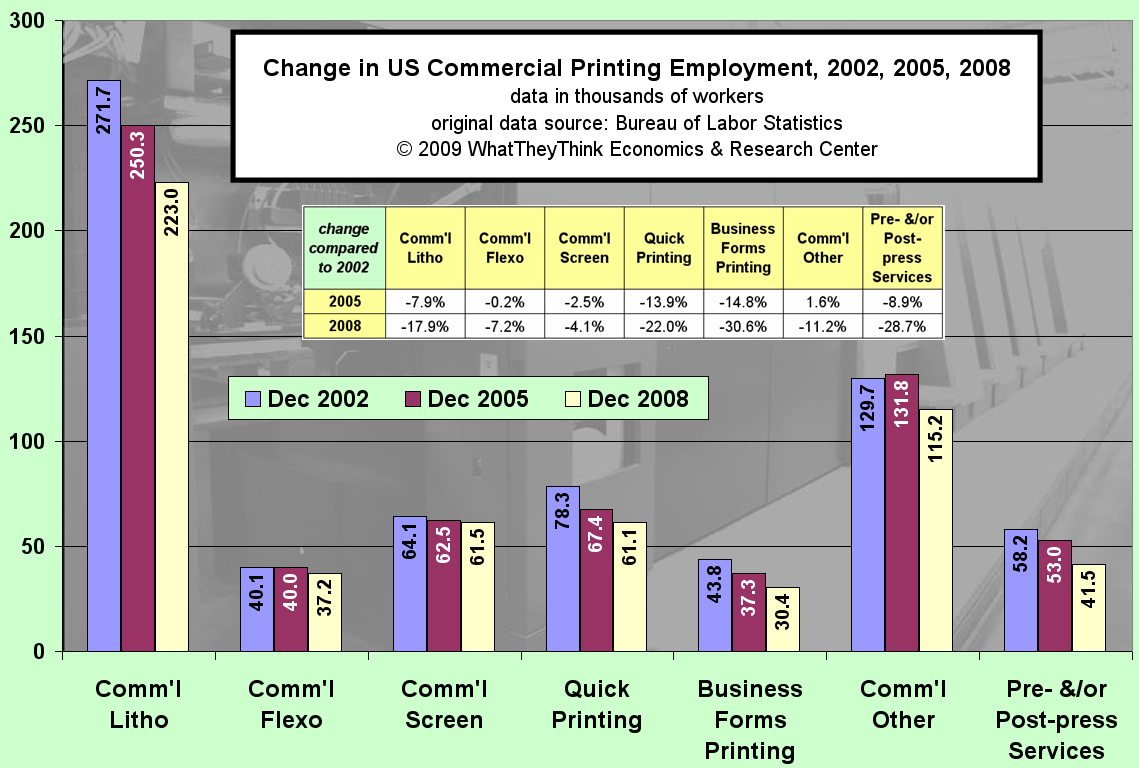
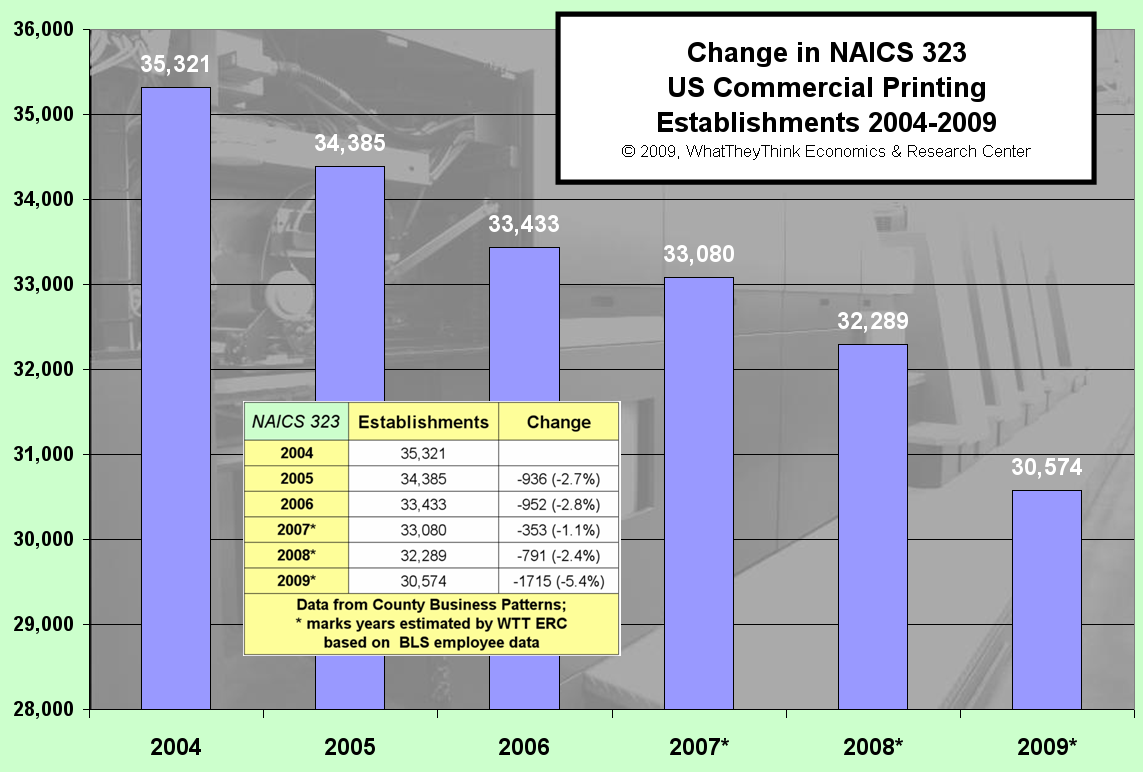
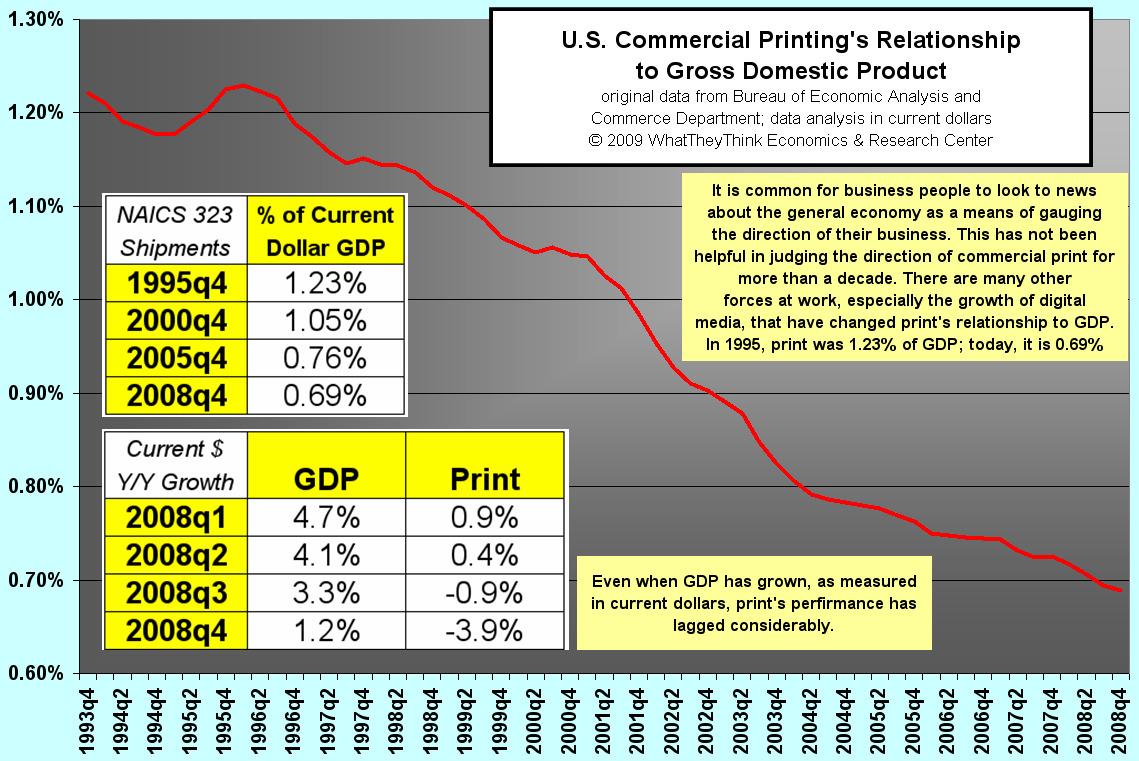
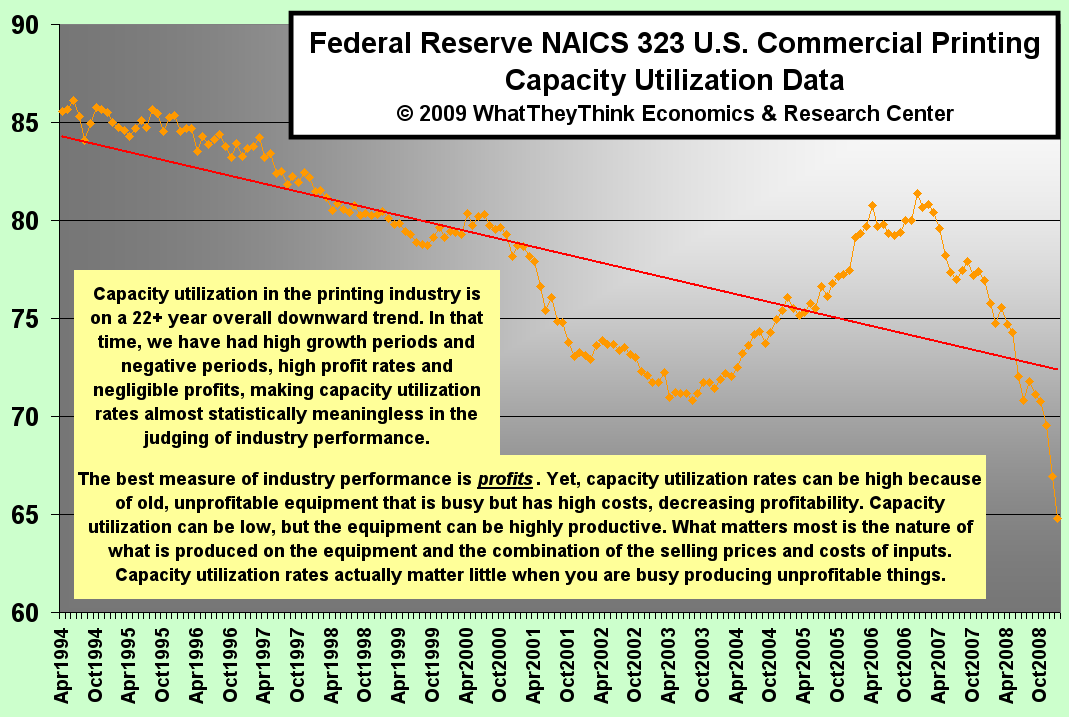
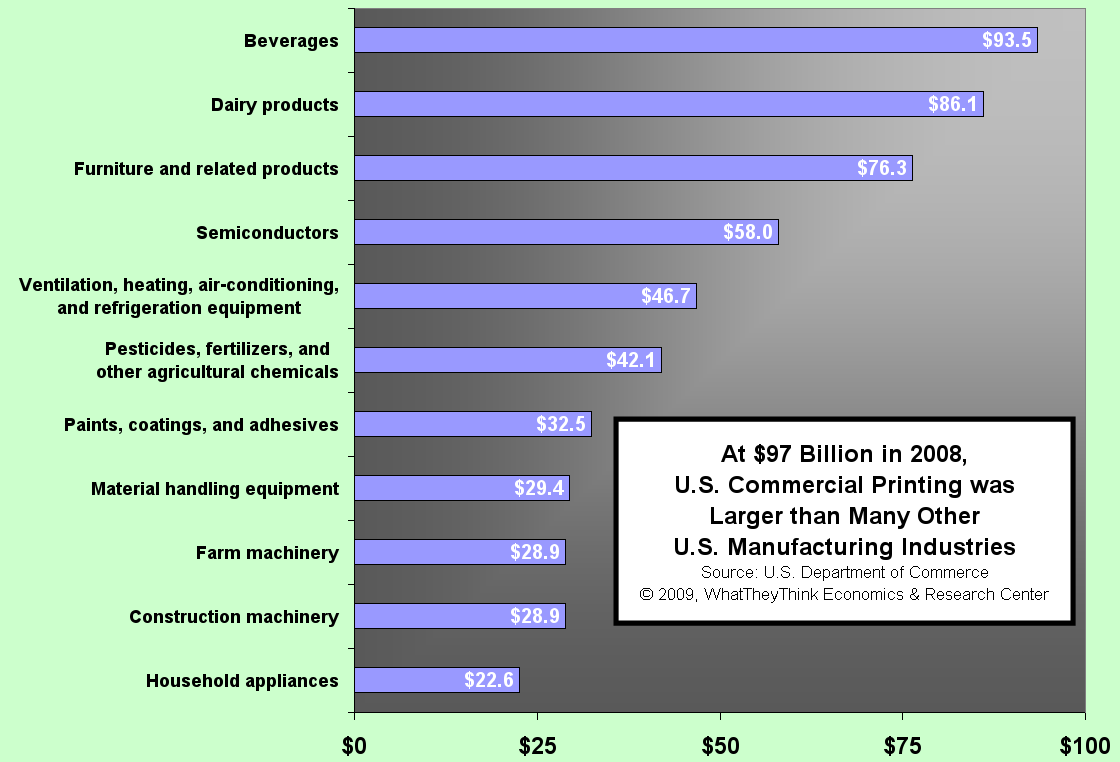
Size of the U.S. Printing Industry Compared to other Industries
Published: February 16, 2009
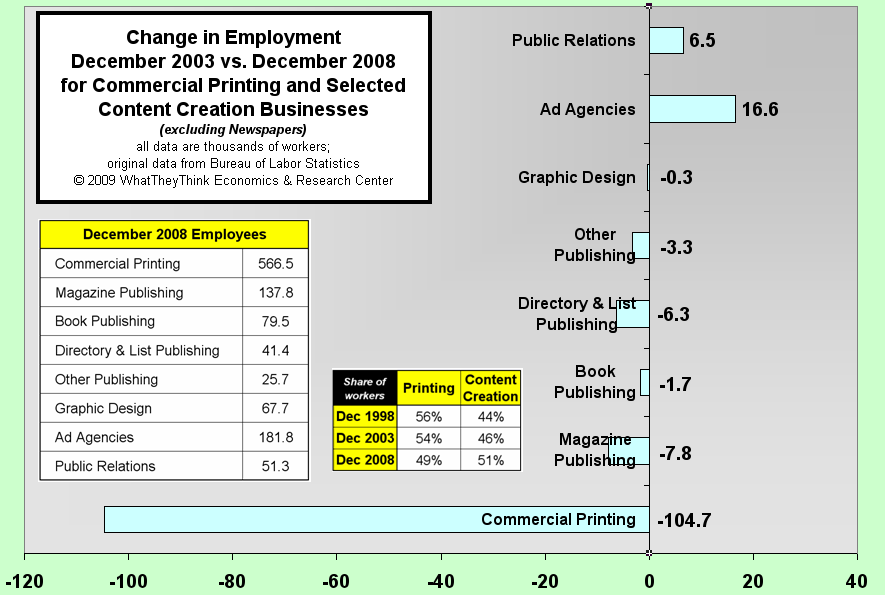
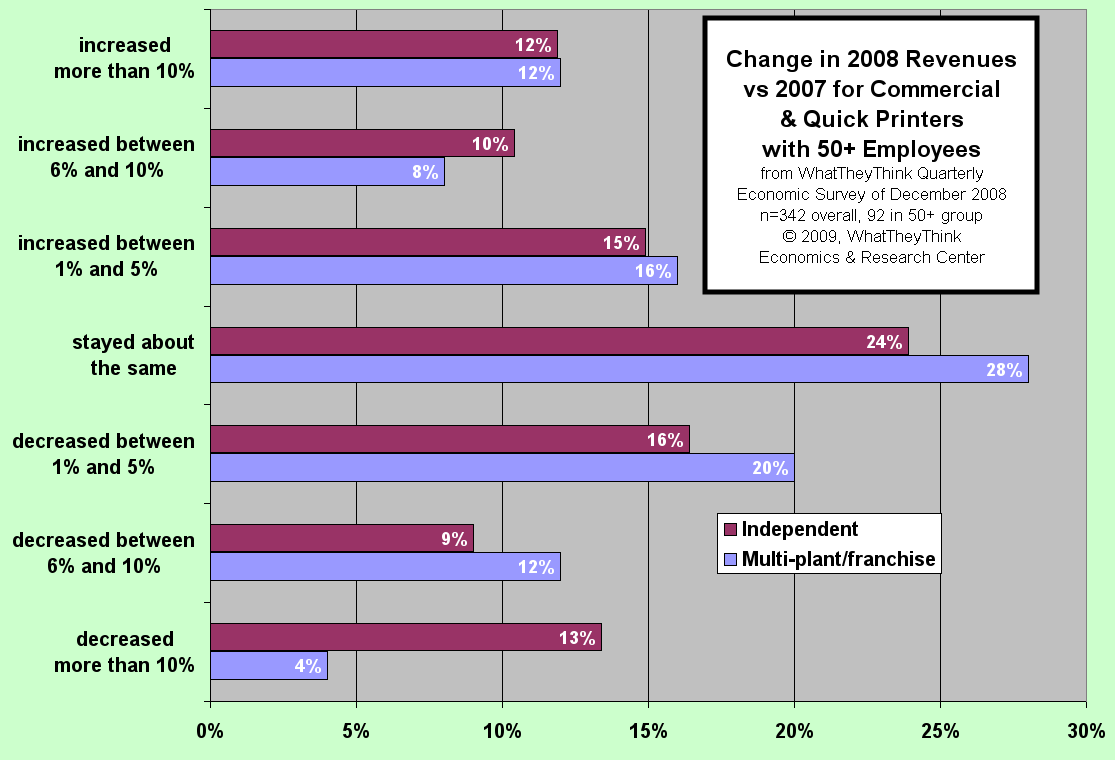
Change in Revenues for Commercial and Quick Printers with 50+ Employees
Published: February 2, 2009
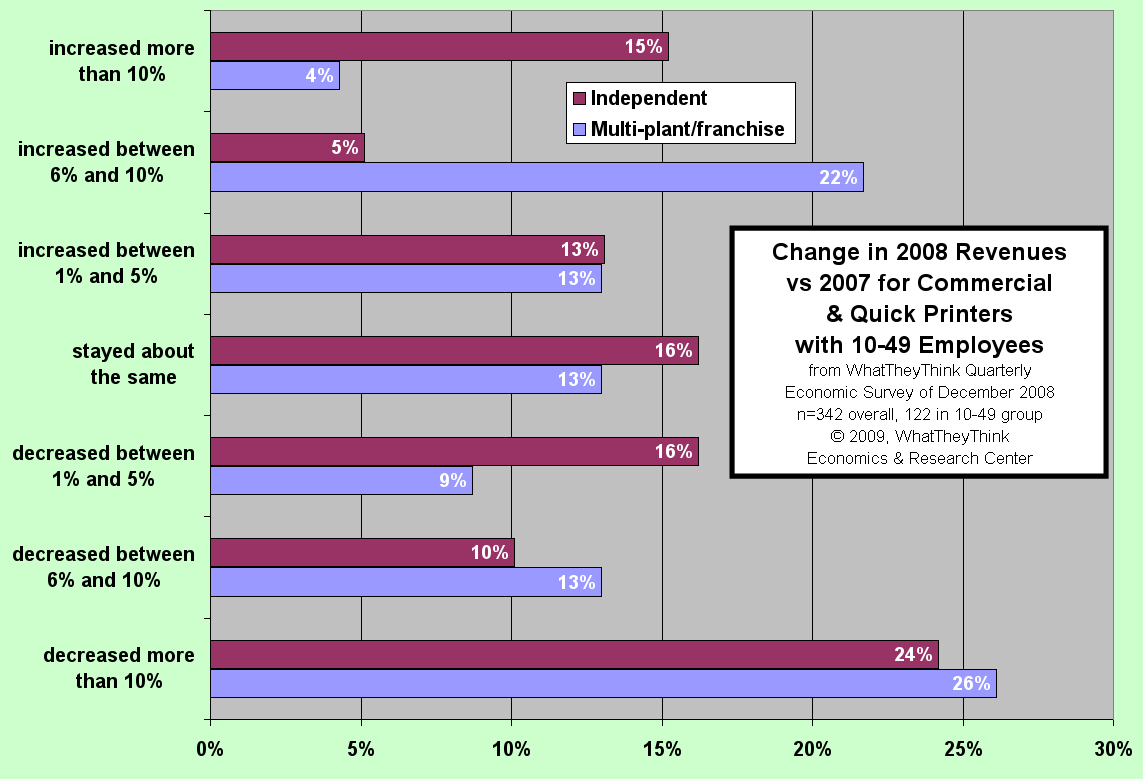
Change in Revenues for Commercial and Quick Printers with 10-49 Employees
Published: January 26, 2009
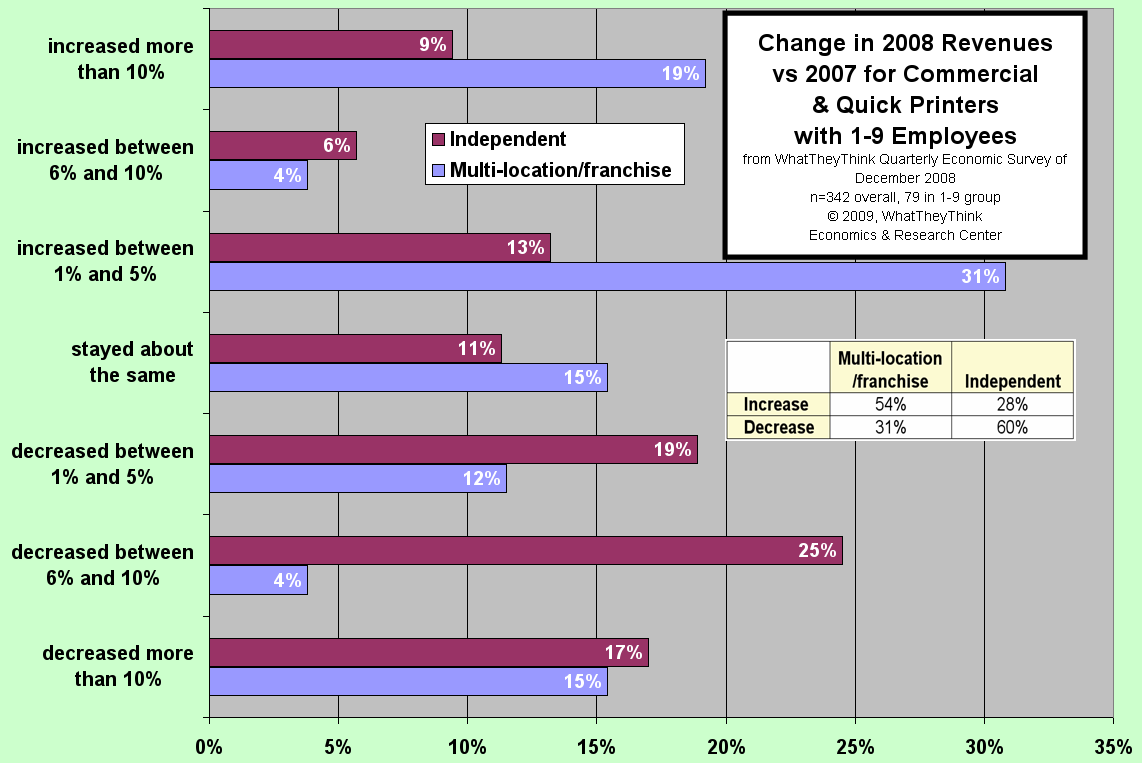
Change in Revenues for Commercial and Quick Printers with 1-9 Employees
Published: January 19, 2009
Change in Revenues for Commercial and Quick Printers with 1-9 Employees Full Analysis
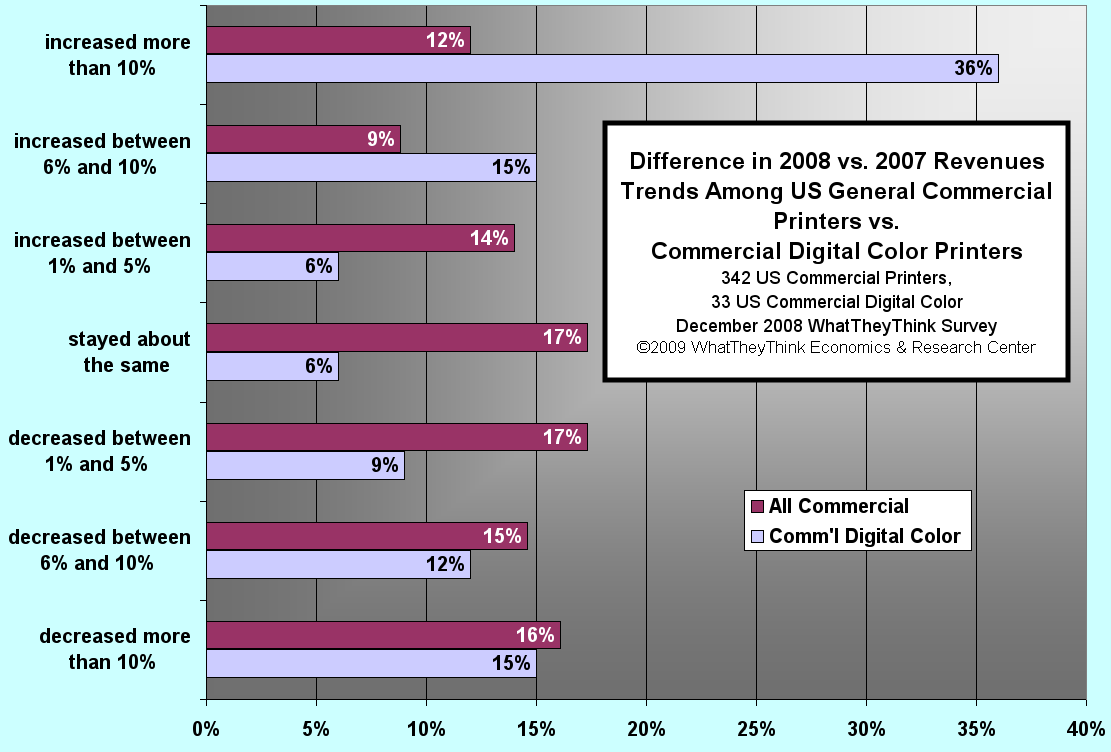
Difference in Revenue Trends Among General Commercial Printers vs. Digital Commercial Printers
Published: January 15, 2009
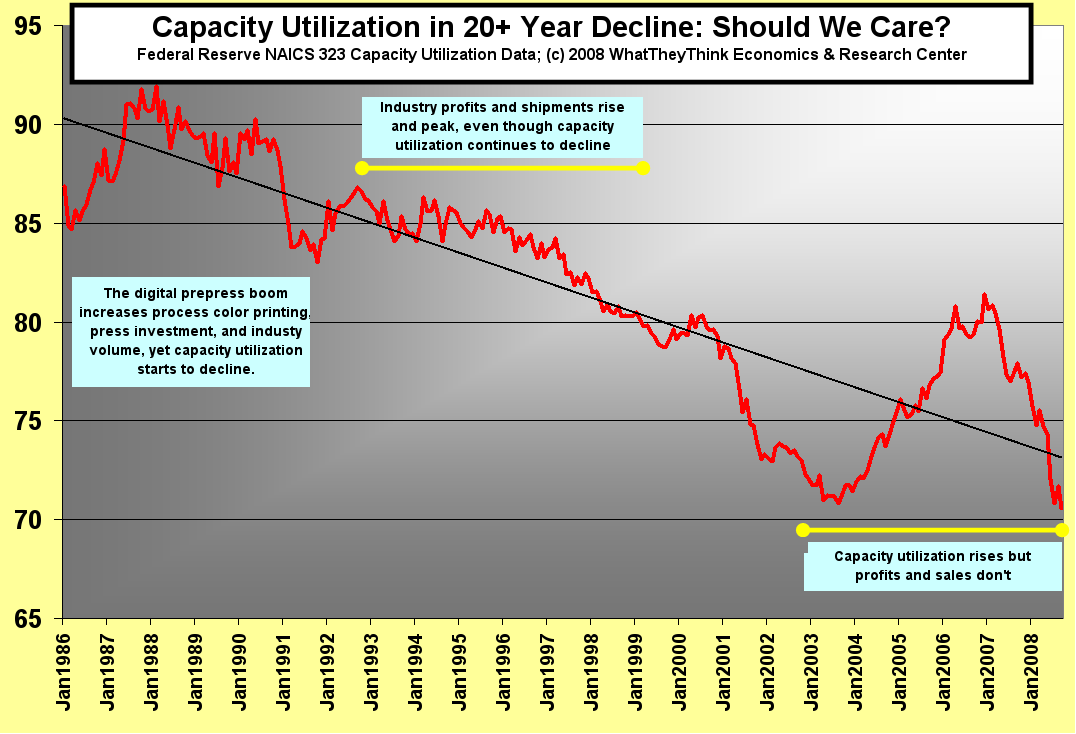
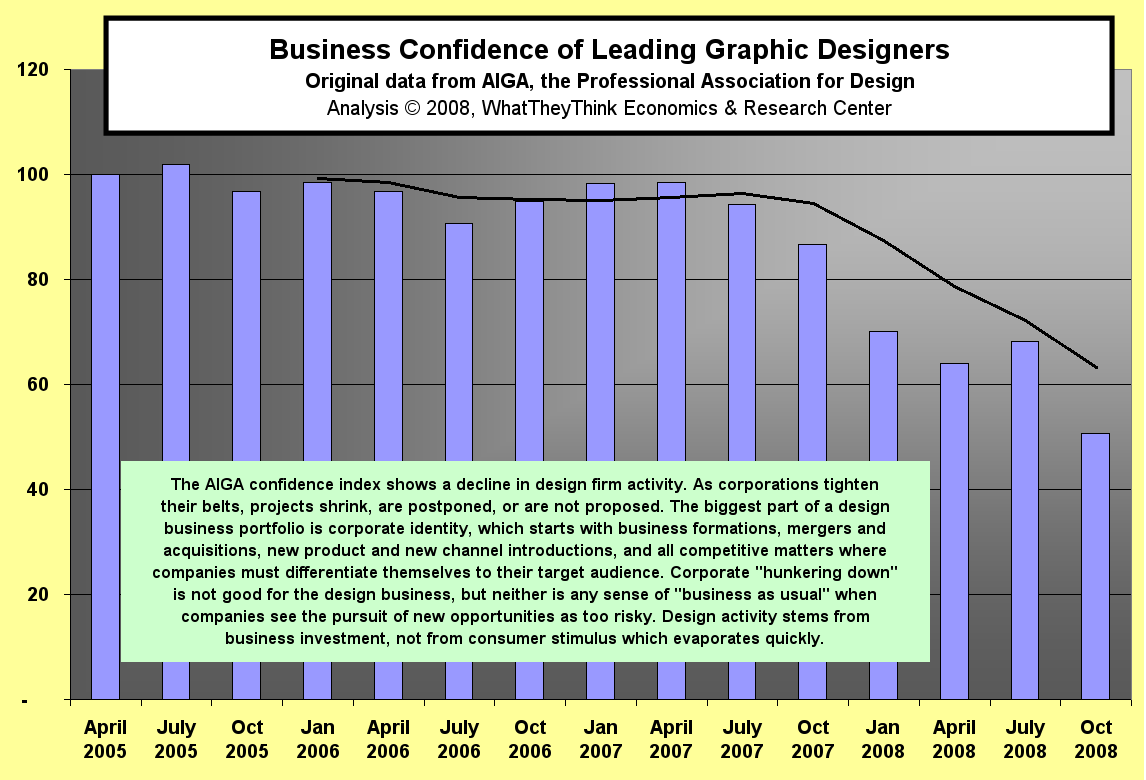
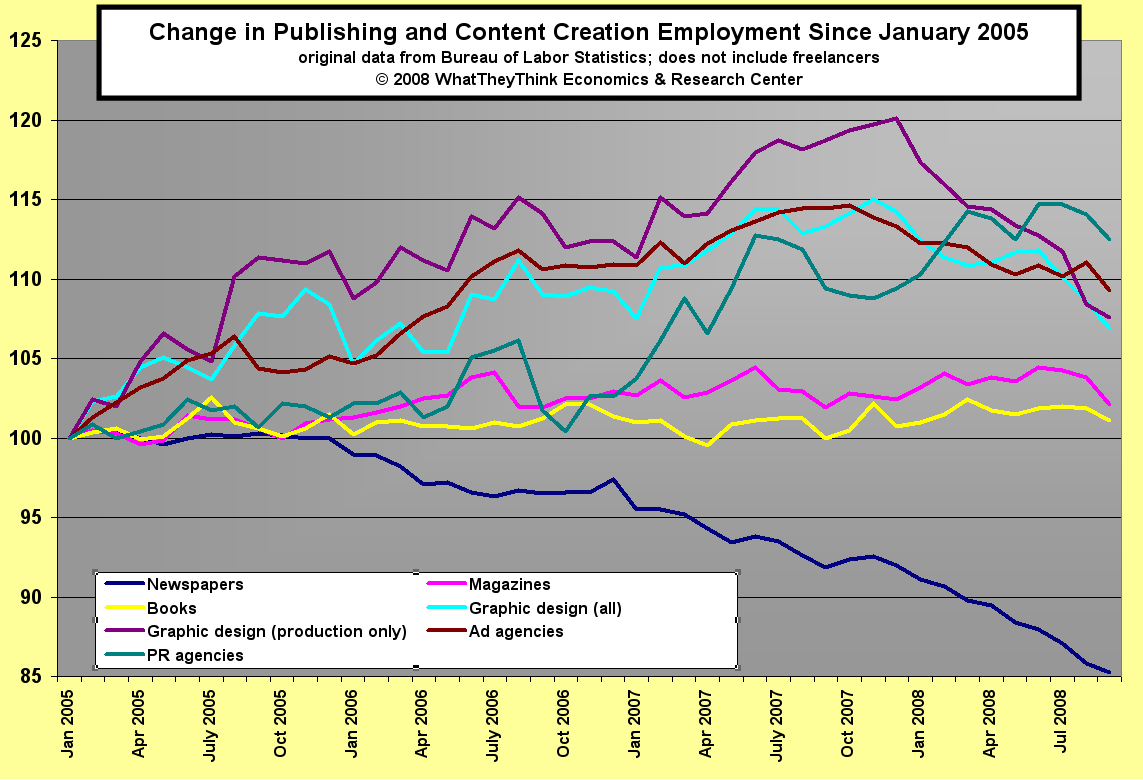
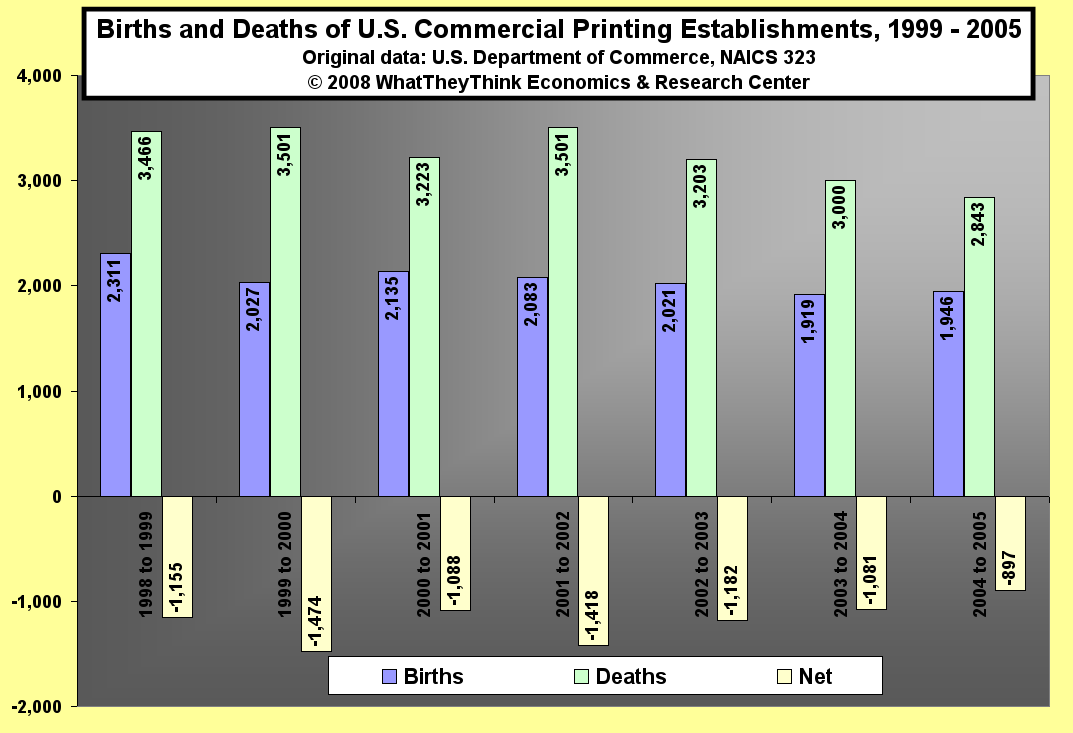
Births and Deaths of U.S. Commercial Printing Establishments
Published: November 24, 2008
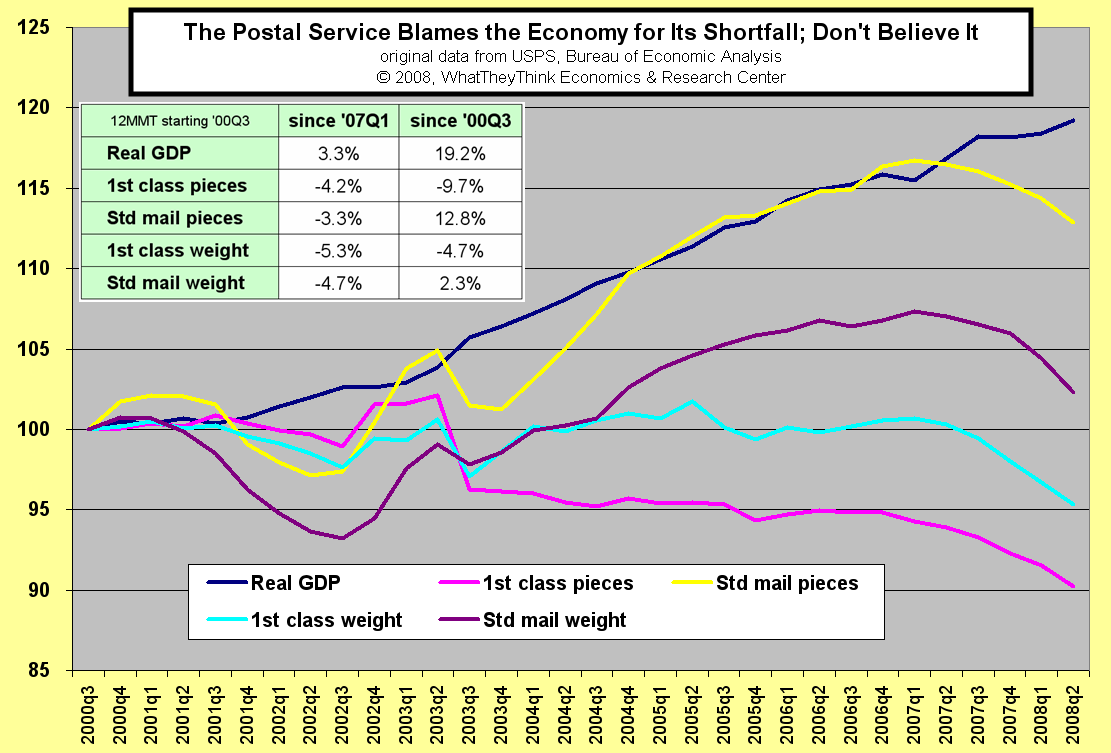
The Postal Service Blames the Economy for Its Shortfall; Don't Believe It
Published: November 17, 2008
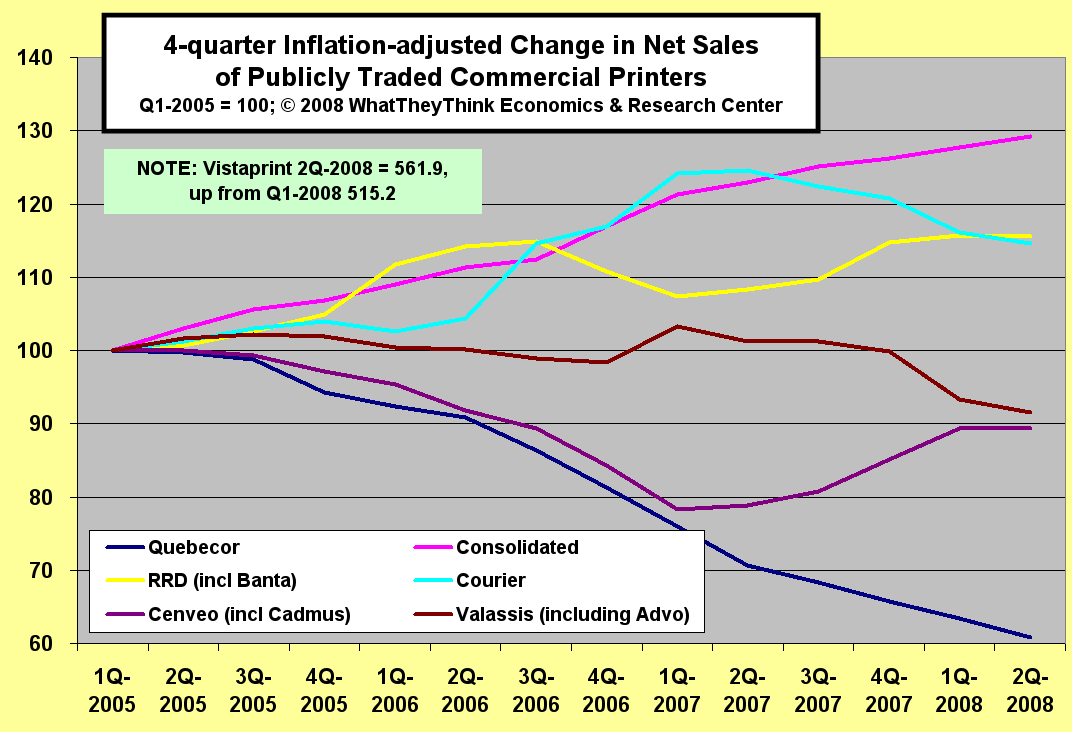
4-quarter Change in Net Sales of Publicly Traded Commercial Printers
Published: November 10, 2008
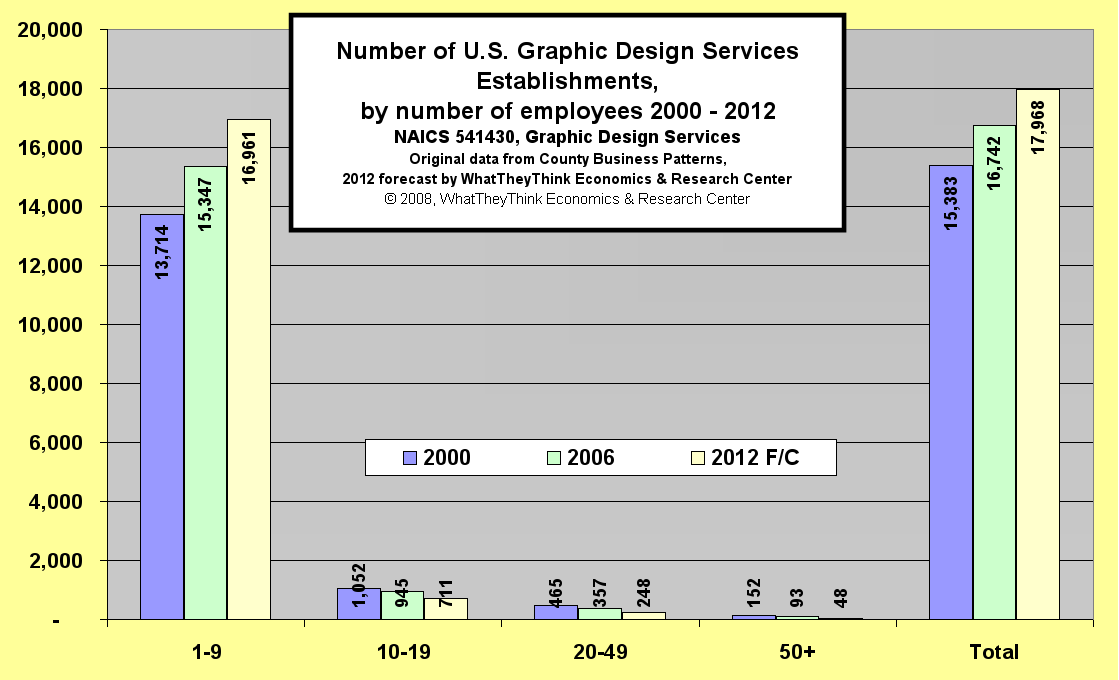
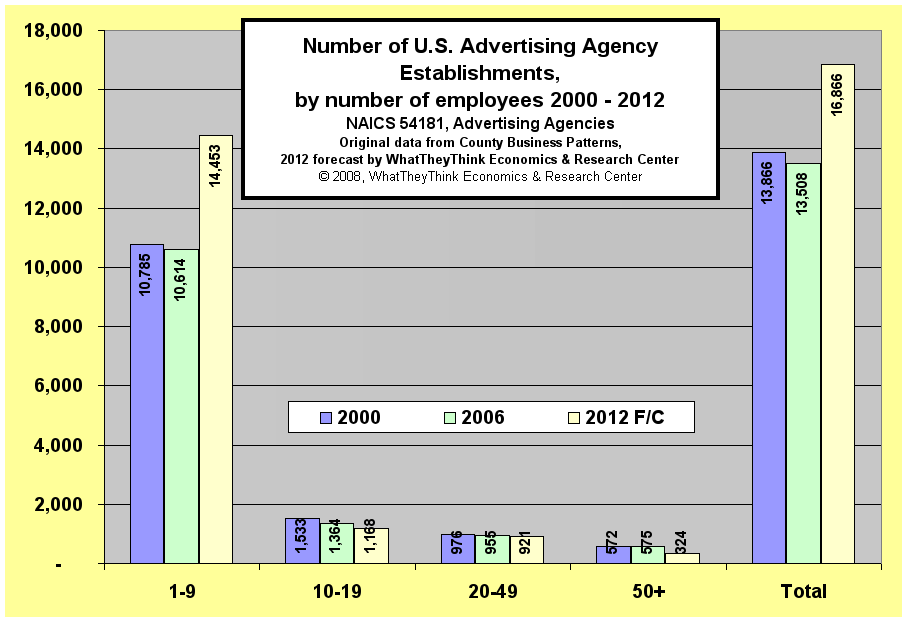
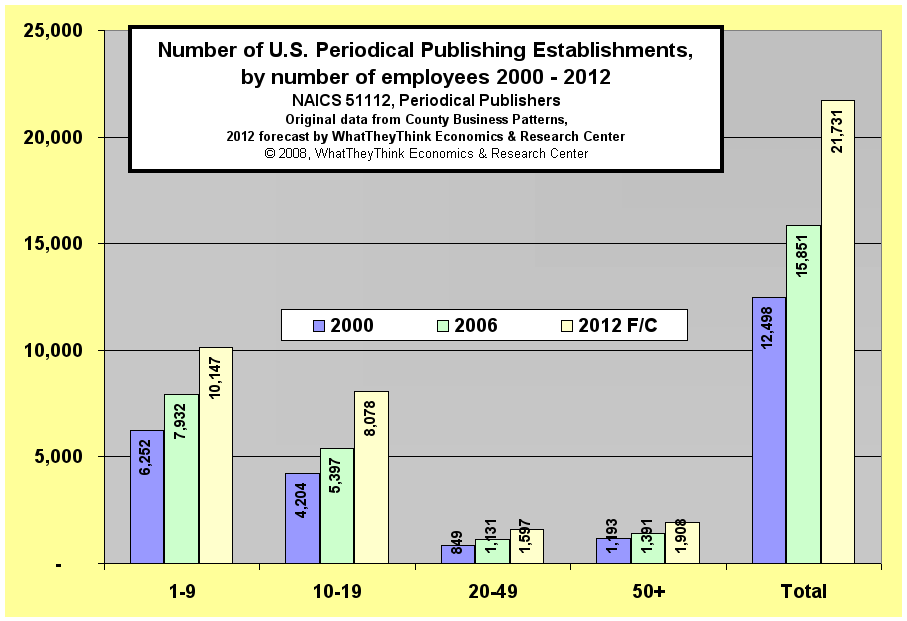
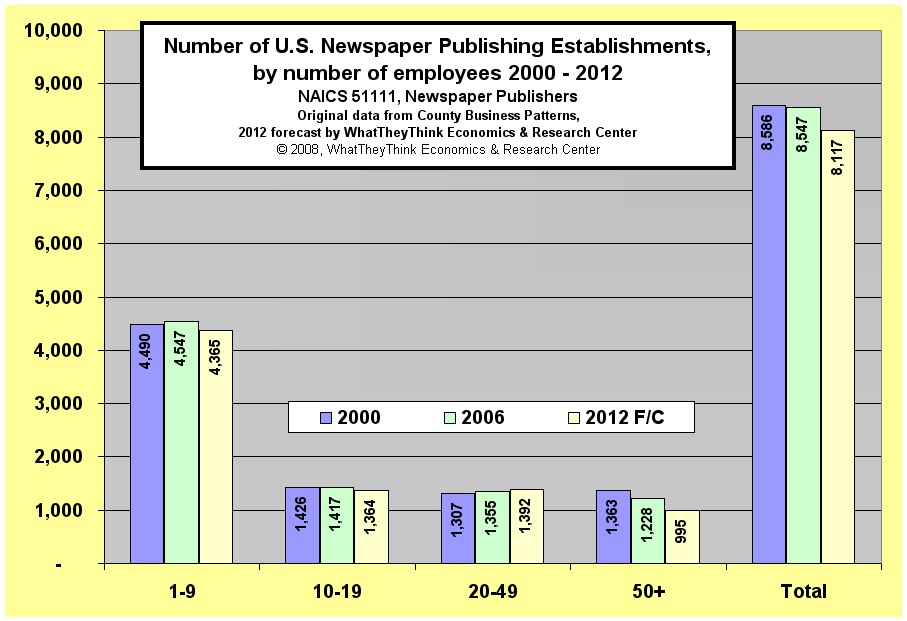
Number of U.S. Newspaper Pulishing Establishments, by number of employees
Published: October 13, 2008
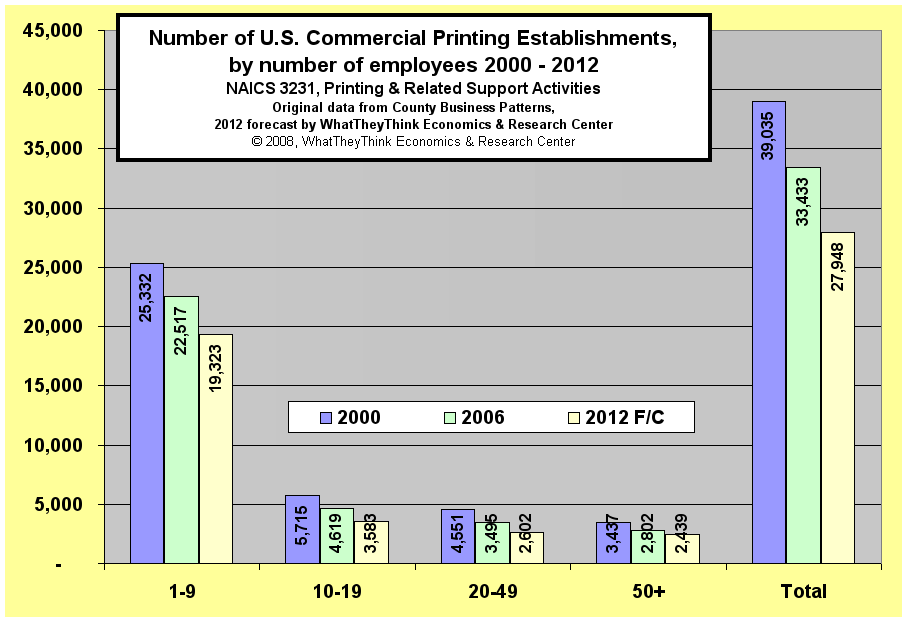
Number of U.S. Commerical Printing Establishments, by number of employees
Published: October 6, 2008

Change in Shipments per U.S. Commerical Printing Employee, 1994-2008
Published: September 29, 2008
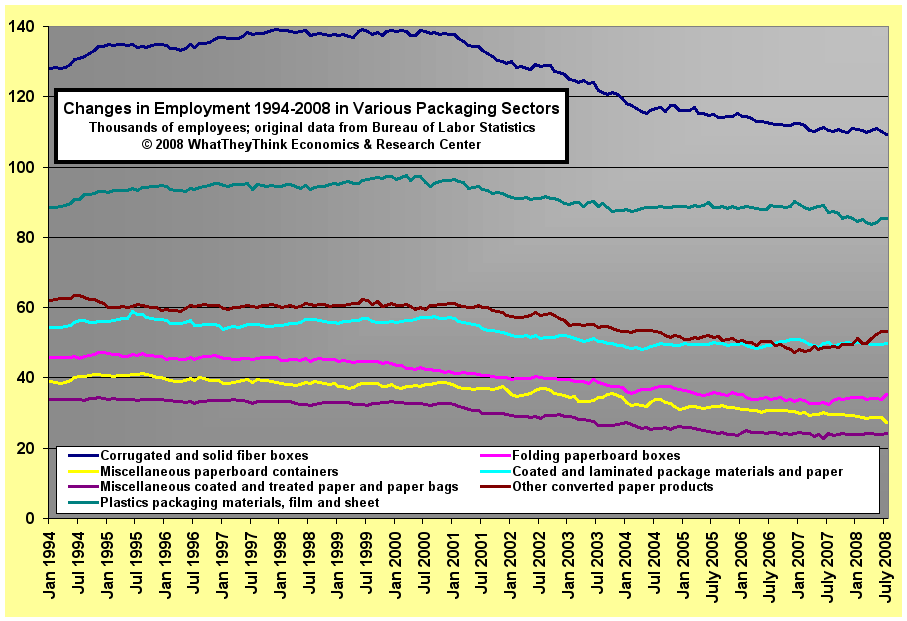
Changes in Employment 1994-2008 in Various Packaging Sectors
Published: September 22, 2008
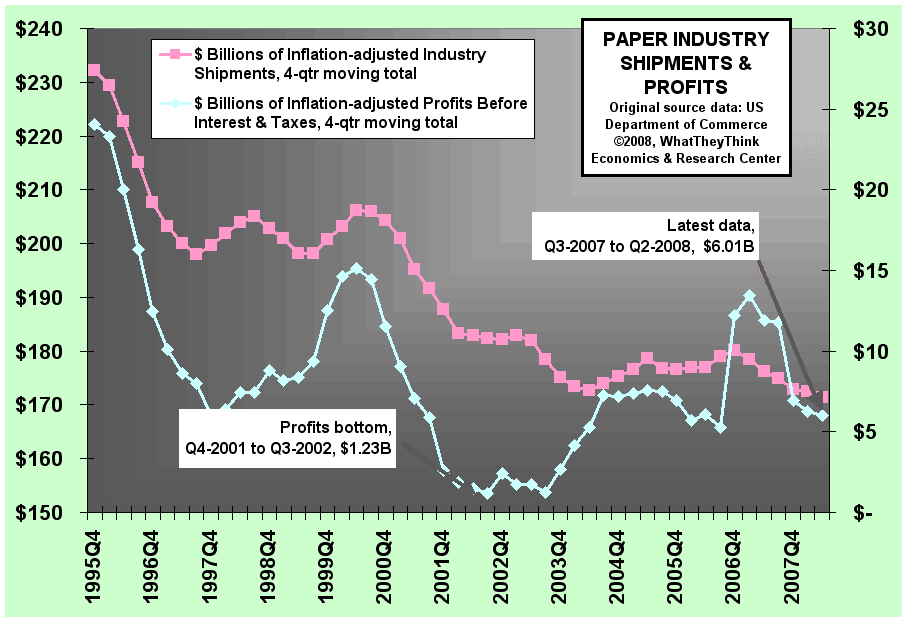
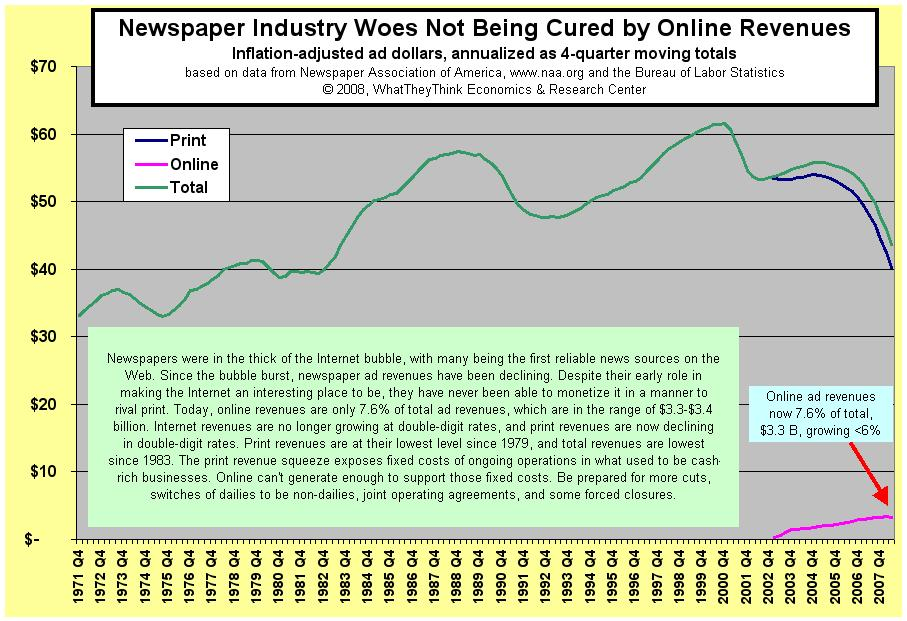
Newspaper Industry Woes Not Being Cured by Online Revenues
Published: September 8, 2008
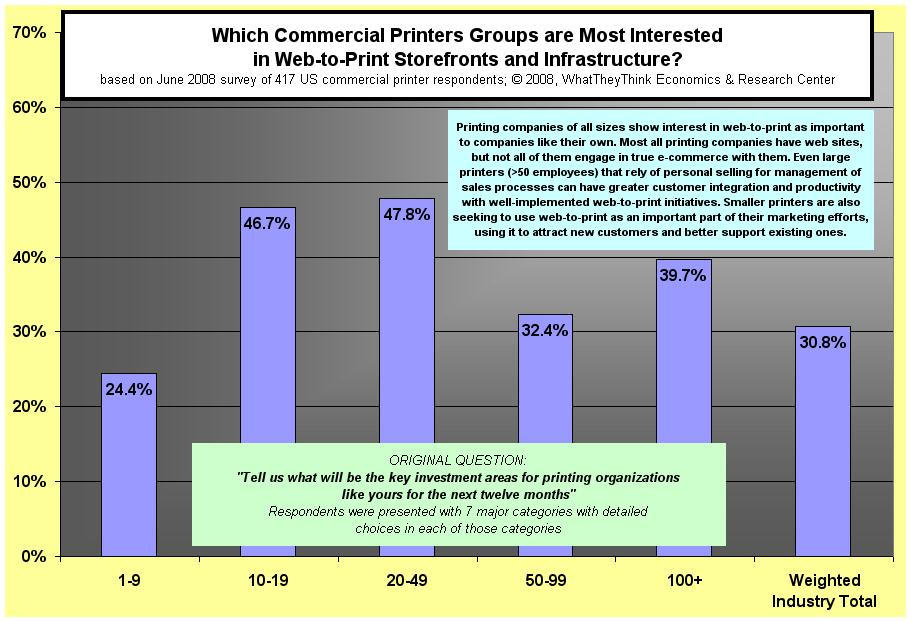
Which Commerical Printers Groups are Most Interested in Web-to-Print Storefronts and Infrastructure
Published: September 1, 2008
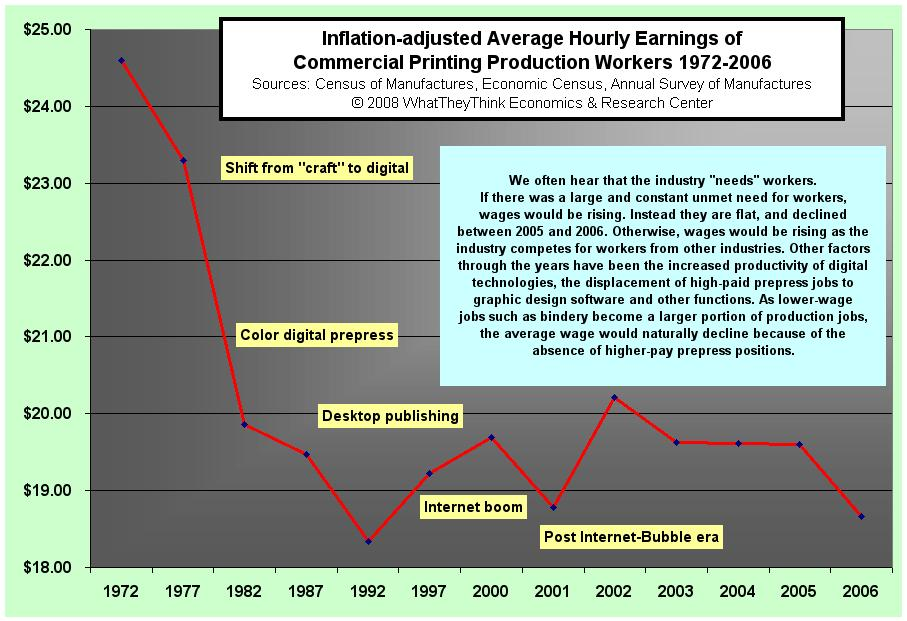
Average Hourly Earnings of Commerical Printing Production Workers
Published: August 25, 2008
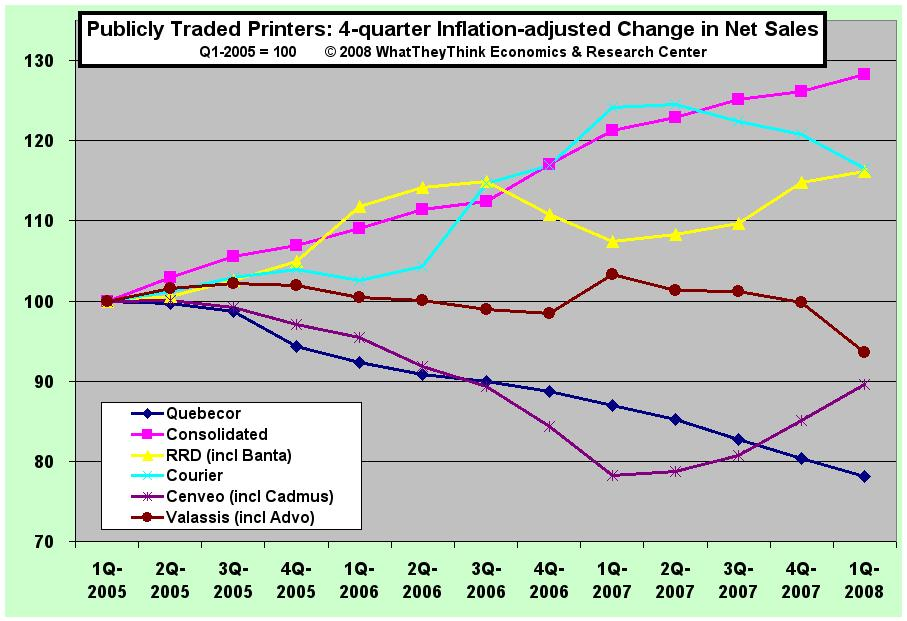
Publicly Traded Printers: 4-quarter Inflation-adjusted Change in Net Sales
Published: August 18, 2008
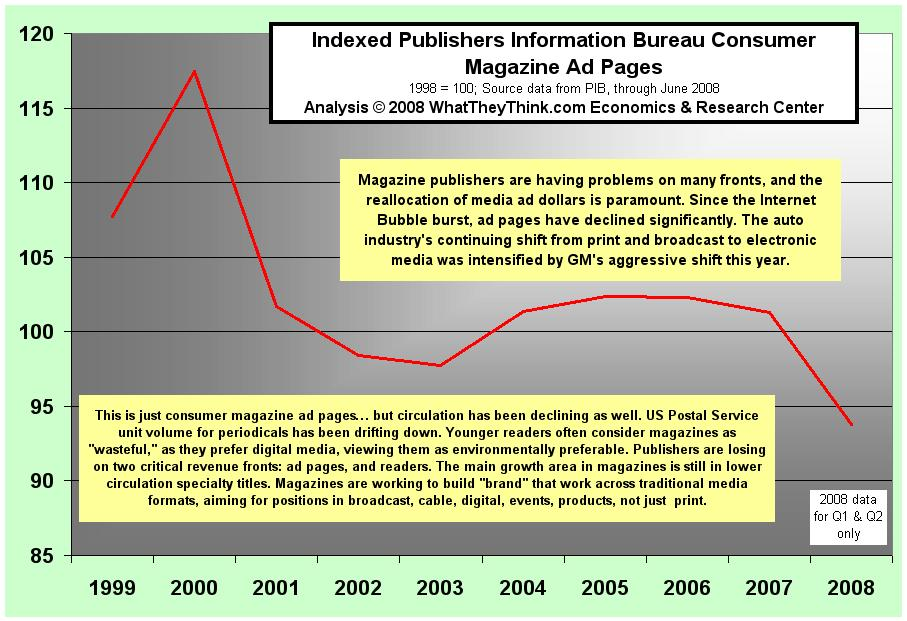
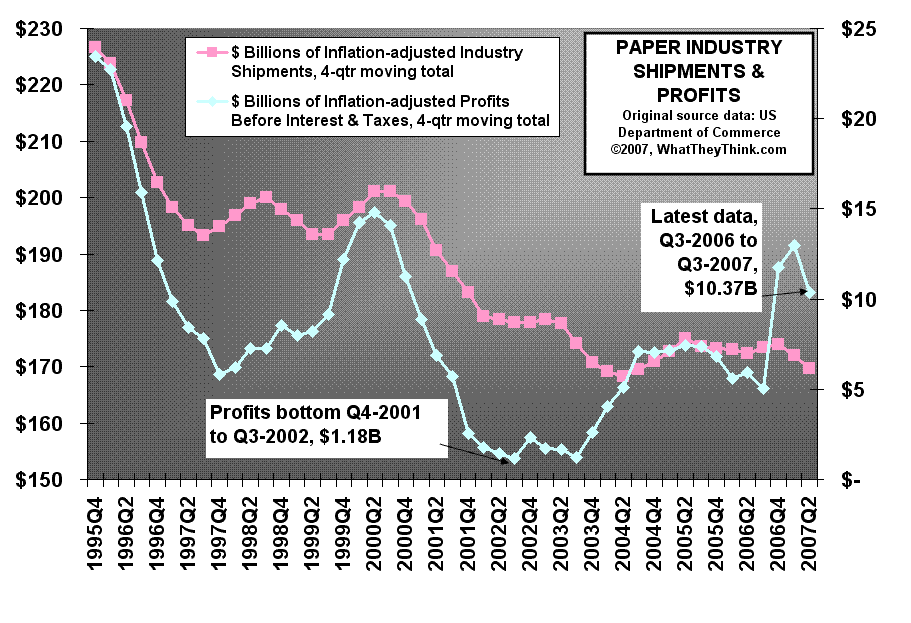
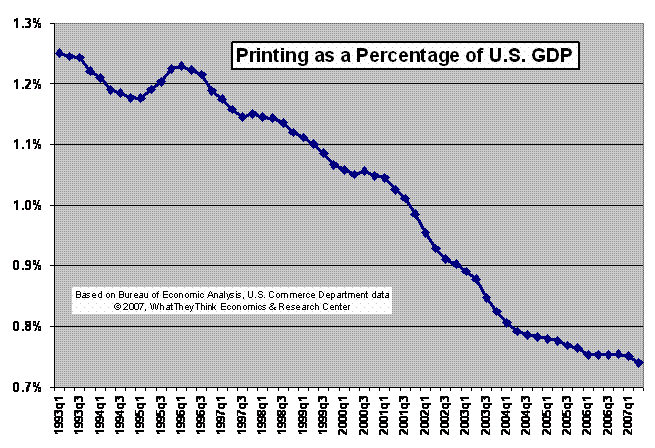


![]()
- June 2024 Inkjet Installation Roundup
- Inkjet for corrugated and more: HP launches the T700i
- Printheads and inkjet integration programs from Xaar
- 2024 Inkjet Integrator Profiles: C-marx
- Finding the coolest of the cool at drupa
- Inkjet printheads and the evolution of print quality
- Koenig & Bauer developing inkjet for metal
- Carbon Black and Inkjet – Part 3: Options

WhatTheyThink is the official show daily media partner of drupa 2024. drupa Event Coverage | drupa daily programs
© 2024 WhatTheyThink. All Rights Reserved.