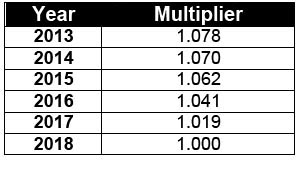
Every January, we provide the latest inflation-adjustment multipliers so that print business owners can get a real sense of how they are performing year-over year. It’s easy to think that a dollar is a dollar is a dollar, but what a dollar bought in 1950 is a lot different than what a dollar will buy in 2019. Money was a lot of money in the past!
This chart is based on the Consumer Price Index (CPI), calculated for the December comparison to the prior year. The CPI is the dollars in your pocket that you and your fellow employees spend in the marketplace. Unfortunately, commercial printing prices have not kept up with inflation, but the costs of running a printing business usually have. This means that it’s harder to keep earnings and payrolls up to this level. If past dollars had greater value, this chart can be used to adjust past financial statements to bring those data to current value. This is especially important in budgeting processes where looking for trends in prior years is one way of assessing performance and goals.
Special Note on the Government Shutdown: Some government data series that WhatTheyThink tracks are not being updated or their release is being delayed. Specifically, monthly printing shipments and quarterly profits and revenues data are not being updated. We will have the latest data once publication resumes...whenever that may be. In other data housekeeping, the annual County Business Patterns, which is usually updated in April, has been delayed until Fall 2019 as the Census Bureau works on the 2017 Economic Census (the EC is conducted every five years so is a big deal). This delay was announced before the shutdown, so we would expect a further delay in the 2019 CBP.


