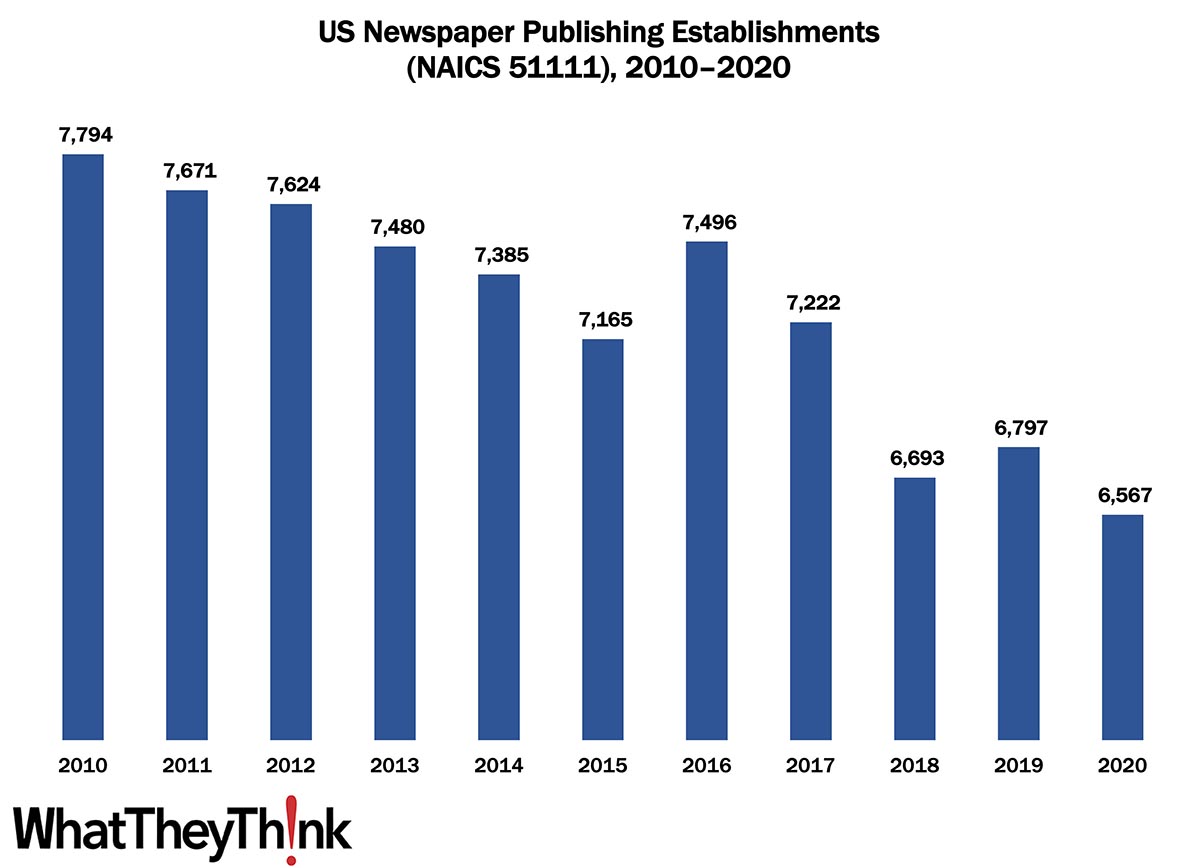
Our Friday data slice’n’dice look at the latest edition of County Business Patterns has been detailing the publishing industries. As 2020 began, there were 6,567 establishments in NAICS 51111 (Newspaper Publishing), a decrease of 16% since 2010.
It’s tempting to blame the Internet on the decline of newspaper circulation, but that really only hastened a trend that started with the advent of television (and the nightly news) and then by the advent of 24-hour cable news. At the same time, there has been tremendous consolidation among newspaper publishers, with one company owning many local papers, and even centralizing editorial and production facilities. The hardest hit have been small, local papers, which has serious consequences for local journalism.
To clarify what is included in the 2020 CBP, establishment counts represent the number of locations with paid employees at any time during the year. If an establishment existed at any point during the year, it would be included in the CBP count of the number of establishments for 2020 CBP. Thus, businesses lost during the COVID pandemic won’t be accounted for until the 2021 CBP.
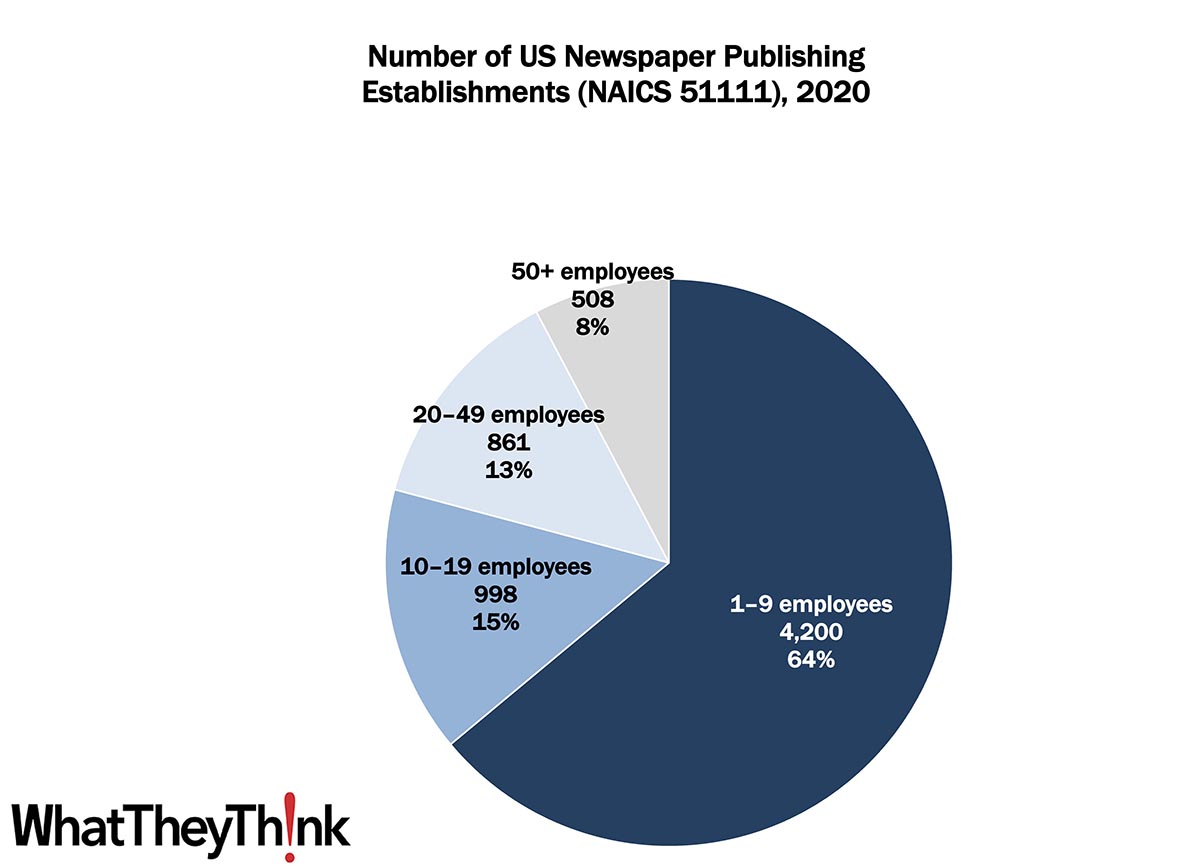
As we saw in the printing categories, publishing establishments are concentrated at the lower end of the employee-count spectrum. Small publishers (1 to 9 employees) comprise the bulk of the establishments, accounting for 66% of all establishments, with the other three employee size categories equally sized at 11–12% each.
These counts are based on data from the Census Bureau’s County Business Patterns. Throughout this year, we will be updating these data series with the latest CBP figures. County Business Patterns includes other data, such as number of employees, payroll, etc. These counts are broken down by commercial printing business classification (based on NAICS, the North American Industrial Classification System). Up next:
- 51112 Periodical Publishers
- 51113 Book Publishers
- 51114 Directory and Mailing List Publishers
- 51119 Other Publishers
- 511191 Greeting Card Publishers
- 511199 All Other Publishers
These data, and the overarching year-to-year trends, like other demographic data, can be used not only for business planning and forecasting, but also sales and marketing resource allocation.
This Macro Moment…
Last week, Calculated Risk rounded up some early predictions of Q3 GDP, which are getting a little bit more bullish:
- Bank of America boosted its 3Q US GDP tracking estimate by 0.2 percentage point (pp) to +1.9% Q/Q SAAR, up from +1.7%.
- Goldman upped their Q3 GDP tracking estimate by 0.4 pp to +2.3% (QOQ AR).
- The Atlanta Fed’s GDPNow estimate for real GDP growth (seasonally adjusted annual rate) in the Q3 2022 is 2.8 percent.
OK, not hugely bullish, but at least they’re not negative. The official advance estimate of Q3 GDP from the Bureau of Economic Statistics will be released October 27. You may recall that Q2 GDP decreased by -0.6%.


