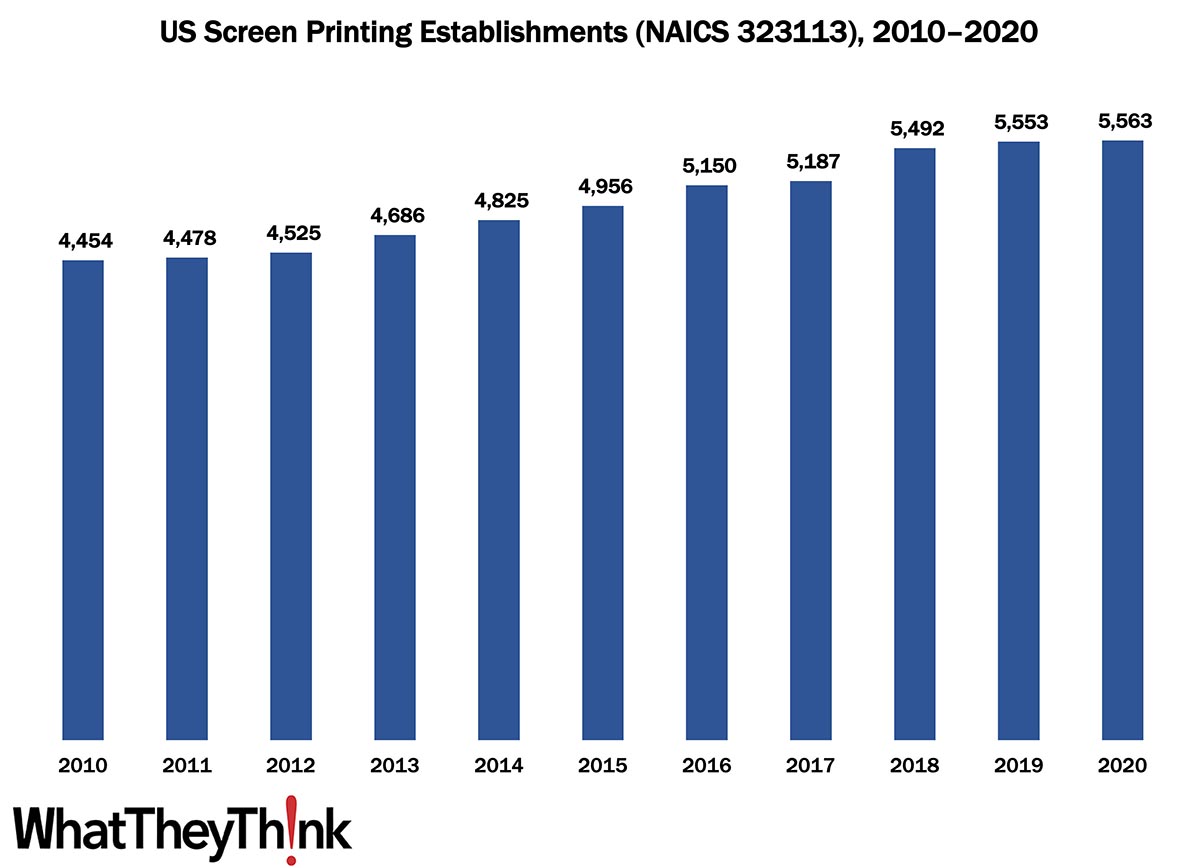
The latest edition of County Business Patterns was recently released, which includes 2020 data. (CBP 2020 data reflects the number of establishments as of March—so these counts are pre-COVID.)
As 2020 began, there were 5,563 establishments in NAICS 323113 (Commercial Screen Printing). This represents an increase of 25% since 2010, the only commercial printing category that has seen a steady (or any) growth in establishments. This is thanks to the rise of specialty printing. Screen is commonly used to print on textiles (T-shirts being the emblematic example), and these kinds of promotional items really started to take off in the past decade. Couple this with the rise of short-run and digital technologies that can complement screen, and as demand for specialty items has increased, establishments have grown to take advantage of this hot print application area. It’s very common to find hybrid screen/digital shops, and even hybrid screen/digital workflows for the same products—kind of like the “digital printing on offset shells” approach that used to be very popular (and still exists to a large extent) among commercial printers. And let’s also not forget the growth of industrial printing, in which screen and pad printing also play a very large role.
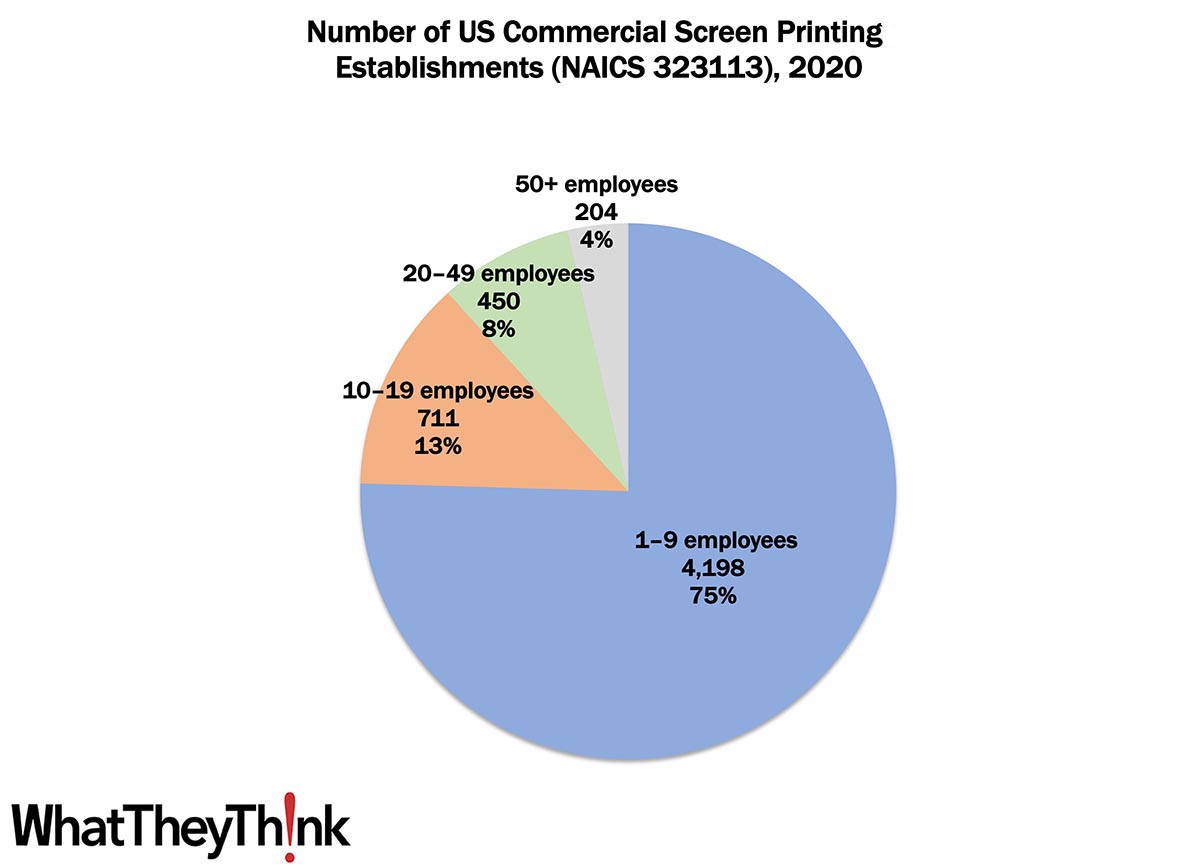
Small shops (1 to 9 employees) still comprise the bulk of the screen printing industry, accounting for 75% of all establishments. The largest shops account for only 4% of industry establishments with mid-size shops accounting for about one-fifth of establishments. These percentages have not varied substantially since at least as far back as 2010.
These counts are based on data from the Census Bureau’s County Business Patterns. Throughout this year, we will be updating these data series with the latest CBP figures. County Business Patterns includes other data, such as number of employees, payroll, etc. These counts are broken down by commercial printing business classification (based on NAICS, the North American Industrial Classification System):
- 323117 (Books Printing)
- 32312 (Support Activities for Printing—aka prepress and postpress services)
These data, and the overarching year-to-year trends, like other demographic data, can be used not only for business planning and forecasting, but also sales and marketing resource allocation.
This Macro Moment…
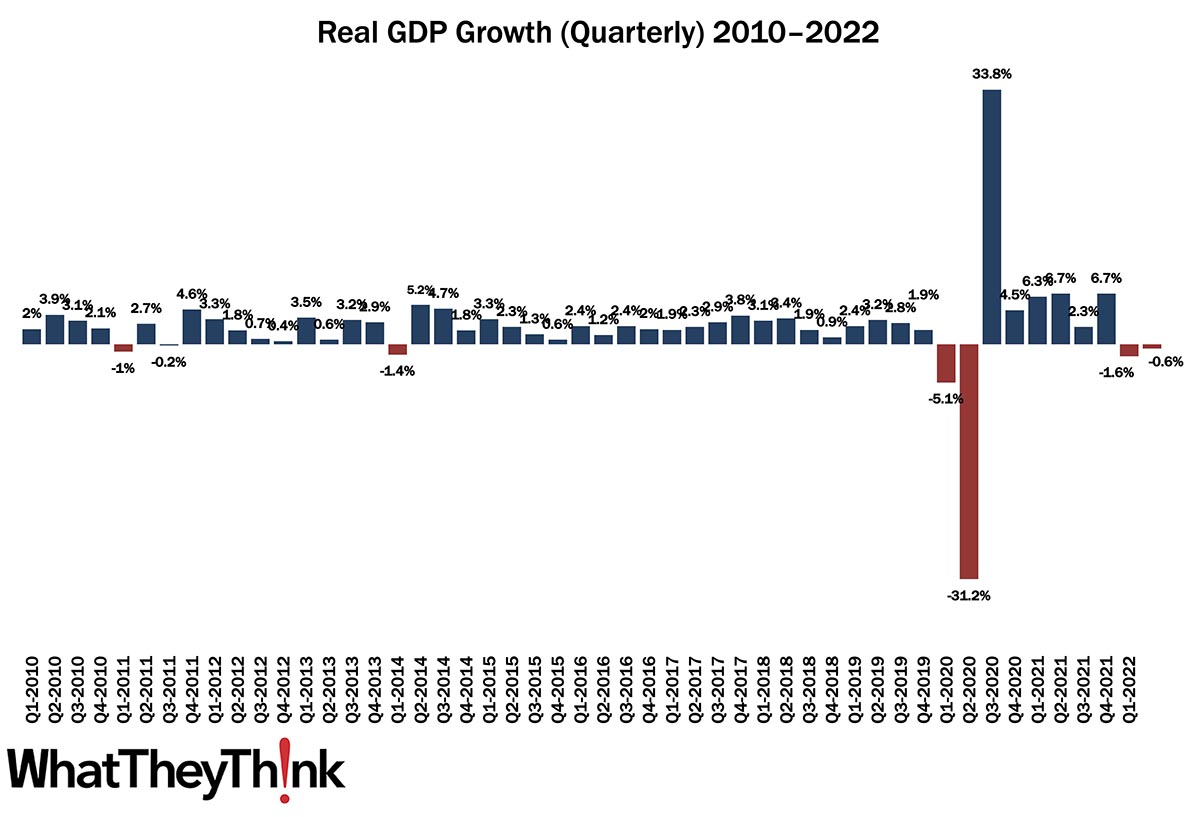
Yesterday, the Bureau of Economic Analysis released its second estimate of Q2 GDP:
Real gross domestic product (GDP) decreased at an annual rate of 0.6 percent in the second quarter of 2022 (table 1), according to the "second" estimate released by the Bureau of Economic Analysis. In the first quarter, real GDP decreased 1.6 percent.
The GDP estimate released today is based on more complete source data than were available for the "advance" estimate issued last month. In the advance estimate, the decrease in real GDP was 0.9 percent. The update primarily reflects upward revisions to consumer spending and private inventory investment that were partly offset by a downward revision to residential fixed investment
If you want to dig into a detailed comparison of the two estimates, check it out here.


