As 2023 began, there were 360 establishments in NAICS 323117 (Books Printing). This represents an decrease of 33% since 2010, although there was a growth of 15 establishments from 2021 to 2022.

The Bureau of the Census definition for this business classification:
This U.S. industry comprises establishments primarily engaged in printing or printing and binding books and pamphlets without publishing.
You can see that book printing establishments were up and down throughout the decade, the ebbing and flowing in this business category reflecting the old story of consolidation as well as the results of both shop diversification and specialization. Today’s equipment (production inkjet in particular) can produce a variety of print products, so shops don’t have to stick to any one particular niche the way they used to. So some quantity of “book printers” may not consider themselves just book printers, and thus they classify themselves as general commercial printers or some other business category that better describes what they do. It also goes in the other direction: books have remained a perennially popular print product—especially during and since the pandemic lockdown—and as more book production moves to the digital on-demand variety, it can be a significant niche to pursue all on its own. Books also lend themselves to more dedicated workflows (highly integrated text printing, cover printing, binding, shipping) so it often makes sense to dedicate production solely to books, especially if the volume is there.
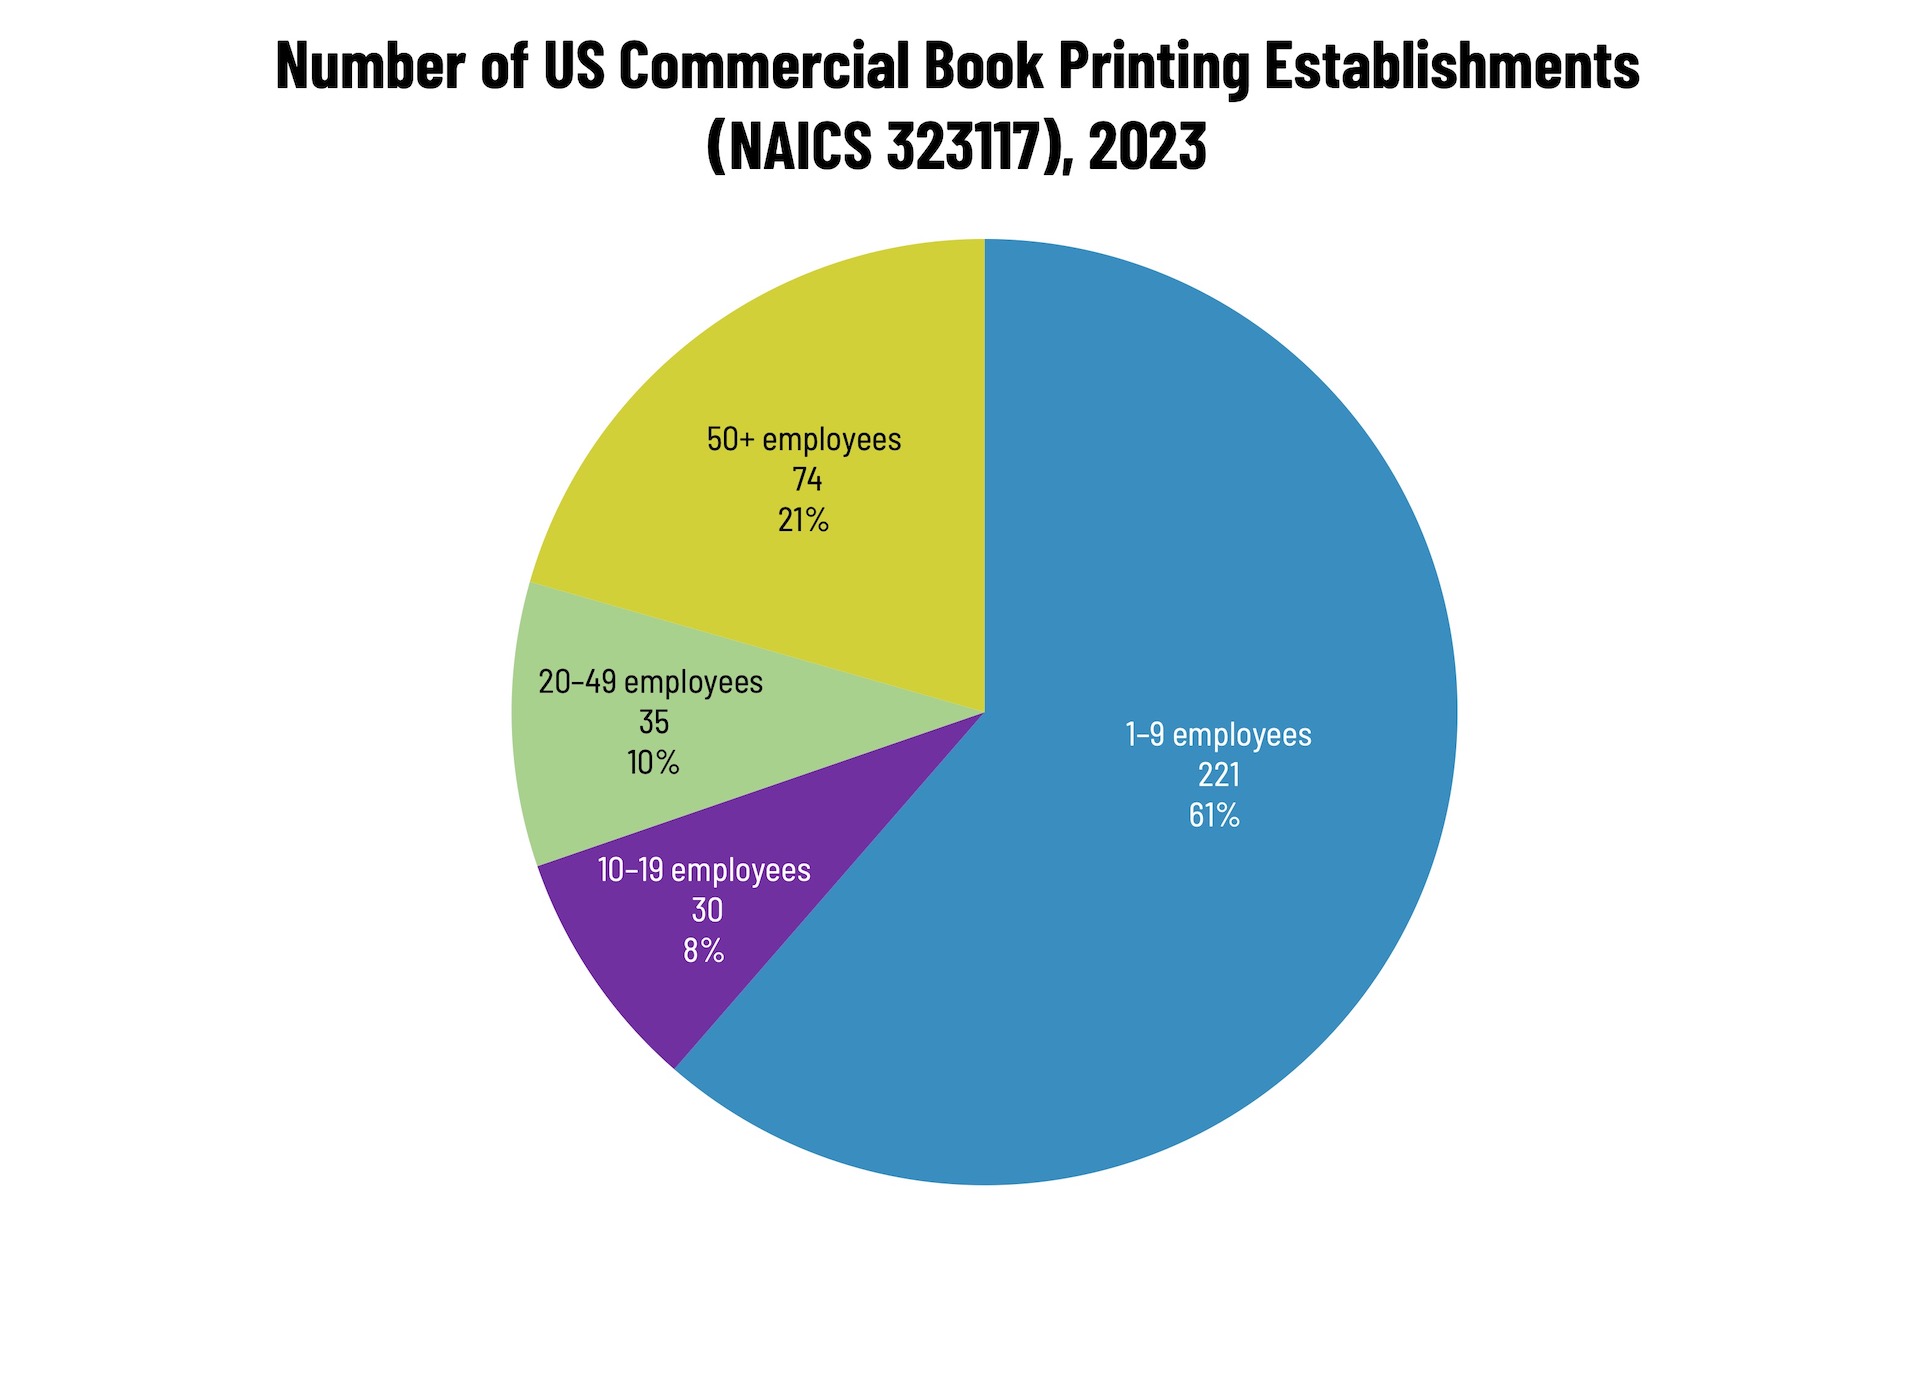
Unlike other printing categories, book printing establishments are not as concentrated at the lower end of the employee-count spectrum. Small shops (1 to 9 employees) still comprise the bulk of the book printing industry, but only account for 61% of all establishments. The largest shops account for one-fifth (21%) of industry establishments with mid-size shops also accounting for 18% of establishments.
These counts are based on data from the Census Bureau’s County Business Patterns. Throughout this year, we will be updating these data series with the latest CBP figures. County Business Patterns includes other data, such as number of employees, payroll, etc. These counts are broken down by commercial printing business classification (based on NAICS, the North American Industrial Classification System):
- 32312 (Support Activities for Printing—aka prepress and postpress services)
These data, and the overarching year-to-year trends, like other demographic data, can be used not only for business planning and forecasting, but also sales and marketing resource allocation.
This Macro Moment…
On Tuesday, the Bureau of Labor Statistics released its CPI for April. Ugh:
The Consumer Price Index for All Urban Consumers (CPI-U) increased 0.6 percent on a seasonally adjusted basis in April, after rising 0.9 percent in March, the U.S. Bureau of Labor Statistics reported today. Over the last 12 months, the all items index increased 3.8 percent before seasonal adjustment.
The index for energy rose 3.8 percent in April, accounting for over forty percent of the monthly all items increase. The shelter index also increased in April, rising 0.6 percent. The index for food increased 0.5 percent over the month as the index for food at home rose 0.7 percent and the index for food away from home increased 0.2 percent.
The index for all items less food and energy rose 0.4 percent in April. Indexes that increased over the month include household furnishings and operations, airline fares, personal care, apparel, and education. Conversely, the indexes for new vehicles, communication, and medical care were among the major indexes that decreased in April.
And on Wednesday, the BLS released its Producer Price Index:
The Producer Price Index for final demand increased 1.4 percent in April, seasonally adjusted, the U.S. Bureau of Labor Statistics reported today. Final demand prices advanced 0.7 percent in March and 0.6 percent in February. (See table A.) The April increase is the largest advance since rising 1.7 percent in March 2022. On an unadjusted basis, the index for final demand rose 6.0 percent for the 12 months ended in April, the largest 12-month increase since moving up 6.4 percent in December 2022.
Nota bummer: The PPI is sometimes a predictor of future inflation.


