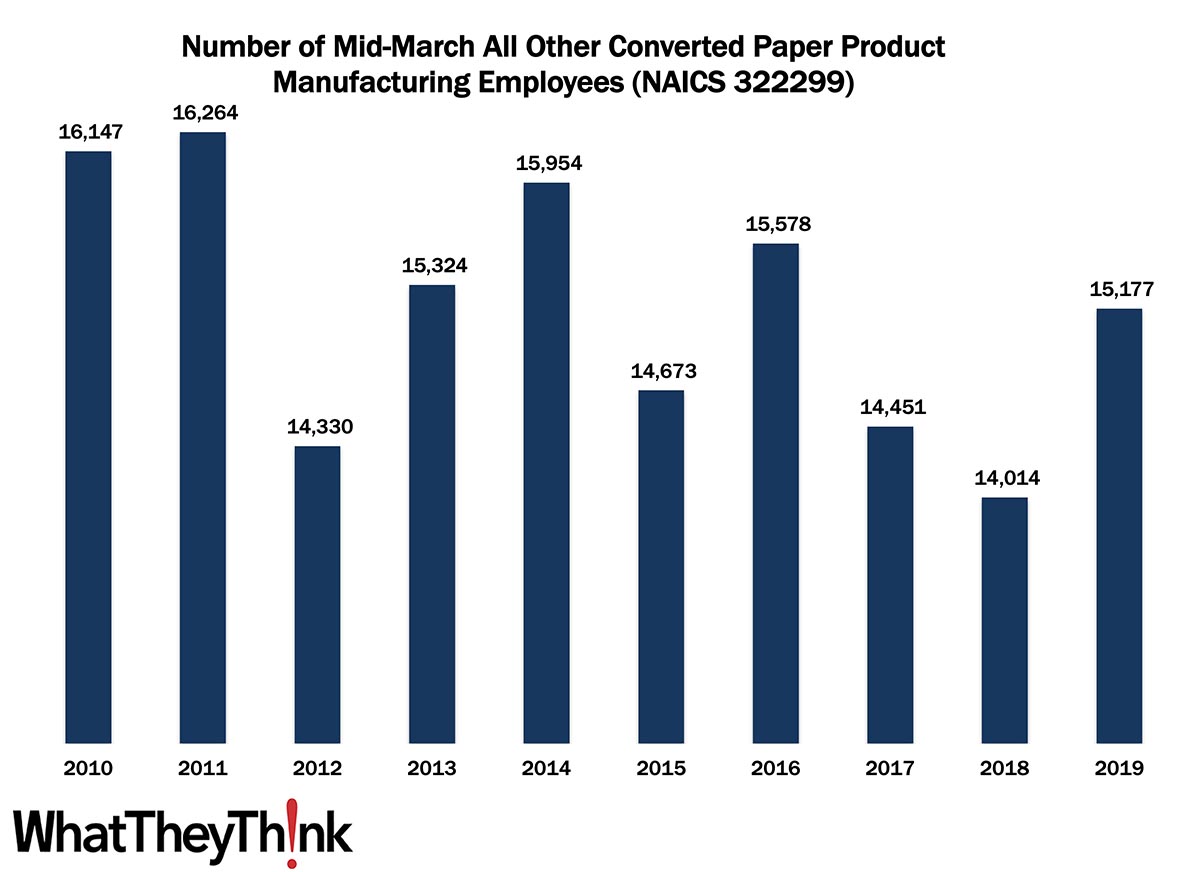
According to County Business Patterns, in 2010, there were 16,147 employees in 322299 (All Other Converted Paper Product Manufacturing establishments). This NAICS category bounced up and down over the course of the 2010s, ending with 15,177 employees in 2019.
The Bureau of the Census definition for this business classification:
This U.S. industry comprises establishments primarily engaged in converting paper or paperboard into products (except containers, bags, coated and treated paper, stationery products, and sanitary paper products) or converting pulp into pulp products, such as egg cartons, food trays, and other food containers from molded pulp.
Since this product category largely comprises food trays, egg cartons, and a similar hodgepodge of food packaging-related products, trends in this packaging category will depend upon trends in the types of food they contain. For example, in 2018, around the endpoint of the CBP data series, egg consumption had been increasing and creative egg packaging was seen as an “uncracked market,” according to the American Egg Board (waka waka). Competition from foam-based food trays and cartons was and continues to be substantial, and while cushioning, cost-effectiveness, and moisture-impermeability work in foam’s favor, biodegradability/sustainability works in the favor of paper-based trays/cartons. At the time, there was also increased demand for food trays/packaging (take-out, restaurant leftovers, school and cafeteria use, etc., e.g.), but had been moving in foam’s direction. (There was of course a spike in home delivery/take-out during the lockdowns of 2020, so it will be interesting to see what this data series looks like in a couple of years.) At the same time, the increasing number of municipal bans on foam takeout containers can work to paper’s advantage.
Next up in our data slice’n’dice series:
- NAICS 339950 Sign Manufacturing
- NAICS 541850 Display/Outdoor Advertising
This Macro Moment
Yesterday was GDP day, and what a day it was. Said the BEA:
Real gross domestic product (GDP) increased at an annual rate of 6.9 percent in the fourth quarter of 2021, according to the "advance" estimate released by the Bureau of Economic Analysis. In the third quarter, real GDP increased 2.3 percent....
The increase in real GDP primarily reflected increases in private inventory investment, exports, personal consumption expenditures (PCE), and nonresidential fixed investment that were partly offset by decreases in both federal and state and local government spending. Imports, which are a subtraction in the calculation of GDP, increased.
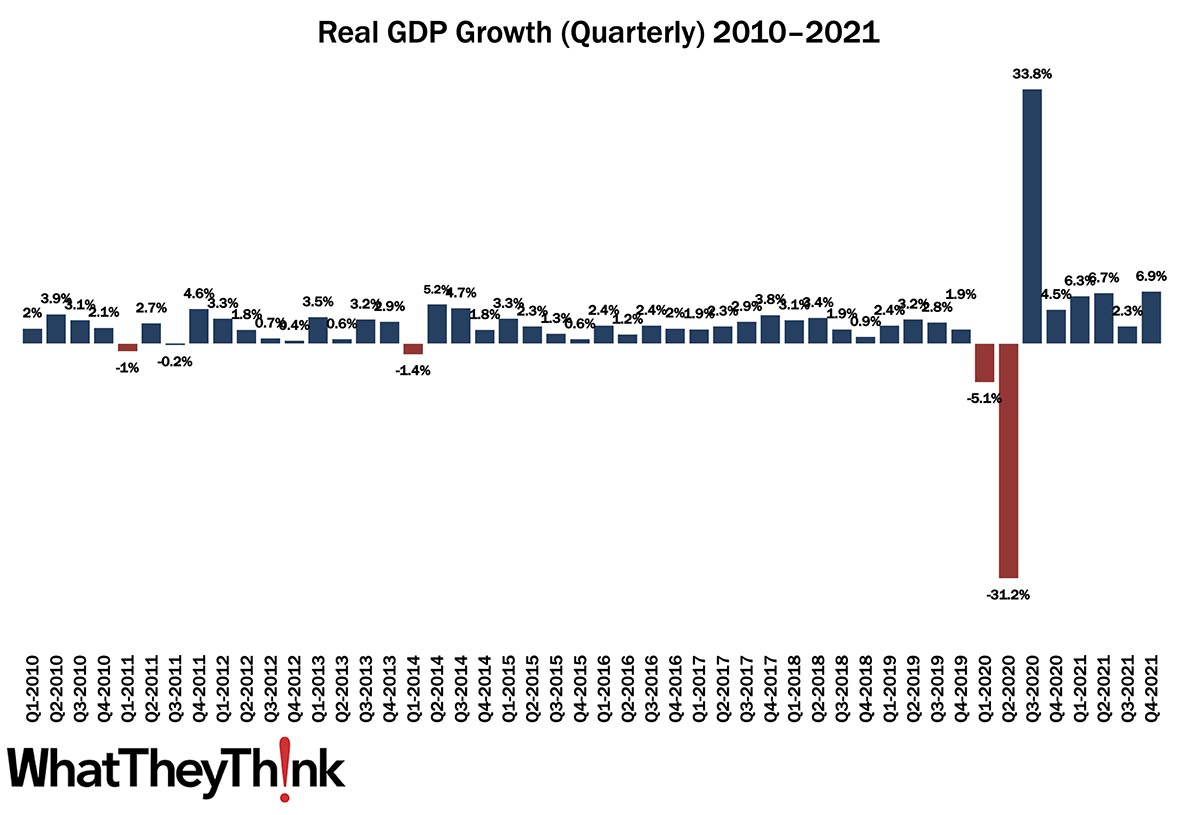
The BEA added, “Real GDP increased 5.7 percent in 2021 (from the 2020 annual level to the 2021 annual level), in contrast to a decrease of 3.4 percent in 2020. This 5.7% is the biggest annual increase in GDP since 1984, but a lot, if not most, of it just reflects climbing out of the 2020 hole. Still, this is nothing to sneeze at, and the 6.9% growth in Q4 was higher than economists generally expected.


