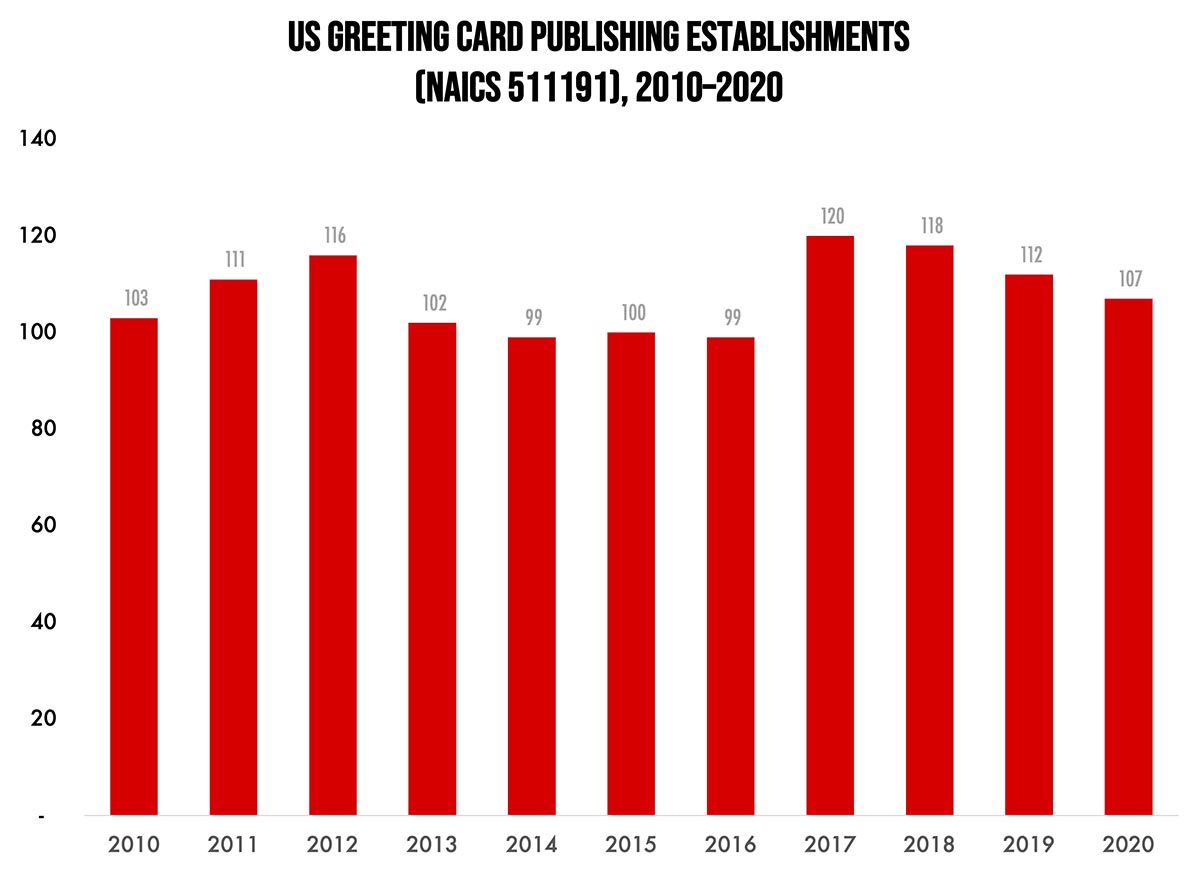
Our Friday data slice’n’dice look at the latest edition of County Business Patterns has been detailing the publishing industries. As 2020 began, there were 107 establishments in NAICS 511191 (Greeting Card Publishing). Although this represents a net increase of 4% since 2010, it has been a category that has ebbed and flowed over the course of the decade, although we’re not talking about a tremendous number of establishments.
The Greeting Card Association doesn’t seem to have the general industry statistics they used to, but as recently as 2018 they had found:
- Americans purchase approximately 6.5 billion greeting cards each year. Annual retail sales of greeting cards are estimated between $7 and $8 billion.
- Nine out of every ten households buy greeting cards each year.
- USPS reported that greeting card mail volume has increased last year, for the fourth year in a row (USPS Household Diary Study).
NDP Analytics had found in 2020 that:
- Unlike the stamped letter category overall, greeting cards experienced growth from FY 2015-18. However, in FY 2019, greeting card volume suddenly declined more than 15%.
They add:
- The timing of the decline in greeting card volume parallels the 10% increase in first-ounce stamp prices. It is the only factor that appears to align with the change in greeting card volume. While other factors, such as electronic diversion, contribute to steady decreases in physical greeting card volume, they cannot explain the sudden decline in FY 2019.
The Greeting Card Association published a 2022 white paper on the subject of greeting card use by small businesses. Some interesting findings from the 2,000 small businesses they surveyed:
- One-third of small businesses send greeting cards during the winter holiday season
- 87% of those cards are physical, not e-
- 91% of greeting cards are sent to current customers
Digital technologies have made greeting card design and production easier than ever—although we note that it has become typical around the holidays to receive custom photocards containing family photos produced via the likes of SnapChat. We have even run into a few artisans who have picked up a letterpress press and started a boutique card production facility in a garage. These numbers yet don’t include the pandemic year, but printed mail and greetings cards were ways that people stayed connected during lockdown. So it will be interesting to see those demographics in a few years.
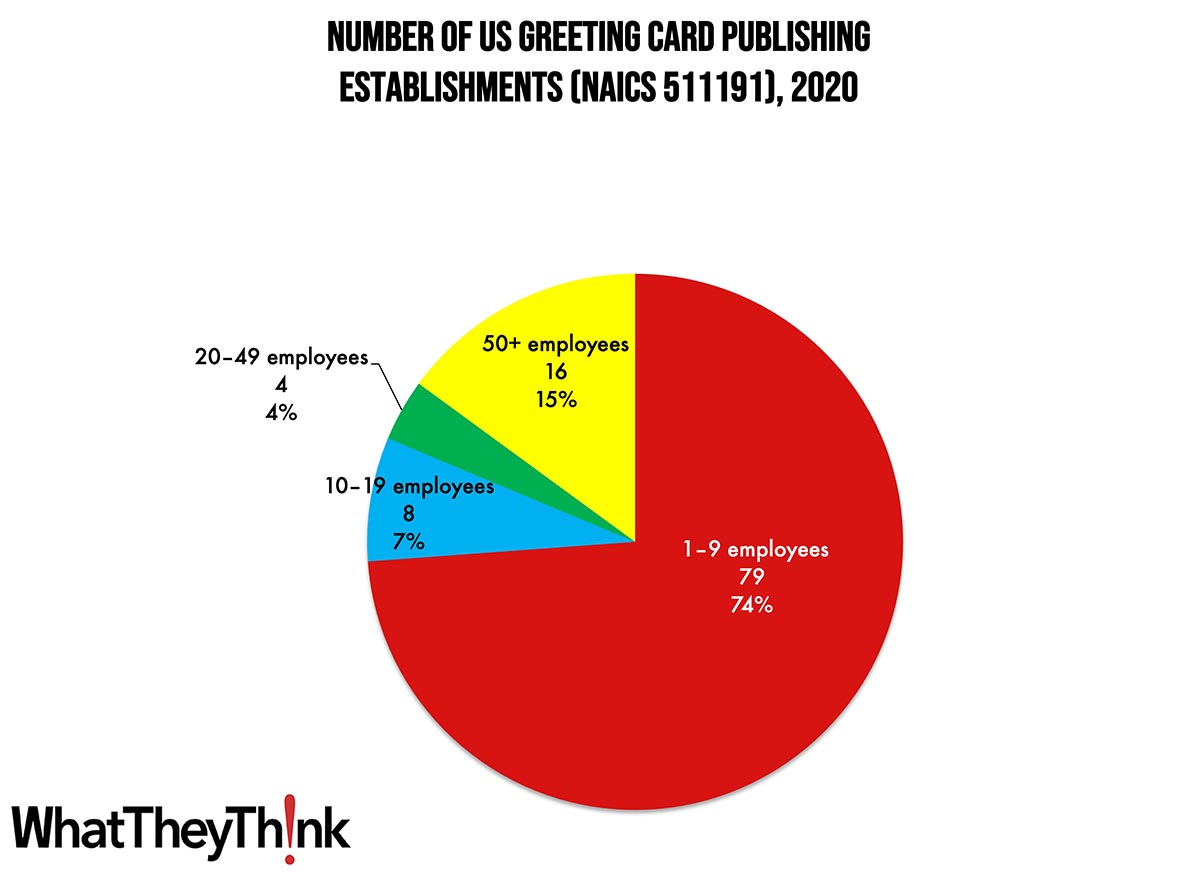
Greeting card publishing establishments are naturally concentrated at the lower end of the employee-count spectrum. Small publishers (1 to 9 employees) comprise the bulk of the establishments, accounting for 85% of all establishments, with the other three size classifications just about equal and under 10%.
These counts are based on data from the Census Bureau’s County Business Patterns. Every other week, we update these data series with the latest figures. These counts are broken down by printing business classification (based on NAICS, the North American Industrial Classification System). We have one more publishing category to go before we turn to packagers and converters:
- 511199 All Other Publishers
To clarify what is included in the 2020 CBP, establishment counts represent the number of locations with paid employees at any time during the year. If an establishment existed at any point during the year, it would be included in the CBP count of the number of establishments for 2020 CBP. Thus, businesses lost during the COVID pandemic won’t be accounted for until the 2021 CBP.
These data, and the overarching year-to-year trends, like other demographic data, can be used not only for business planning and forecasting, but also sales and marketing resource allocation.
This Macro Moment…
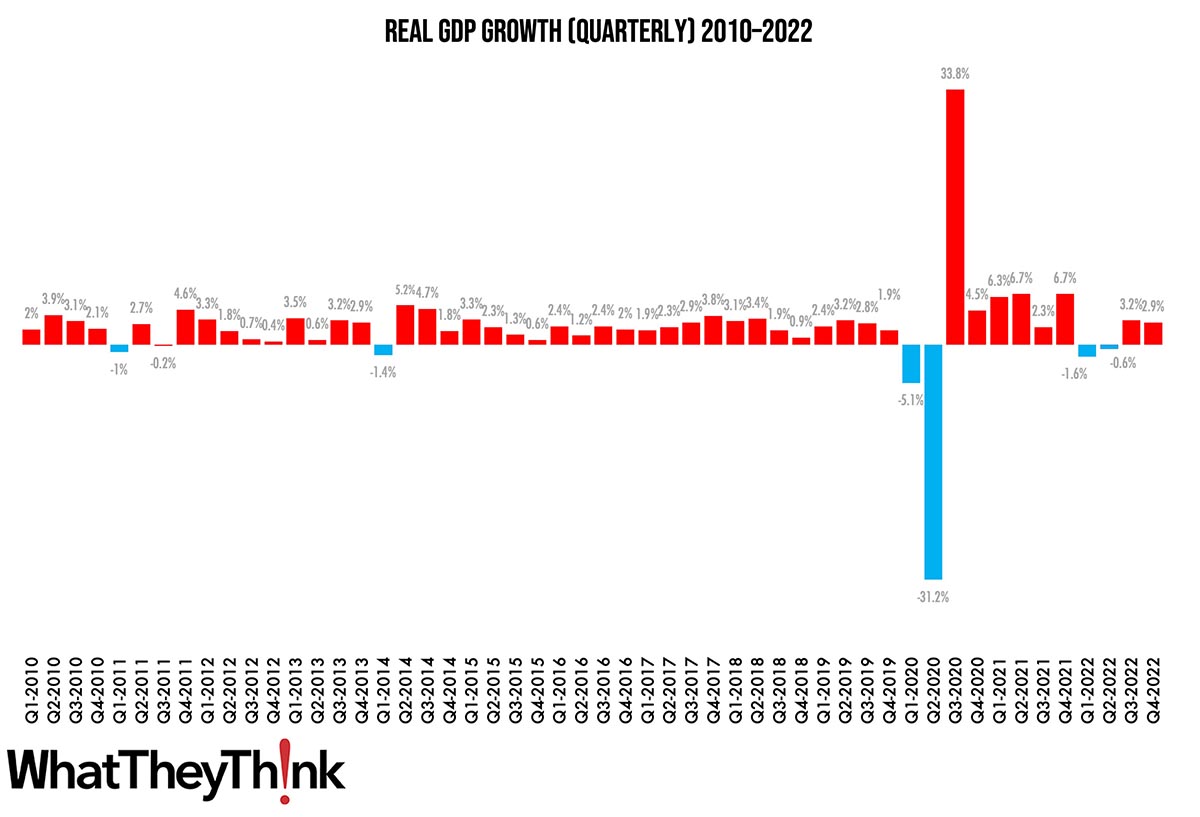
Yesterday, the Bureau of Economic Analysis (BEA) released its first estimate of Q4 GDP:
Real gross domestic product (GDP) increased at an annual rate of 2.9 percent in the fourth quarter of 2022, according to the "advance" estimate released by the Bureau of Economic Analysis. In the third quarter, real GDP increased 3.2 percent....
The increase in real GDP reflected increases in private inventory investment, consumer spending, federal government spending, state and local government spending, and nonresidential fixed investment that were partly offset by decreases in residential fixed investment and exports. Imports, which are a subtraction in the calculation of GDP, decreased.
The increase in GDP was above economists’ expectations. So, with strong GDP growth, strong employment, and easing inflation, if there’s going to be a recession next year, it’s going to be an exceedingly mild one.


