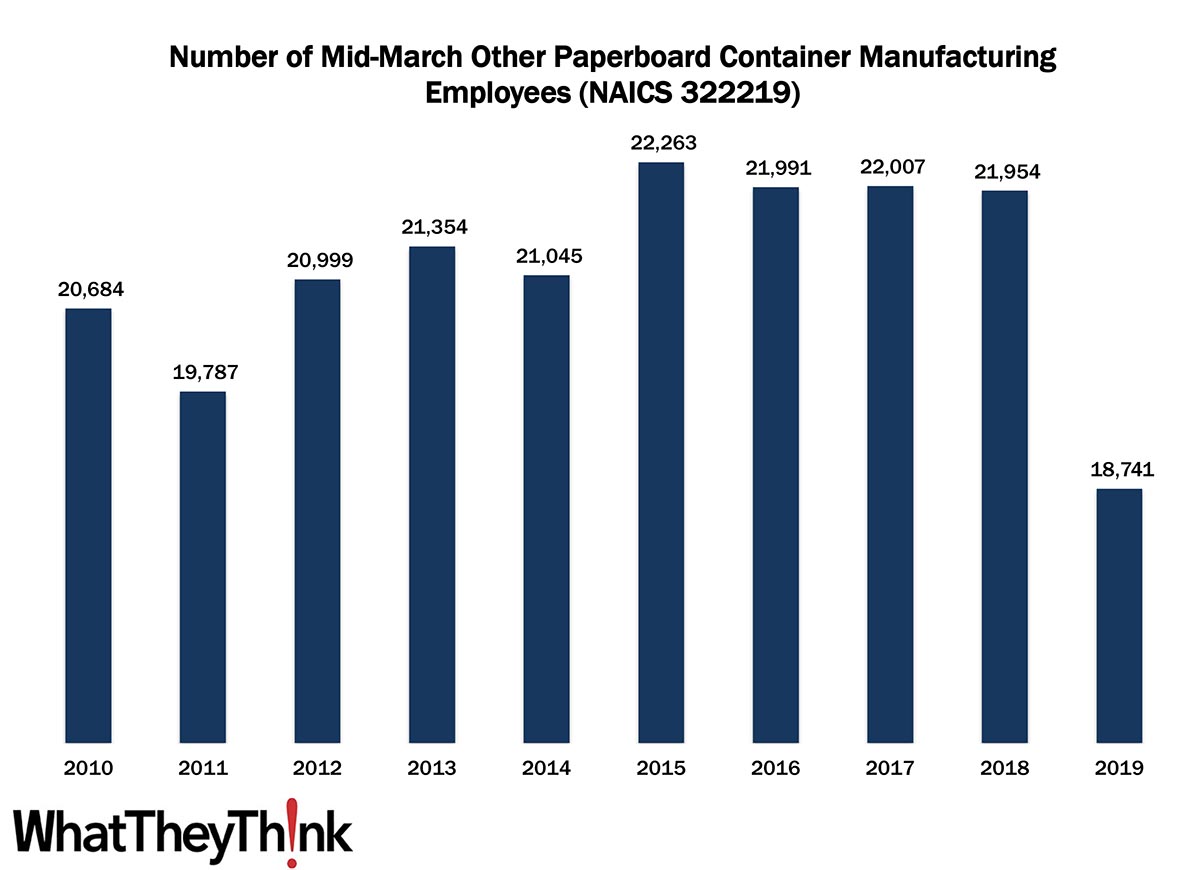
According to County Business Patterns, in 2019, there were 18,741 employees in NAICS 322219 (Other Paperboard Container Manufacturing establishments), a drop from 21,954 employees a year earlier. Employment on this catchall category had been fairly consistent throughout the decade. The products manufactured by establishments in this category include fiber cans and drums made from purchased paperboard, milk cartons, sanitary food containers, etc. It also bears mentioning that after the 2011 Economic Census, the Census Bureau changed some of the categories in NAICS 3222. In 2010 and 2011, NAICS 322219 didn’t exist, instead 3222 was further broken down into 322213 (Setup paperboard box manufacturing), 322214 (Fiber can, tube, drum, and similar products manufacturing), and 322215 (Nonfolding sanitary food container manufacturing). From 2012 on, these three categories were combined to create 322219. (In the chart above, the 2010 and 2011 figures are a combination of these three older categories.)
This category is largely driven by the liquid packaging market, which comprises water, soft drinks, dairy products, and fruit juices. The proliferation of single-serve, “grab-and-go” liquid cartons and containers has been driven by lifestyle/convenience trends, but paperboard cartons for liquid packaging face competition from various types of plastics, like PET. Anecdotally, we notice some switch back to paper containers as plastic becomes an environmental concern, but then environmental concerns are starting to reverse this competition as natural materials are preferred over plastics.
The 3222 four-digit NAICS comprises a variety of different converted packaging types, and over the next several months, we will continue looking at them in turn, including:
- 32222 Paper Bag and Coated and Treated Paper Manufacturing
- 32223 Stationery Product Manufacturing
- 32229 Other Converted Paper Product Manufacturing
- 322291 Sanitary Paper Product Manufacturing
- 322299 All Other Converted Paper Product Manufacturing
These counts are based on data from the Census Bureau’s County Business Patterns. Every other week, we update these data series with the latest figures. You may have noticed that the latest edition of County Business Patterns was released recently, which now includes 2019 data. Once we have finished with the Converting NAICS, we will circle back to the beginning and update establishment and other counts in the printing, publishing, and creative NAICS.
These data, and the overarching year-to-year trends, like other demographic data, can be used not only for business planning and forecasting, but also sales and marketing resource allocation.
This Macro Moment
It’s a post-pandemic phenomenon that The Economist has called “bezonkers,” as in “New business formation in America goes bezonkers.” In September 2021, the Census Bureau’s Business Formation Statistics recorded 431,381 new business applications, a +0.8% increase from August. Compare this to a fairly average pre-pandemic month—say, November 2019—when the Census Bureau recorded 290,562 new business applications. This is a phenomenon that started last year, when new business applications went from 295,129 in May, to 378,508 in June, and then spiked to 552,981 in July.
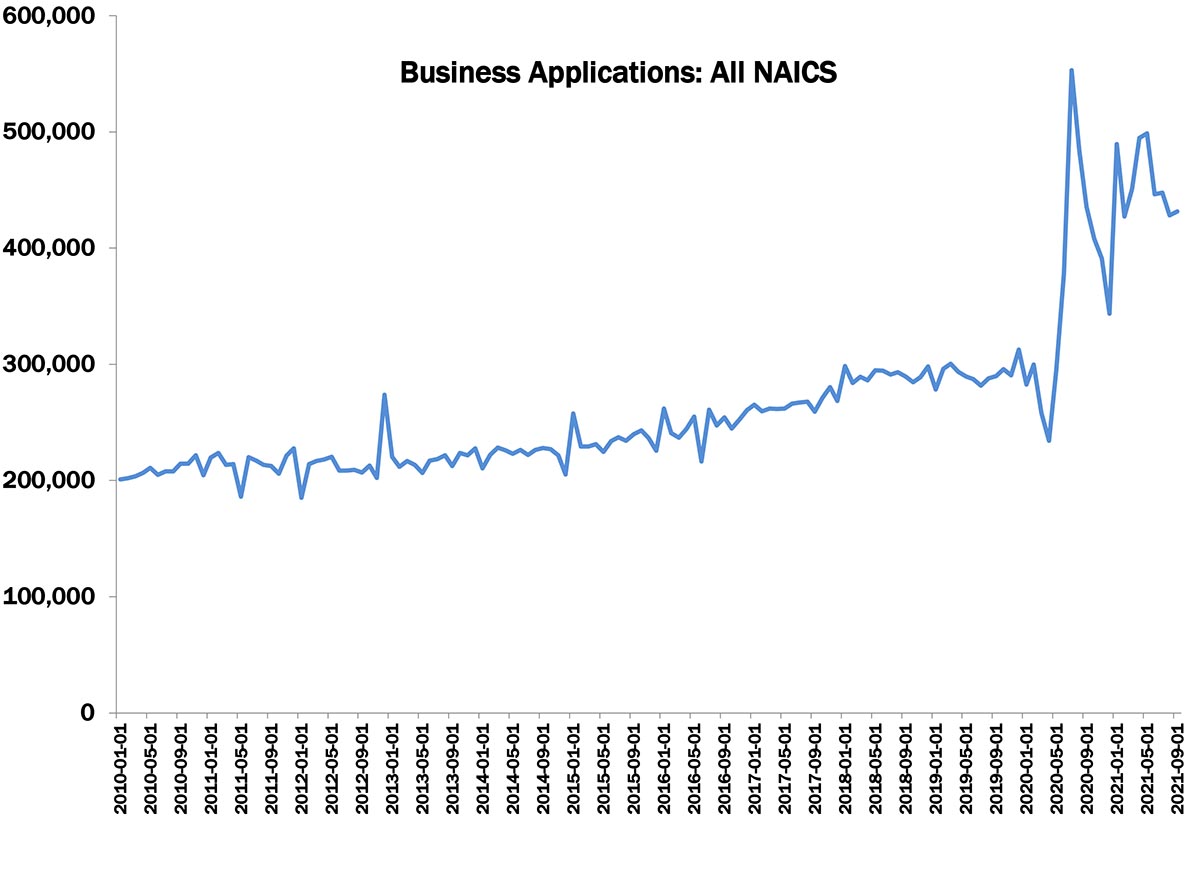
Source: Bureau of the Census
Applications dropped in the fall, but then spiked again after the new year. While some of these new businesses replaced the businesses that failed during 2020, economists see it as one of the consequences of The Great Resignation: people taking stock of their lives and careers during the pandemic and pursuing a dream of business ownership, or at the very least of not being stuck in a job one hates. How much of this will persist beyond 2021/2022 remains to be seen, but, adds Forbes, commenting on the July numbers:
Still more encouraging is the reported rise in what the Census Bureau calls “high propensity applications,” by which it means those new businesses with a high likelihood of supporting a payroll. These, though only some one-third of total applications, also jumped some 1.2% from June’s level for the nation as a whole and had a similar regional pattern to applications overall, with the largest proportion in the South and the strongest monthly jumps in the Northeast and the West.
Here’s why this is important for printers. New businesses need a lot of resources and other materials to get started, a lot of it involving print of some kind—often including signage and other kinds of display graphics. This presents opportunities for print providers.
A deep dive into the specific NAICS categories and geographic regions in which the bulk of these businesses are forming (the Census Bureau’s Business Formation Statistics breaks them down), as well as a check of your local or regional new business registrations, would be a good place to start to mine these opportunities. We may ourselves dig down into these data at some point, but suffice to say, the top sector for new business creation is “retail trade,” followed by “administrative and support.”


