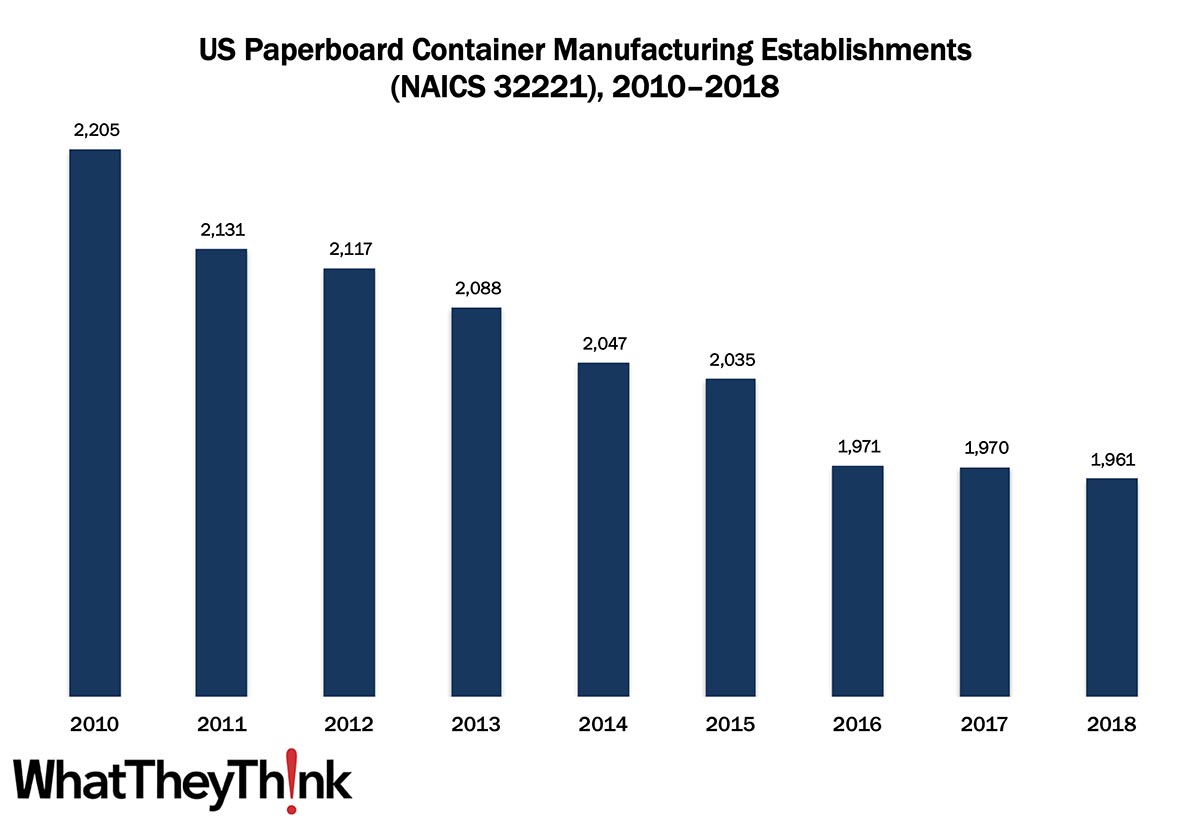
In our ongoing, semi-weekly look at establishment and employee counts of graphic arts businesses, we have turned to packaging/paper converting establishments. In 2010, there were 2,205 establishments in NAICS 32221 (Paperboard Container Manufacturing), but by 2018, that number had declined to 1,961.
The Bureau of the Census definition for this business classification:
This industry comprises establishments primarily engaged in converting paperboard into containers without manufacturing paperboard. These establishments use corrugating, cutting, and shaping machinery to form paperboard into containers. Products made by these establishments include boxes, corrugated sheets, pads, pallets, paper dishes, and fiber drums and reels.
In this category, software prototyping of packaging such as boxes results in innovative designs, which can optimize the logistics of transporting packages, especially from overseas manufacturers. This has only accelerated since, but environmental concerns are becoming more important in box conversion. These data predate the COVID pandemic, but even in the mid-2010s, ecommerce has been driving demand for more and newer types of corrugated boxes.
This four-digit NAICS comprises a variety of different converted packaging types, and over the next several months, we will be looking at them in turn, including:
- 322211 Corrugated and Solid Fiber Box Manufacturing
- 322212 Folding Paperboard Box Manufacturing
- 322219 Other Paperboard Container Manufacturing
- 32222 Paper Bag and Coated and Treated Paper Manufacturing
- 32223 Stationery Product Manufacturing
These counts are based on data from the Census Bureau’s County Business Patterns. Every other week, we update these data series with the latest figures. Census Bureau reports include other data, as well, such as number of employees, payroll, etc. These counts are broken down by publishing business classification (based on NAICS, the North American Industrial Classification System).
These data, and the overarching year-to-year trends, like other demographic data, can be used not only for business planning and forecasting, but also sales and marketing resource allocation.
Over time, we will be adding additional data from County Business Patterns, such as number of employees, payroll, and similar information for additional business classification of relevance to the graphic communications industry.
This Macro Moment
We came across an interesting data point via the economics blog Calculated Risk: the American Institute of Architects (AIA) tracks billing by architectural firms, and calculates what it calls the AIA Architecture Billings Index (ABI) score. The most recent ABI score was for September:
AIA’s ABI score for September was 47.0 compared to 40.0 in August (any score below 50 indicates a decline in firm billings). Last month’s score indicates overall revenue at U.S architecture firms continued to decline from August to September, however, the pace of decline slowed significantly.
Calculated Risk adds, “This includes commercial and industrial facilities like hotels and office buildings, multi-family residential, as well as schools, hospitals and other institutions.”
That the slowdown in architectural firms’ billings moderated in September is good news, even though the ABI score has been below 50 for seven months in a row (a bad thing), which points to a decline in investment in commercial real estate.
This is important for the signage industry because new construction is a primary market for signmaking businesses. Indeed, on Wednesday, the International Sign Association held its Q3 2020 Economic Report webinar and highlighted the economic impact of the architecture industry on the sign business and said that although “there is still a lot of construction happening,” and thus still a need for architectural signage—particularly in health care facilities—we have not seen the majority of it taking place—yet.
The AIA also calculates a score for inquiries into new construction projects:
Inquiries into new projects during September grew for the second time since February, with a score of 57.2 compared to 51.6 in August. The value of new design contracts moderated to a score of 48.9 in September from 46.0 the previous month.
So it looks like early 2021 may see a construction rebound.
(We will have a full report on the ISA Q3 2020 Economic webinar in our November/December print edition.)