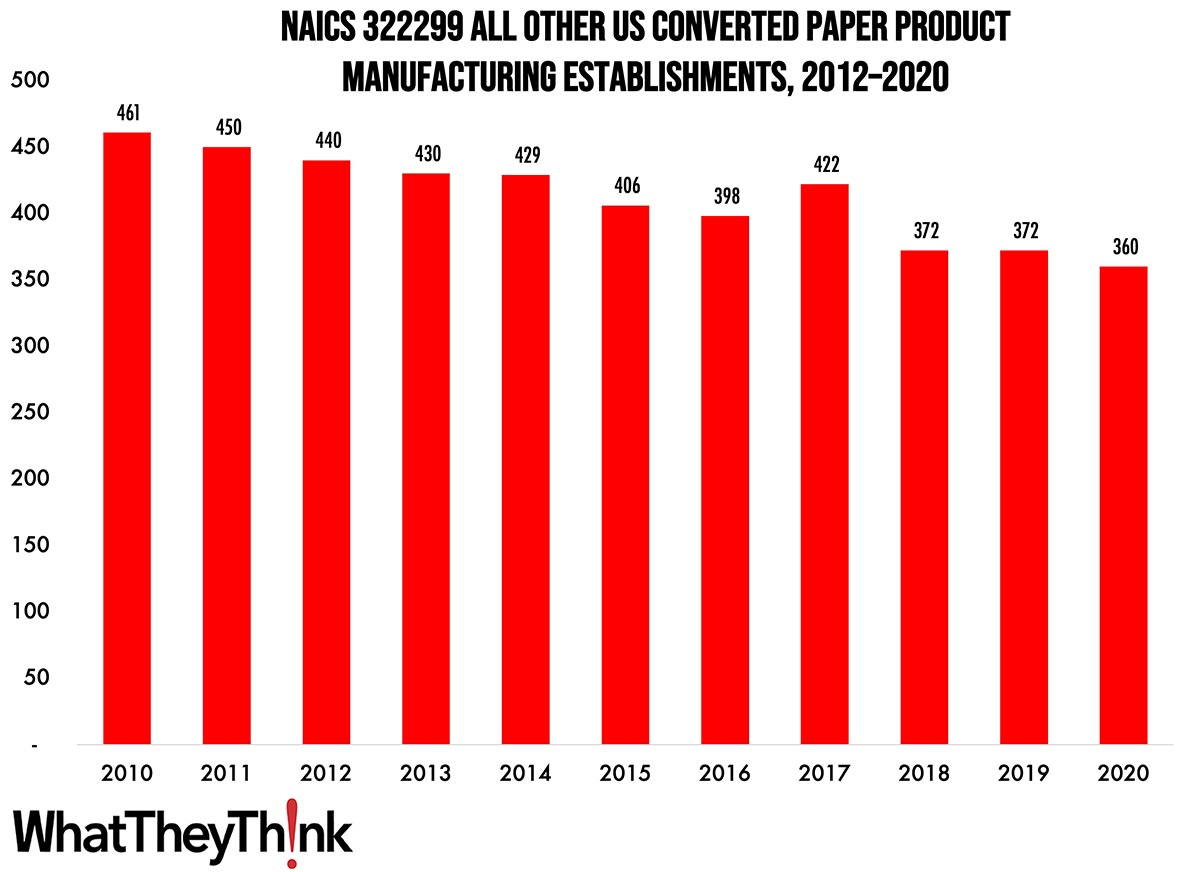
According to County Business Patterns, in 2010, there were 360 establishments in NAICS 322299 (All Other Converted Paper Product Manufacturing). This NAICS category has declined steadily over the course of the decade, although not as dramatically as some of the other categories we have been looking at.
The Bureau of the Census definition for this business classification:
This U.S. industry comprises establishments primarily engaged in converting paper or paperboard into products (except containers, bags, coated and treated paper, stationery products, and sanitary paper products) or converting pulp into pulp products, such as egg cartons, food trays, and other food containers from molded pulp.
Basically, this category comprises the establishments in 32229 (which we looked at previously) with 322291 (Sanitary Paper Products Manufacturing) backed out.
As we said in our commentary on 32229, since this product category largely comprises food trays, egg cartons, and a similar hodgepodge of food packaging-related products, trends in this packaging category will depend upon trends in the types of food they contain. For example, starting in 2018, egg consumption had been increasing and creative egg packaging was seen as an “uncracked market,” according to the American Egg Board. Competition from foam-based food trays and cartons was and continues to be substantial, and while cushioning, cost-effectiveness, and moisture-impermeability work in foam’s favor, biodegradability/sustainability works in the favor of paper-based trays/cartons. At the time, there was also increased demand for food trays/packaging (take-out, restaurant leftovers, school and cafeteria use, etc., e.g.), but had been moving in foam’s direction. (There was of course a spike in home delivery/take-out during the lockdowns of 2020, so it will be interesting to see what this data series looks like next year.) At the same time, the increasing number of municipal bans on foam takeout containers can work to paper’s advantage.
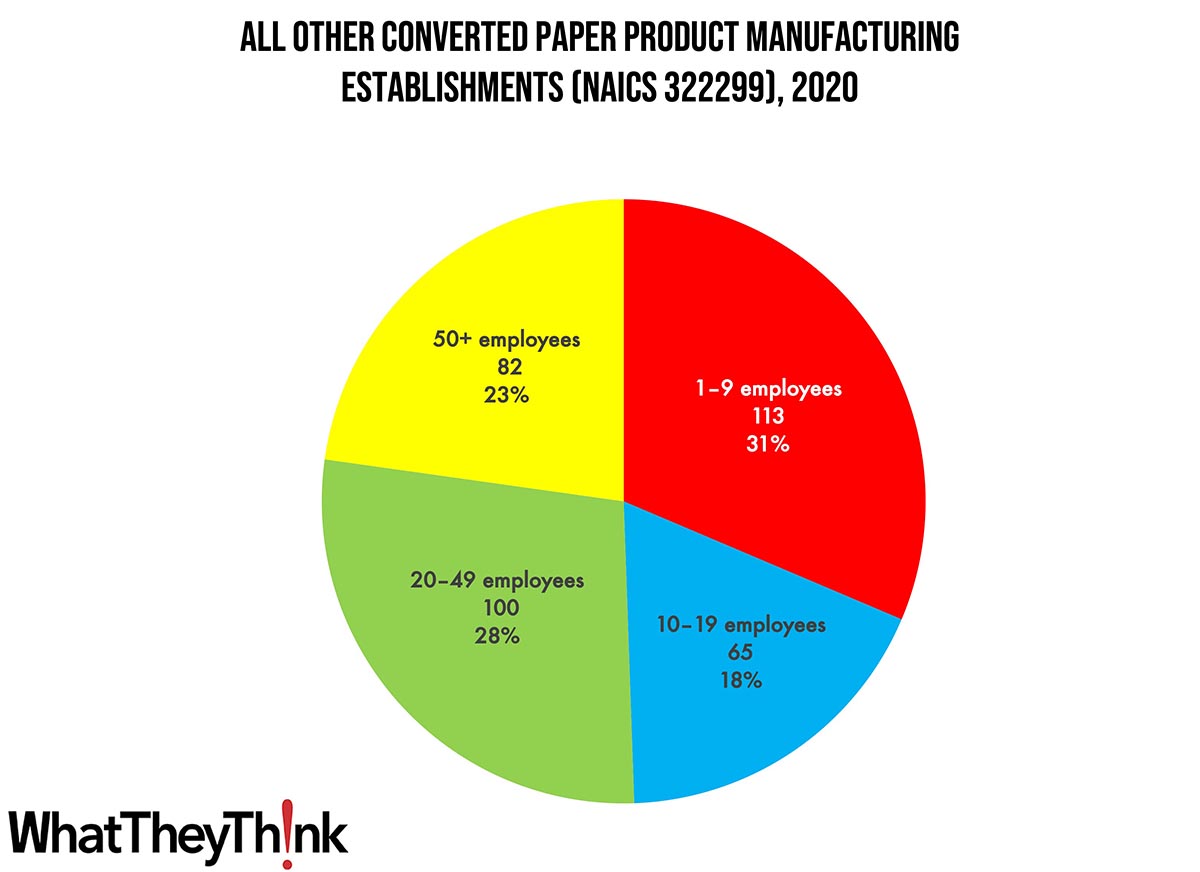
Establishments in this category are pretty evenly distributed. Small converted product manufacturers (1 to 9 employees) account for 27% of all establishments, large manufacturers (50+ employees) account for 33% of establishments, and mid-size establishments (10–49 employees) account for 40%.
Establishments in this category are somewhat evenly distributed, with a slight concentration in the mid-range. Small converted product manufacturers (1 to 9 employees) account for 31% of all establishments, large manufacturers (50+ employees) account for 23% of establishments, and mid-size establishments (10–49 employees) account for 46%.
These counts are based on data from the Census Bureau’s County Business Patterns. Every other week, we update these data series with the latest figures. These counts are broken down by printing business classification (based on NAICS, the North American Industrial Classification System).
To clarify what is included in the 2020 CBP, establishment counts represent the number of locations with paid employees at any time during the year. If an establishment existed at any point during the year, it would be included in the CBP count of the number of establishments for 2020 CBP. Thus, businesses lost during the COVID pandemic won’t be accounted for until the 2021 CBP.
And, as it happens, 2021 County Business Patterns has been released! In two weeks, we are going to circle back to NAICS 323 and see what the pandemic hath wrought. Those categories are:
- 323 Printing and Related Support Activities
- 32311 Printing
- 323111 Commercial Printing (except Screen and Books)
- 323113 Commercial Screen Printing
- 323117 Books Printing
- 32312 Support Activities for Printing
Start drinking now.
These data, and the overarching year-to-year trends, like other demographic data, can be used not only for business planning and forecasting, but also sales and marketing resource allocation.
This Macro Moment…
Last week, the Bureau of Economic Analysis released its advance estimate of Q2 2023 gross domestic product (GDP), and it was good news:
Real gross domestic product (GDP) increased at an annual rate of 2.4 percent in the second quarter of 2023, according to the “advance” estimate released by the Bureau of Economic Analysis. In the first quarter, real GDP increased 2.0 percent.
The increase in real GDP reflected increases in consumer spending, nonresidential fixed investment, state and local government spending, private inventory investment, and federal government spending that were partly offset by decreases in exports and residential fixed investment. Imports, which are a subtraction in the calculation of GDP, decreased.
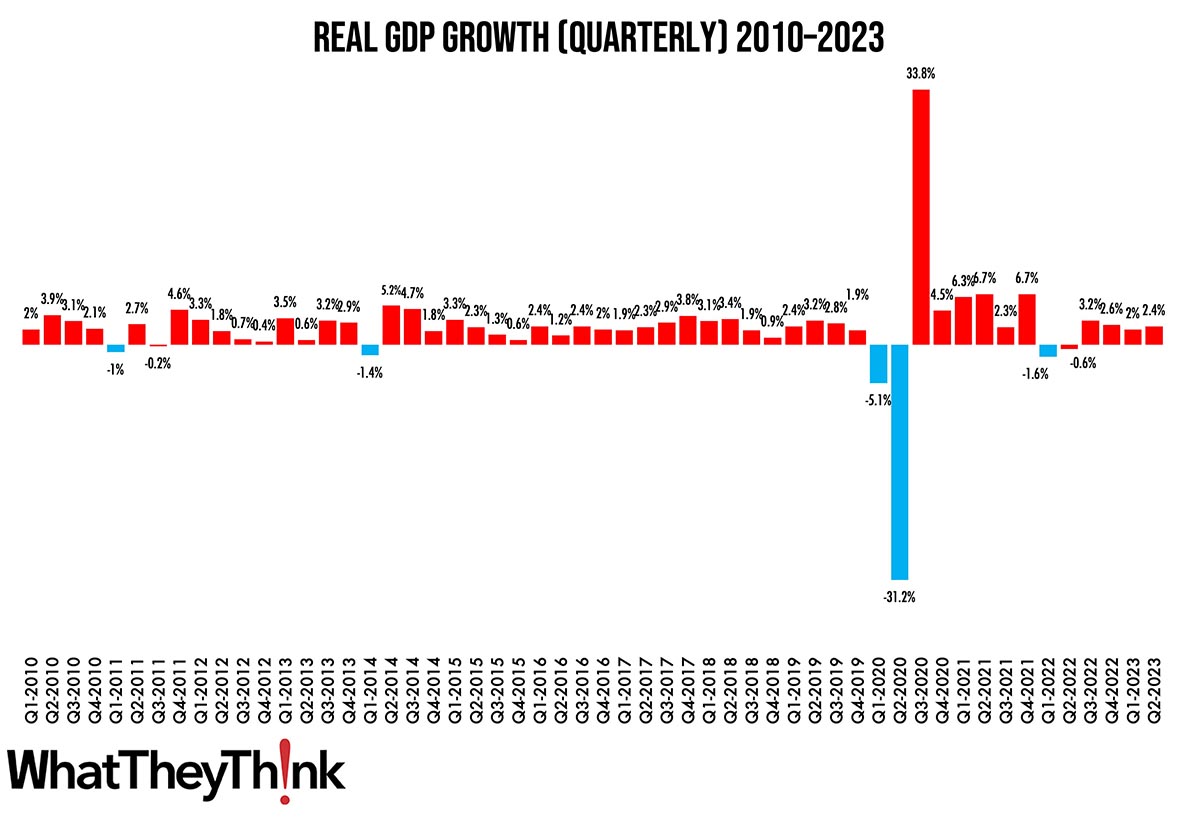
Source: Bureau of Economic Analysis
Some specific areas of increase:
Within services, the leading contributors to the increase were housing and utilities, health care, financial services and insurance, and transportation services. Within goods, the increase was led by recreational goods and vehicles as well as gasoline and other energy goods.
So, with GDP still growing, inflation almost back down to where the Fed wants it, and unemployment still not far above record lows, we headed into the summer in pretty good economic shape. Still no signs of a recession, so there still is little reason—at least macroeconomically—for printers or print buyers to hunker down and cut spending.


