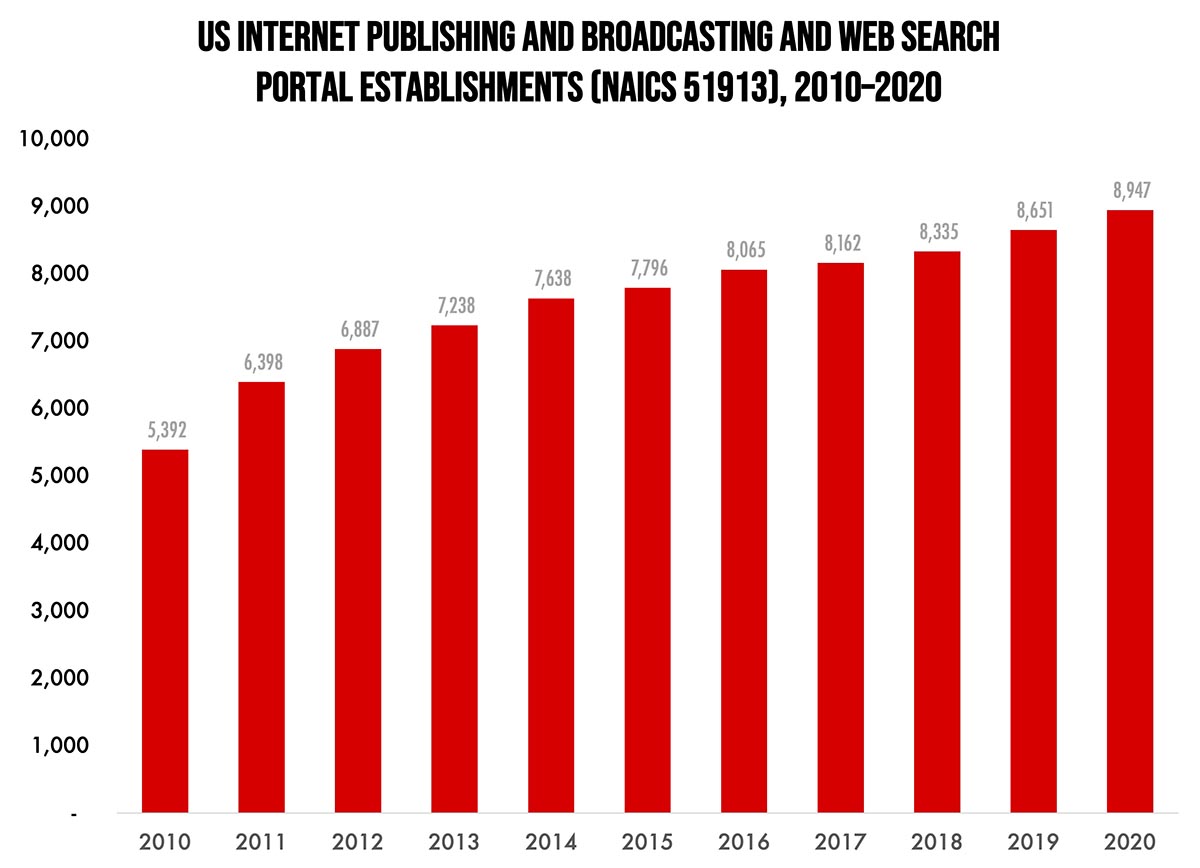
Our Friday data slice’n’dice look at the latest edition of County Business Patterns has been detailing the publishing industries. As 2020 began, there were 8,947 establishments in NAICS 51913 (Internet Publishing and Broadcasting and Web Search Portals). This category saw a net increase of 66% since 2010.
The Bureau of the Census definition for this business classification is:
This industry comprises establishments primarily engaged in (1) publishing and/or broadcasting content on the Internet exclusively or (2) operating Web sites that use a search engine to generate and maintain extensive databases of Internet addresses and content in an easily searchable format (and known as Web search portals). The publishing and broadcasting establishments in this industry do not provide traditional (non-Internet) versions of the content that they publish or broadcast. They provide textual, audio, and/or video content of general or specific interest on the Internet exclusively. Establishments known as Web search portals often provide additional Internet services, such as email, connections to other Web sites, auctions, news, and other limited content, and serve as a home base for Internet users.
The 2010s saw the explosion of social media and podcasting, while not entirely new, also took off in this period, as well as general Internet publishing. The explosion in this category was largely due to reduced costs of entry in the form of publishing, recording, and editing hardware and software, and increased access to WiFi and other broadband Internet. Low overhead costs also mean that huge revenue streams are not required for these kinds of businesses to survive. For many bloggers, “hobbyist” publishers, and podcasters, a sustaining revenue is all that is required.
At the higher end, Internet publishing companies now rival major, traditional newsgathering establishments—Huffington Post, Buzzfeed, Slate, and Salon are sourced as often as “gray lady” publishers like New York Times or even CNN.
Twitter, Facebook, LinkedIn and other social media companies are also found in this category. These are now major media players that compete for advertiser and marketer dollars—often at expense of print and other traditional media.
And trade publishing across many industries is increasingly of the Internet variety. Indeed, WhatTheyThink fits into this category.
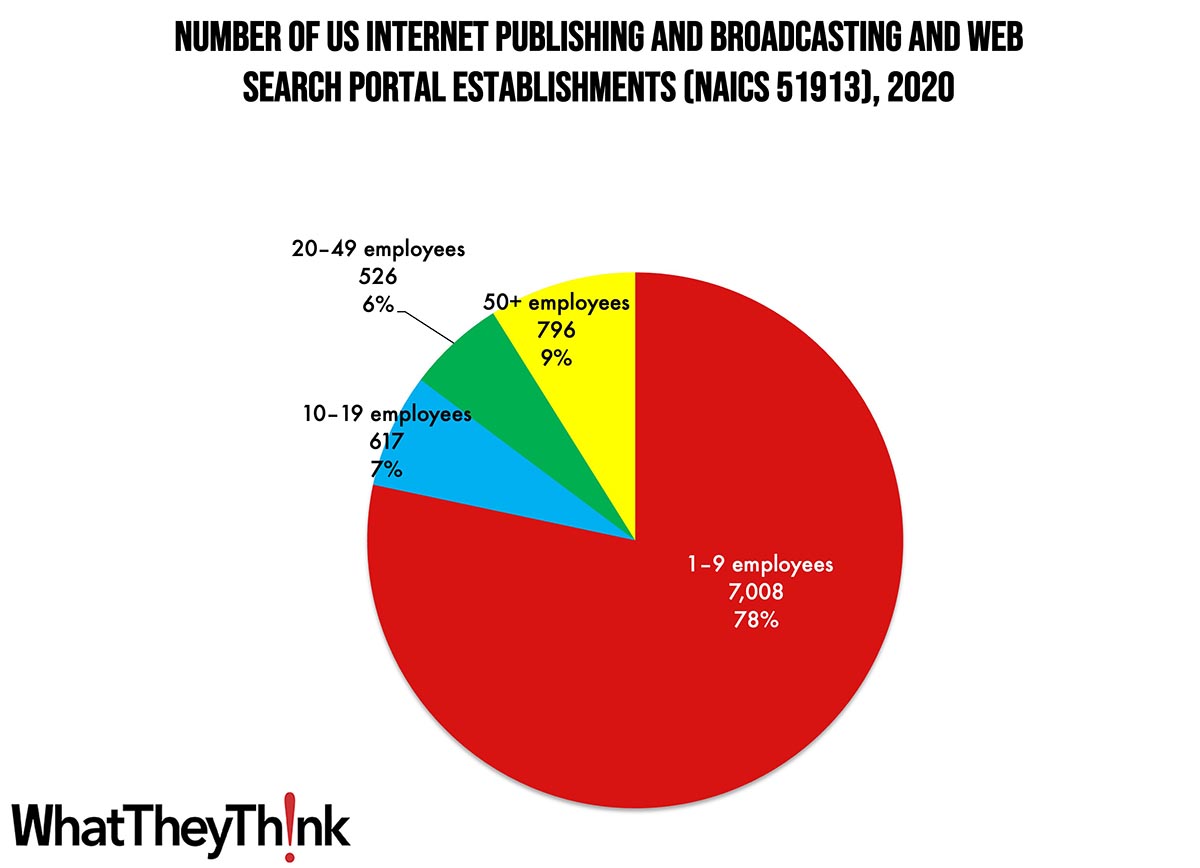
Establishments in this category are concentrated at the lower end of the employee-count spectrum. Small Internet publishers (1 to 9 employees) account for 78% of all establishments, with the other three size classifications account for 6–9% each.
These counts are based on data from the Census Bureau’s County Business Patterns. Every other week, we update these data series with the latest figures. These counts are broken down by printing business classification (based on NAICS, the North American Industrial Classification System).
Next time, we’ll turn our attention to the converting NAICS categories:
- 3222 Converted Paper Product Manufacturing
- 32221 Paperboard Container Manufacturing
- 322211 Corrugated and Solid Fiber Box Manufacturing
- 322212 Folding Paperboard Box Manufacturing
- 322219 Other Paperboard Container Manufacturing
- 32222 Paper Bag and Coated and Treated Paper Manufacturing
- 32223 Stationery Product Manufacturing
- 32229 Other Converted Paper Product Manufacturing
- 322291 Sanitary Paper Product Manufacturing
- 322299 All Other Converted Paper Product Manufacturing
To clarify what is included in the 2020 CBP, establishment counts represent the number of locations with paid employees at any time during the year. If an establishment existed at any point during the year, it would be included in the CBP count of the number of establishments for 2020 CBP. Thus, businesses lost during the COVID pandemic won’t be accounted for until the 2021 CBP.
These data, and the overarching year-to-year trends, like other demographic data, can be used not only for business planning and forecasting, but also sales and marketing resource allocation.
This Macro Moment…
Via Calculated Risk, early forecasts of Q1 GDP are running slightly bearish to slightly bullish. Bank of America’s GDP is expecting +1.3% q/q saar, while Goldman, after stronger-than-expected personal spending and new home sales in January, upped their forecast to +1.8%. The Atlanta Fed’s GDPNow is way ahead of the pack at +2.7%. The official advance estimate from the BEA is due for release on April 27.
By the way, the St. Louis Fed, which maintains the essential FRED database of all sorts of economic data, launched a new “Macro Snapshot” dashboard which is
designed to provide insight into the macroeconomic data economists and policymakers at the Federal Reserve Bank of St. Louis use to analyze current economic conditions. The dashboard is powered by data series available in FRED©, our public economic data service.
It provides the latest data on GDP, employment, inflation, and the financial markets all in one place. We think it’s a great resource.


