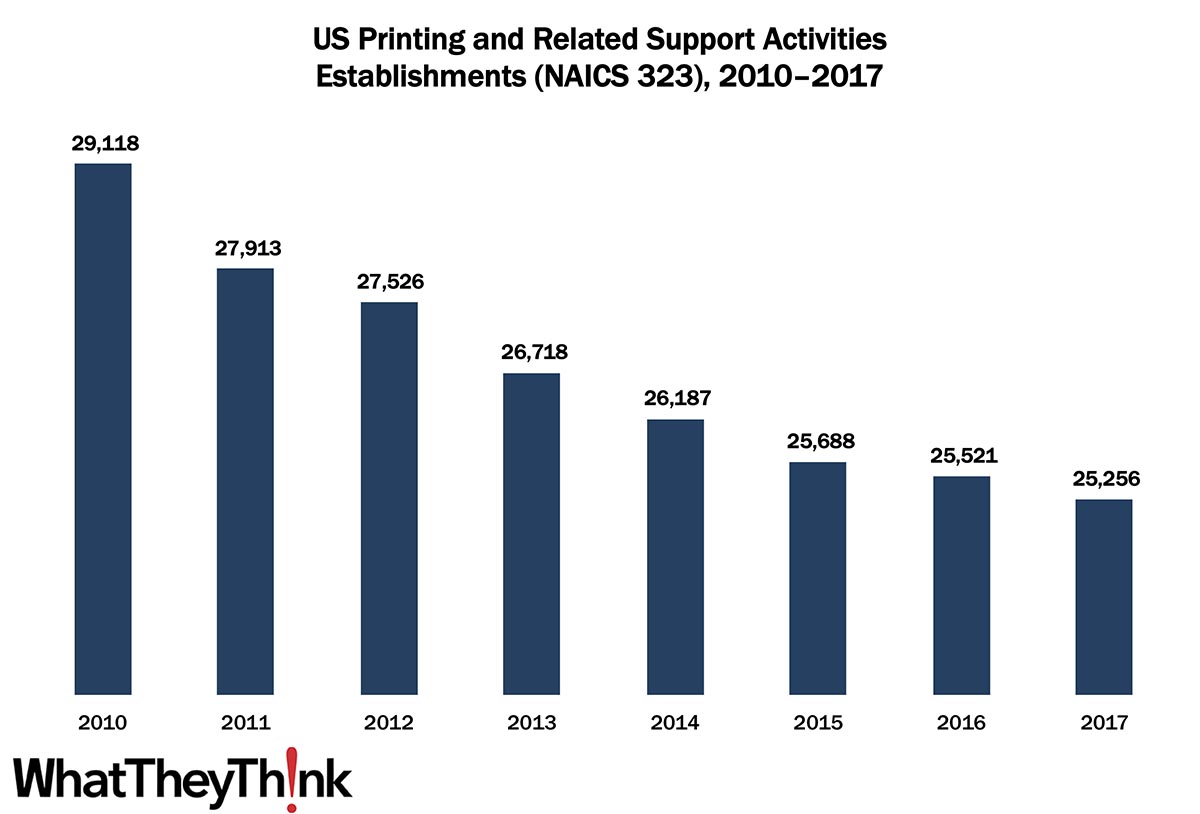
According to the latest edition of County Business Patterns, in 2017 there were 25,256 establishments in NAICS 323 (Printing and Related Support Activities). This represents a decline of 13% since the 2010s began. The biggest declines were in the early years of the decade, no surprise since we were in the midst of the Great Recession—from 2010 to 2011, establishments declined by -4%; from 2014 to 2015, the decline was only -2%; and from 2016 to 2017, the decline was -1%. Consolidation has been slowing down over the course of the decade, and from 2017 to 2024, we expect a little more consolidation at the smaller end of the industry.
What the long-term impact of the COVID-19 crisis will be on industry demographics remains to be seen, of course, especially since economists are still not certain what the overall impact on the economy will be. If things don’t return to something approaching normal by summer, we could be in for a rough period, especially if living a “virtual” existence becomes the norm.
In 2018, we began highlighting data from our Commercial Printing Establishments, which complements and supplements our regular tracking of printing industry shipments and other industry data. These counts are based on data from the Census Bureau’s County Business Patterns. Throughout this year, we will be updating these data series with the latest CBP figures. County Business Patterns includes other data, as well, such as number of employees, payroll, etc. These counts are broken down by commercial printing business classification (based on NAICS, the North American Industrial Classification System):
- 323 (Printing and Related Support Activities)
- 32311 (Printing)
- 323111 (Commercial Printing, except Screen and Books)
- 323113 (Commercial Screen Printing)
- 323117 (Books Printing)
- 32312 (Support Activities for Printing—aka prepress and postpress services)
These data, and the overarching year-to-year trends, like other demographic data, can be used not only for business planning and forecasting, but also sales and marketing resource allocation.
Every other week, we will be breaking these establishment data down in different ways. Over time, we will be adding additional data from the County Business Patterns, such as number of employees, payroll, and similar information for additional business classification of relevance to the graphic communications industry.
Next week, we will look at the latest printing shipments data—you’ll want to tune in for that as it may be the last good news we have for a while.


