The latest edition of County Business Patterns was just released, which includes 2021 data (gulp!)—meaning it reflects the businesses that were likely lost due to COVID. If you’re like us, a frisson of terror shot down your spine at the thought of this, but it doesn’t seem to be that bad.
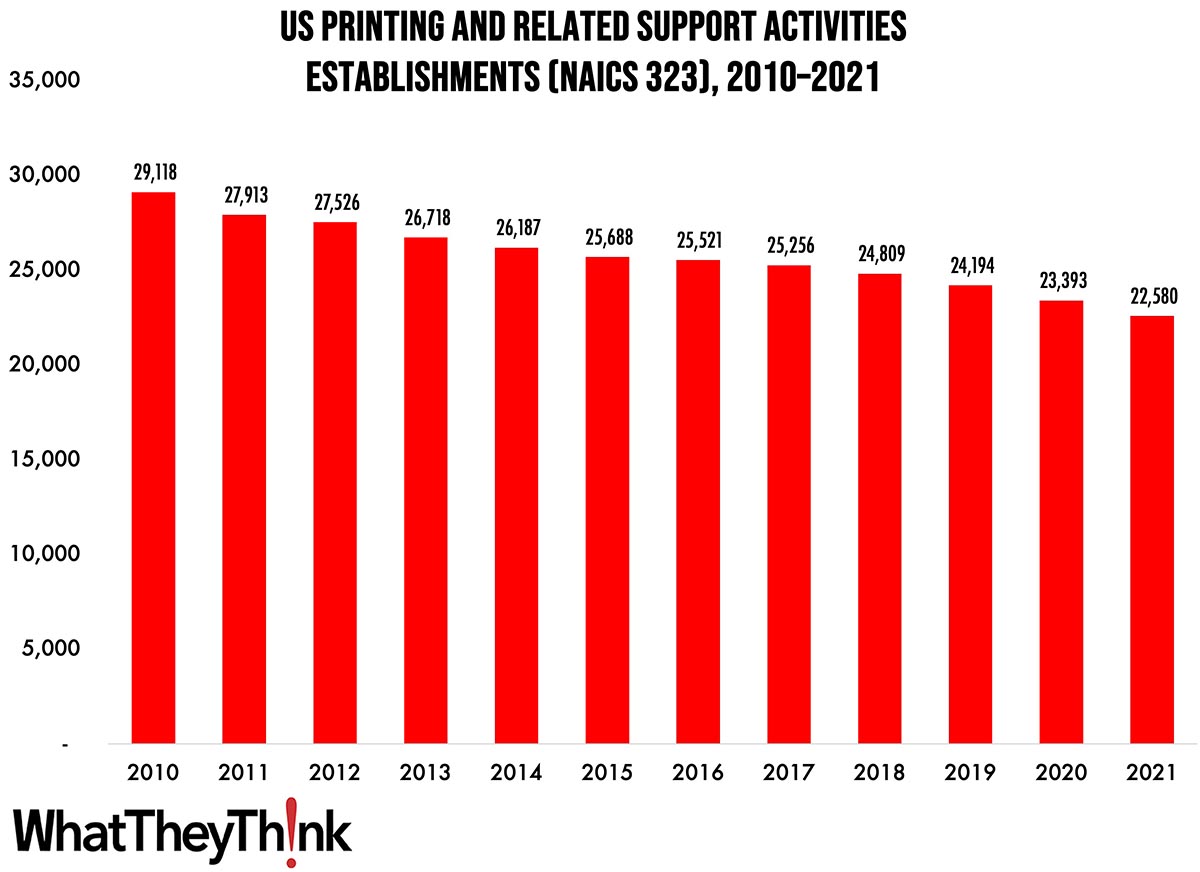
As 2021 began, there were 22,580 establishments in NAICS 323 (Printing and Related Support Activities). This represents a decline of 22% since 2010—and a 7% drop from 2019. From 2010 to 2011, establishments declined by 4%, thanks to the Great Recession, and from 2014 to 2015, the decline was only 2%; and from 2016 to 2017, the decline was 1%. Consolidation picked up toward the end of the decade, with establishments declining 6% from 2018 to 2020. And then the pandemic hit. There will probably be a bit more attrition when we get CBP 2022.
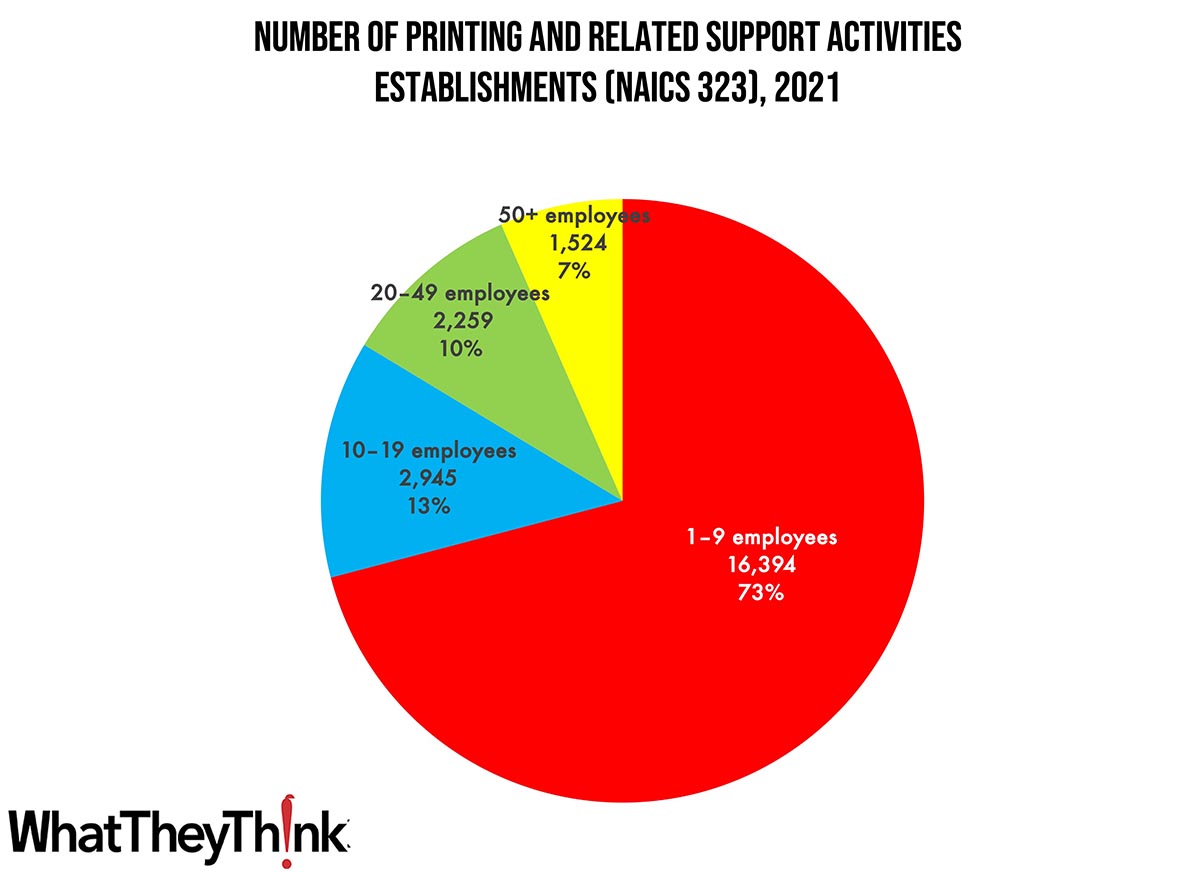
Small shops (1 to 9 employees) still comprise the bulk of the industry, accounting for 73% of all establishments. The largest shops account for only 7% of industry establishments with mid-size shops accounting for about one-fourth of establishments. These percentages have not varied substantially since at least as far back as 2010.
These counts are based on data from the Census Bureau’s County Business Patterns. As we move on, we will be updating these data series with the latest CBP figures. County Business Patterns includes other data, such as number of employees, payroll, etc. These counts are broken down by commercial printing business classification (based on NAICS, the North American Industrial Classification System):
- 32311 (Printing)
- 323111 (Commercial Printing, except Screen and Books)
- 323113 (Commercial Screen Printing)
- 323117 (Books Printing)
- 32312 (Support Activities for Printing—aka prepress and postpress services)
These data, and the overarching year-to-year trends, like other demographic data, can be used not only for business planning and forecasting, but also sales and marketing resource allocation.
This Macro Moment…
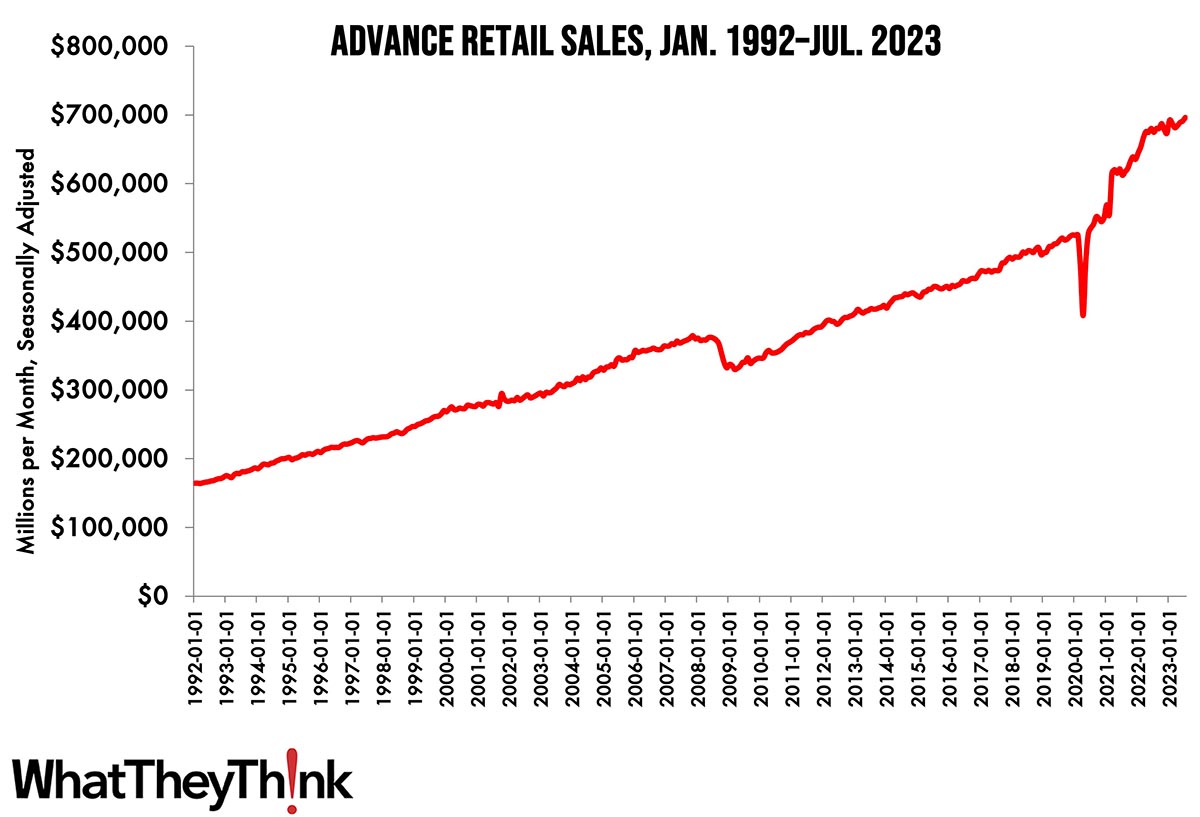
On a monthly basis, retail sales were up 0.7% from June to July (seasonally adjusted), and sales were up 3.2% from June 2022, according to the Census Bureau.
Source: Bureau of the Census
Advance estimates of U.S. retail and food services sales for July 2023, adjusted for seasonal variation and holiday and trading-day differences, but not for price changes, were $696.4 billion, up 0.7 percent from the previous month, and up 3.2 percent above July 2022. ... The May 2023 to June 2023 percent change was revised from up 0.2 percent to up 0.3 percent.
Calculated Risk adds: “Retail and Food service sales, ex-gasoline, increased by 5.6% on a YoY basis.”
The increase in sales in July was above expectations, and at the same time sales in May and June were revised up. The economy is still looking pretty good.


