Prior to the release of Q3's advance estimate of real GDP, the Atlanta Fed's GDPNow forecast was +2.1%. The official figure came in much better, at +2.9%. It is likely to be revised down slightly, but it was a much better showing than recent data.
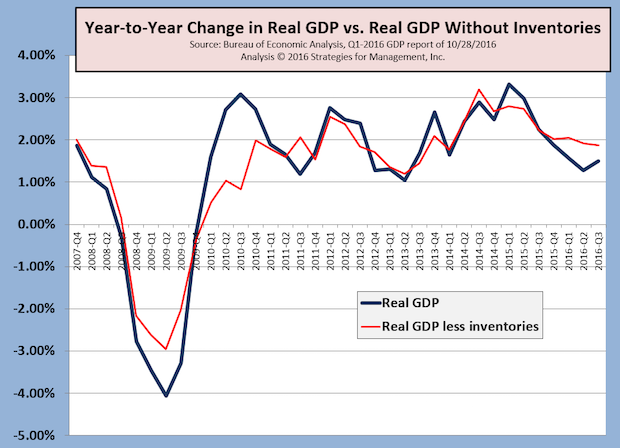
Readers know our preference for looking at real GDP on a year-to-year basis, and also without the distortion that net inventories can cause. There has been an inventory adjustment underway in recent quarters. The rise in inventories in Q3 was credited for a portion of the GDP rise. But those inventories were a meager +$12 billion on a net basis, tiny by historical standards. They were rebounding from an inventory drawdown of -$9.5 billion in the second quarter. In 2015, net inventories in each GDP report averaged +$87 billion. In 2016, they are averaging a much smaller +$14 billion. This has been a continuing story of the recovery since it began in mid-2009: managers have great difficulty forecasting demand, and frequently overestimate it. This creates excess inventories that are corrected in future quarters.
Theoretically, net inventories should be zero. Managers would have perfect understanding of demand and orders would be fulfilled immediately without inventory buffers. There would be no reason for warehouses, just for shipping departments. But the world does not work that way, as all goods and services have complex supply chains, many of them months long, and have manufacturing and transportation processes that take time. On average net inventories should be zero in the long run, but a range of plusses and minuses is natural. Expectations for increases in future demand cause inventories to rise in anticipation. That demand has not materialized to the extent that exectives planned.
While Q3 may have been a +2.9% increase compared to Q2, the longer term growth rates are +1.86% without inventories and +1.50% with inventories. The economy has been slowing in the last six quarters.
Peculiar to the +2.9% Q3 growth rate was a very large rise in soybean exports. Yes, it is easy to forget that the US is an agricultural powerhouse and farming is a key aspect of the economy. Those soybeans represented $38 billion of a $41 billion increase in exports. That made them 0.9 percentage points of the increase in GDP, or about a third of the rise. How did that happen? US farmers took up the slack in world soybean markets because major exporters Brazil and Argentina had poor harvests. This might be a one-time event, but most every GDP report has one-time events; this one was notably large. Factoring the soybean boomlet out shows the US is still a +2% economy, remaining well below historical trends.
* * *
Durable goods orders excluding transportation is negative for 21 consecutive months with the latest release. It was down -2.7% in September.
In real terms, GDP's much broader category of fixed domestic investment (The “I” in the GDP bookkeeping formula of C+I+G+(X-M) was down for a third quarter, also at -2.7% for Q3. For the three quarters of 2016, it is averaging -2.1%.
This part of the economy is weakening; it has been balanced by consumer spending, which is running in the +2.5% range. Investment, however is what increases productivity and then increases consumer incomes, but those effects are usually not seen for many quarters ahead.


