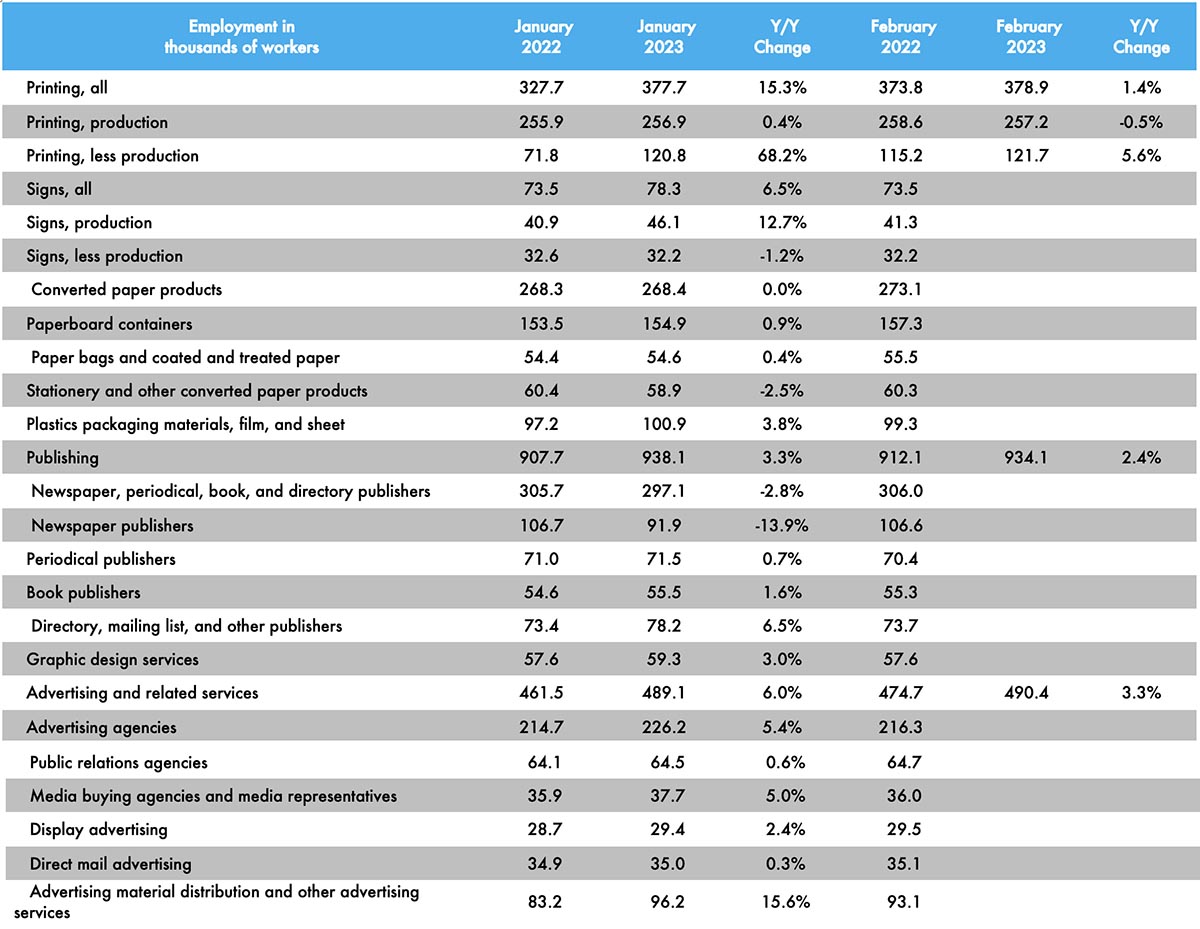
Last month, we saw that overall printing employment in January 2023 had been down 1.7% from December, with that due entirely to a -4.2% drop in production employment. Things flattened out in February, with overall printing employment up a scant 0.3%. The production/non-production mix remains the same, with the former up only 0.1% and the latter up 0.7%. (For those who have asked, the Bureau of Labor Statistics doesn’t drill very far down into these classifications—they identify only “All Employees” and “Production and Nonsupervisory” so, historically, we have backed out production and nonsupervisory from all employees to get “non-production employees.” It’s a bit of a blunt instrument approach, but it’s the best we can do with the data resources we have available. Would that we had more…)
Anyway, overall publishing employment was down -0.4% from January to February, while advertising and related services were up 0.3%.
Last month, we started adding a number of other business categories to our employment table, the reporting of which, as you may recall from our tracking of the publishing and creative markets, lags a month.
For example, overall employment in the signage industry was down -0.9% from December to January, with sign production employment down -1.7%.
Converted paper products employment was down -0.7% from December to January, with paperboard container employment down -1.2% and paper bags and coated and treated paper employment up 0.4%.
Looking at some specific publishing and creative segments, from December 2022 to January 2023, periodical publishing employment was down -1.0%, while newspaper publishing employment was down -1.6% and book publishing down -0.9%. Graphic design employment was down -3.3%, ad agency employment was down -0.1%, and PR agencies were down -2.4%. Direct mail advertising employment was down -3.0%.
Last month’s table is here, if you want to compare some of the other segments we track.
As for February employment in general, the BLS reported on March 10 that total nonfarm payroll employment increased by 311,000 in February, and the unemployment rate ticked up to 3.6%. Meanwhile, December employment was revised down by 21,000 and January employment was revised down by 13,000, for a total downward revision of 34,000.
The U-6 rate (the so-called “real” unemployment rate which includes not just those currently unemployed but also those who are underemployed, marginally attached to the workforce, and have given up looking for work) ticked up from 6.6% to 6.8%.
The labor force participation rate ticked up from 62.4% in January to 62.5% in February, and the employment-to-population ratio was unchanged at 60.2%. The labor force participation rate for 24–54-year-olds also ticked up from 82.7% to 83.1%.
Although not a dynamite employment report, it was still generally above expectations. We are still digging into the data from the March employment report, so stay tuned…


