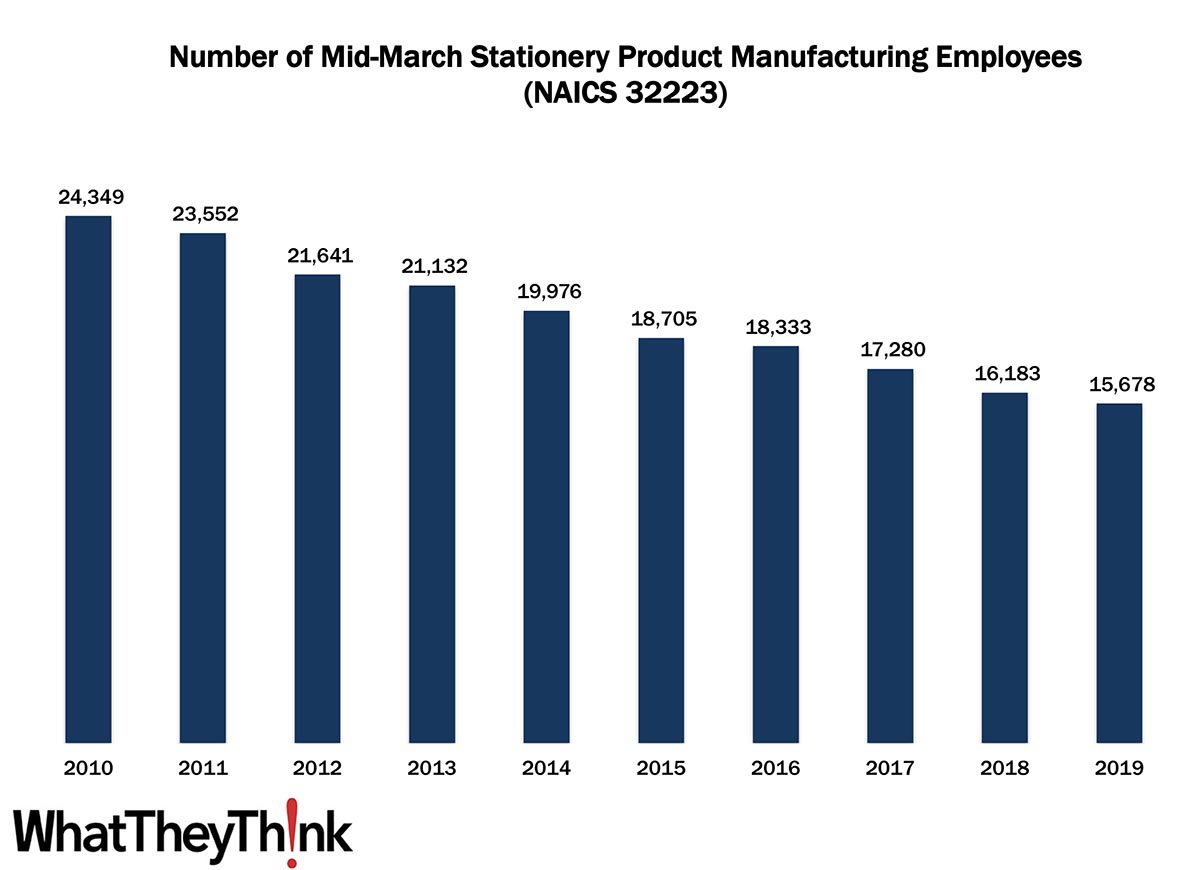
According to County Business Patterns, in 2010, there were 24,349 employees in NAICS 32223 (Stationery Product Manufacturing establishments). It’s been downhill for the rest of the decade, with this NAICS category bottoming out (so far) at 15,678 employees in 2019.
The Bureau of the Census definition for this business classification:
This industry comprises establishments primarily engaged in converting paper or paperboard into products used for writing, filing, art work, and similar applications.
Although establishments in this category have been declining as well, it was around the time of the last few data points (circa 2016) that industry watchers had been noting a renewed interest in stationery and related products. Said Stationery Trends magazine in 2016: “There is a strong resurgence in consumers’ passion for stationery and specialty paper products. From journals to cards to prints, the written word and personal sentiments are returning stronger than ever—and in new ways.” Traditional print greeting cards remain fairly strong (a common theme of them has been ‘I got you a real card’) while LEDs, audio, and other electronic/rich media elements have made their way into printed greeting cards. The Greeting Card Association also tracked a heightened interest in hand-lettered greeting cards, unique shapes, foils, and other special effects.
Journals with unique uses also stand out, from blank journals, to travel diaries, self-exploration journals, and journals that track family memories have been trending subjects. For fitness buffs, “workout diaries” (“WODBooks”) are also popular items. The classic Moleskine notebook had a resurgence mid-decade and pictures of note-filled Moleskines are shared on social media. Christmas and other holiday cards are increasingly customized/personalized, featuring the sender’s family and printed via digital print services such as Shutterfly. “Hand-crafted,” often using letterpress, is often the operative term in much of this product category, although many of these “makers” may not be reflected in Census data, as they tend to be individual artisans or hobbyists. Although these data points are a few years old, it will be interesting to see in a few years what the pandemic and forced lockdowns have done to demand for these kinds of items.
Over time, we will be adding additional data from County Business Patterns, such as number of employees, payroll, and similar information for additional business classification of relevance to the graphic communications industry.
The 3222 four-digit NAICS comprises a variety of different converted packaging types, and over the next several months, we will continue looking at them in turn, including:
- 32229 Other Converted Paper Product Manufacturing
- 322291 Sanitary Paper Product Manufacturing
- 322299 All Other Converted Paper Product Manufacturing
This Macro Media Moment
Last week, BoSacks tweeted an old chart, one of Dr. Joe Webb’s greatest hits:
New Research Charts How Digital News Consumption Eclipsed Traditional Channels
— BoSacks (@BoSacks) November 12, 2021
65% of respondents said they rarely or never get their news from printhttps://t.co/ZskGHDUVS0 pic.twitter.com/UXL7n40RiW
Bo wrote:
It shows the penetration rate of newspapers per household. As you can see in 1960 there were 1.1 newspapers per household in the US. By 1995 and the very early stages of the internet the household penetration rate was down to 0.6. And at the end of this old chart in 2008 the penetration rate was 0.4. Today I’m sure it is much worse, but I don’t have the data.
But we do! And it is much worse: we are down to about 0.2 newspapers per household. That’s barely even the sports page.
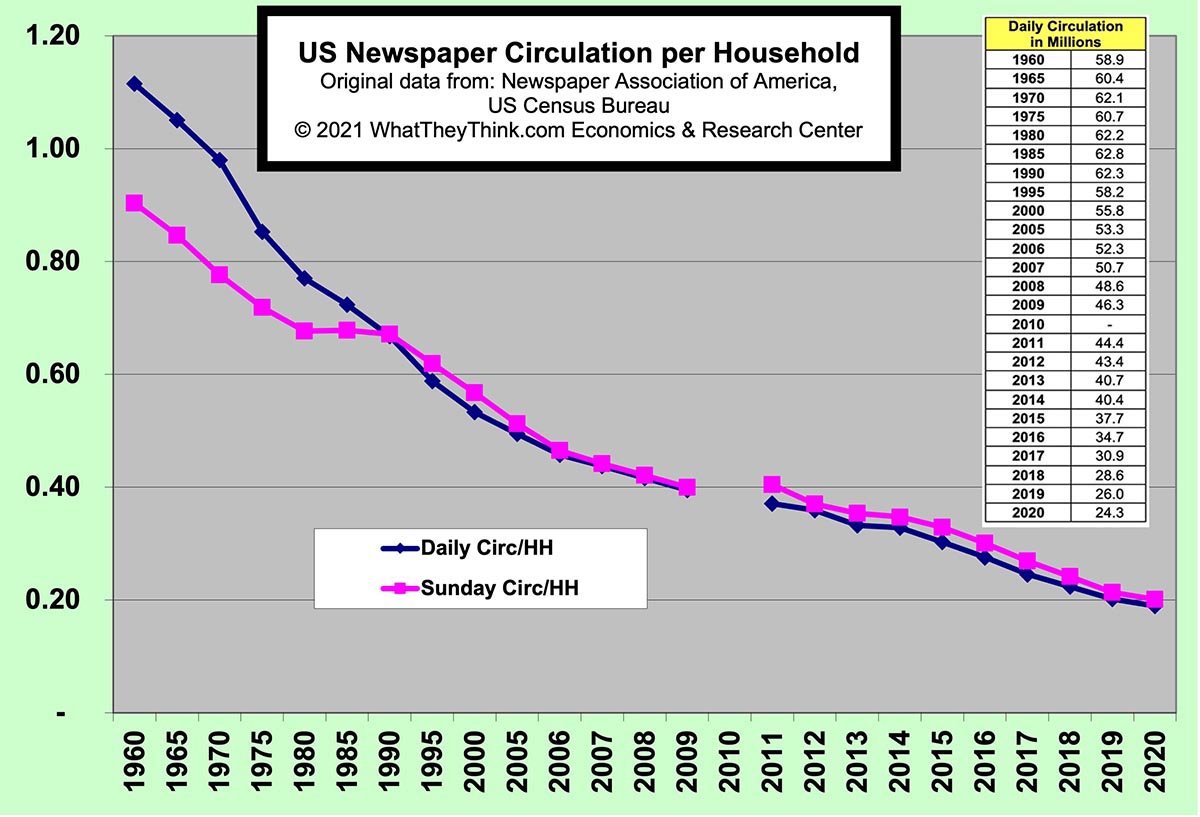
(This is Throwback Friday, so we used Dr. Joe’s same old chart format.)
Anyway, Bo adds, “newspapers’ circulation in the home has been in freefall for 61 years.” You can’t really blame the Internet on the decline of newspapers; that started in the 1960s, but the real decline in circulation began with the advent of cable television, CNN, and 24-hour cable news. All things must pass.
(And, no, we can’t explain the data gap in 2010.)


