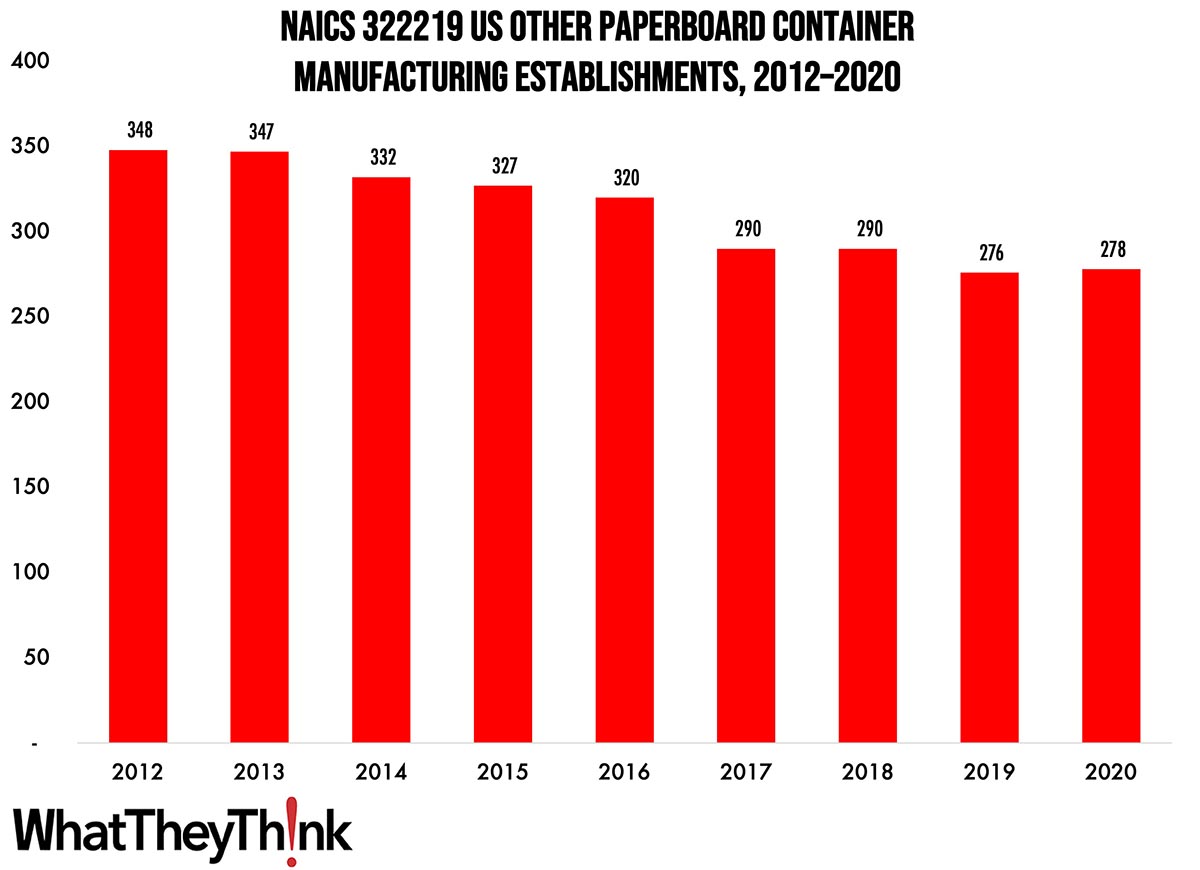
In our ongoing, semi-weekly look at establishment and employee counts of graphic arts businesses, we have been looking at packaging/paper converting establishments. In 2012, there were 348 establishments in NAICS 322219 (Other Paperboard Container Manufacturing), and by 2020, that number had declined to 278, a drop of -20%.
The Bureau of the Census definition for this business classification:
This U.S. industry comprises establishments primarily engaged in converting paperboard into paperboard containers (except corrugated, solid fiber, and folding paperboard boxes) without manufacturing paperboard.
As you may have guessed, this is a catchall category that rounds up all the businesses that don’t fit into 32221 (Paperboard Container Manufacturing). This NAICS was created in 2012 after the 2012 Economic Census, and was used to round up discontinued subcategories, such as setup paperboard box manufacturing; fiber can, tube, drum, and similar products manufacturing; and nonfolding sanitary food container manufacturing. Some of the products that are produced by establishments in this NAICS include fiber cans and drums (i.e., all-fiber, non-fiber ends of any material) made from purchased paperboard, milk cartons, sanitary food containers, and other forms of liquid packaging, such as that used to hold water, soft drinks, dairy products, and fruit juices.
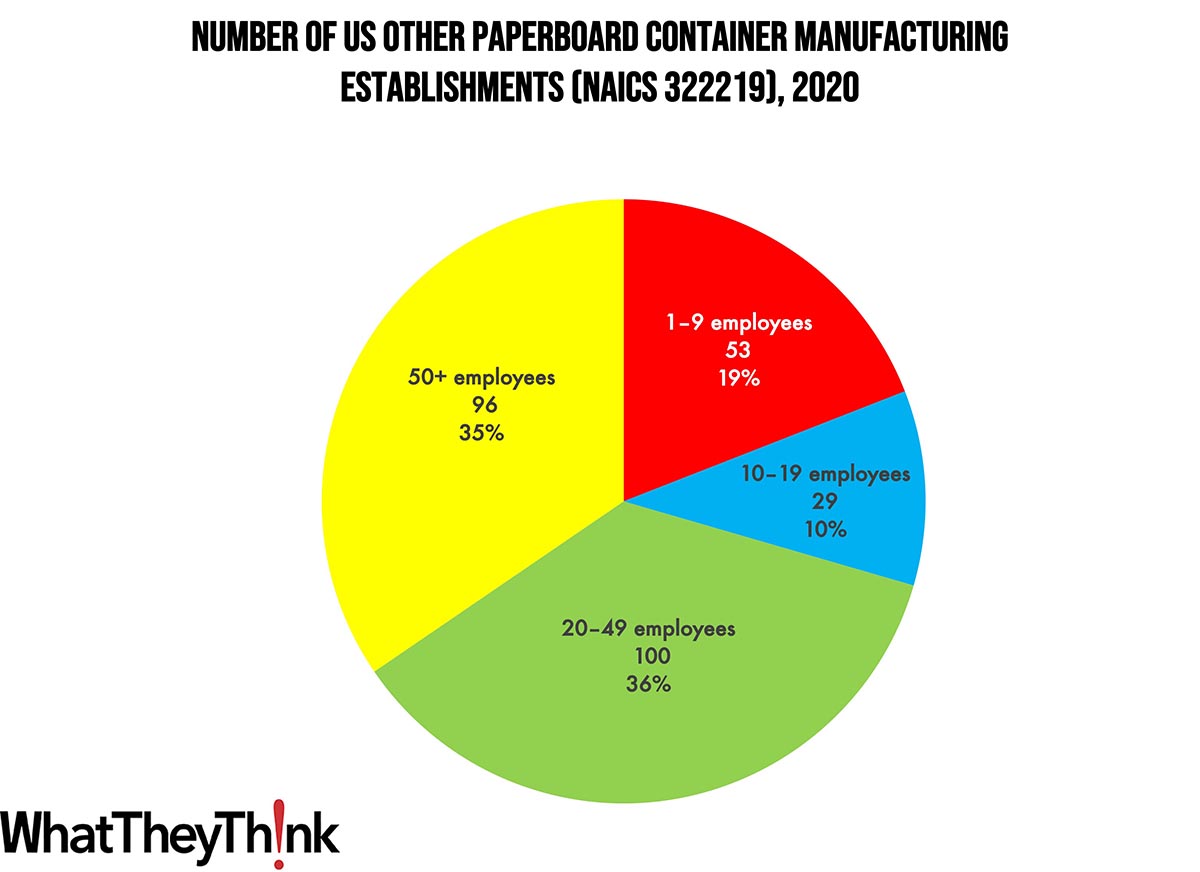
Establishments in this category are larger than we usually see in the printing and publishing industries. Small paperboard container manufacturers (1 to 9 employees) account for 19% of all establishments, while large manufacturers (50+ employees) account for 35% of establishments. Mid-size establishments account for 46%.
These counts are based on data from the Census Bureau’s County Business Patterns. Every other week, we update these data series with the latest figures. These counts are broken down by printing business classification (based on NAICS, the North American Industrial Classification System).
Next up, we’ll continue through the converting NAICS categories:
- 32222 Paper Bag and Coated and Treated Paper Manufacturing
- 32223 Stationery Product Manufacturing
- 32229 Other Converted Paper Product Manufacturing
- 322291 Sanitary Paper Product Manufacturing
- 322299 All Other Converted Paper Product Manufacturing
To clarify what is included in the 2020 CBP, establishment counts represent the number of locations with paid employees at any time during the year. If an establishment existed at any point during the year, it would be included in the CBP count of the number of establishments for 2020 CBP. Thus, businesses lost during the COVID pandemic won’t be accounted for until the 2021 CBP.
These data, and the overarching year-to-year trends, like other demographic data, can be used not only for business planning and forecasting, but also sales and marketing resource allocation.
This Macro Moment…
On Wednesday, the Bureau of Labor Statistics released the CPI for April:
The Consumer Price Index for All Urban Consumers (CPI-U) rose 0.4 percent in April on a seasonally adjusted basis, after increasing 0.1 percent in March, the U.S. Bureau of Labor Statistics reported today. Over the last 12 months, the all items index increased 4.9 percent before seasonal adjustment.
The index for shelter was the largest contributor to the monthly all items increase, followed by increases in the index for used cars and trucks and the index for gasoline. The increase in the gasoline index more than offset declines in other energy component indexes, and the energy index rose 0.6 percent in April. The food index was unchanged in April, as it was in March. The index for food at home fell 0.2 percent over the month while the index for food away from home rose 0.4 percent.
The index for all items less food and energy rose 0.4 percent in April, as it did in March. Indexes which increased in April include shelter, used cars and trucks, motor vehicle insurance, recreation, household furnishings and operations, and personal care. The index for airline fares and the index for new vehicles were among those that decreased over the month.
The all items index increased 4.9 percent for the 12 months ending April; this was the smallest 12-month increase since the period ending April 2021. The all items less food and energy index rose 5.5 percent over the last 12 months. The energy index decreased 5.1 percent for the 12 months ending April, and the food index increased 7.7 percent over the last year.
CPI was better than expected while core CPI was slightly worse than expectations.


