The full results on turnover (revenues) in the printing industry in Europe for 2020 were published late in 2022—after index data was the only source for print volume developments during the pandemic. While the index data only allowed for volume developments, now real turnover data is available, even if the data is far from perfect.
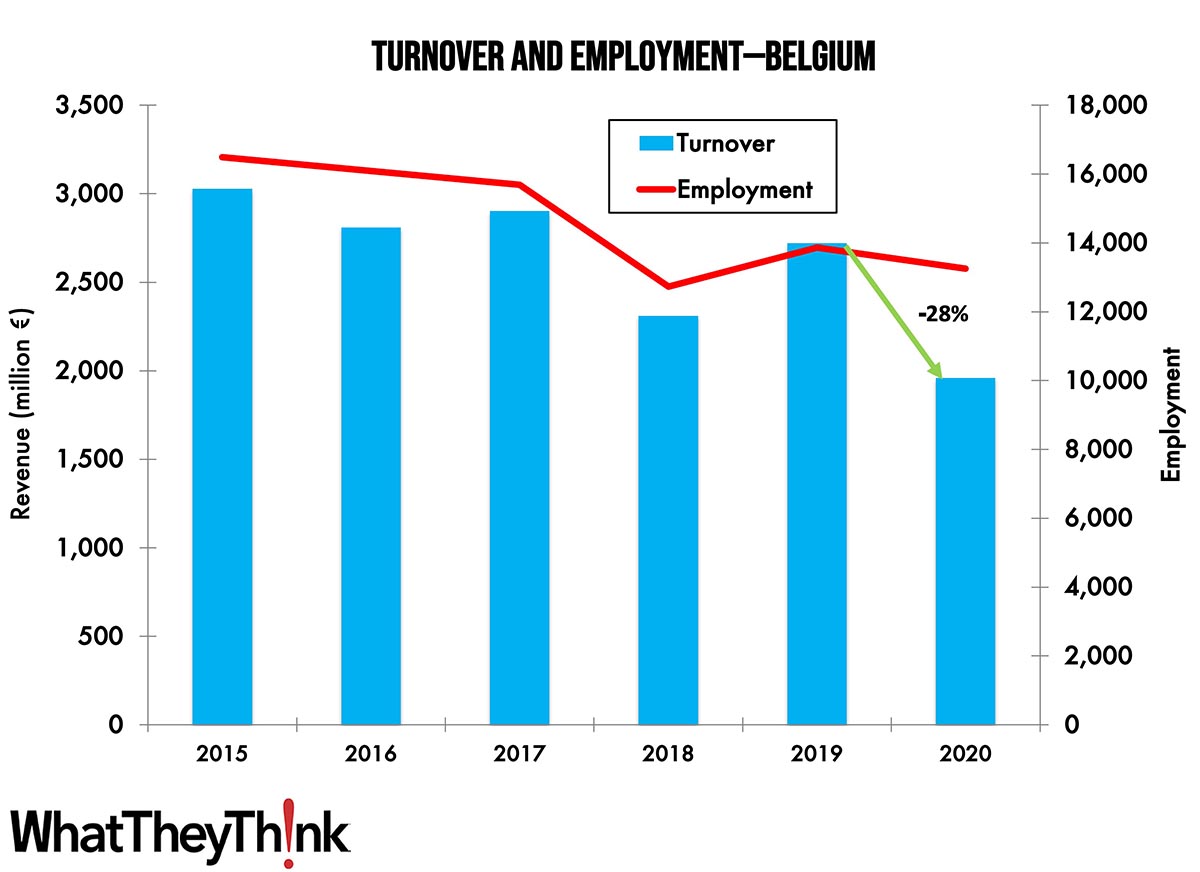
The turnover for commercial printing in Belgium experienced quite some fluctuations in recent years according to the Eurostat data. It is possible that some changes in the data collection led to the trough in 2018. Not accounting for the fluctuations, the turnover declined from just over €3 billion in 2015 to €2.7 billion in 2019, representing an average annual decline of 2.1%. 2020 brought a steep decline of 28% due to the pandemic, with a turnover of just under €2 billion. The decline is much bigger than the anticipated range of 10 to 15% based on the earlier production volume index data and could hint some more statistical fluctuations.
The number of persons employed showed a decline following somewhat the historical turnover developments. Overall employment had an average annual decline of 3.4% from 2015 to 2019, signifying the productivity gains achieved. Given that rate, the 4.4% decline in 2020 is within the average range and far lower than the drop in turnover.
Source: Eurostat 2022 and digitalprintexpert.de
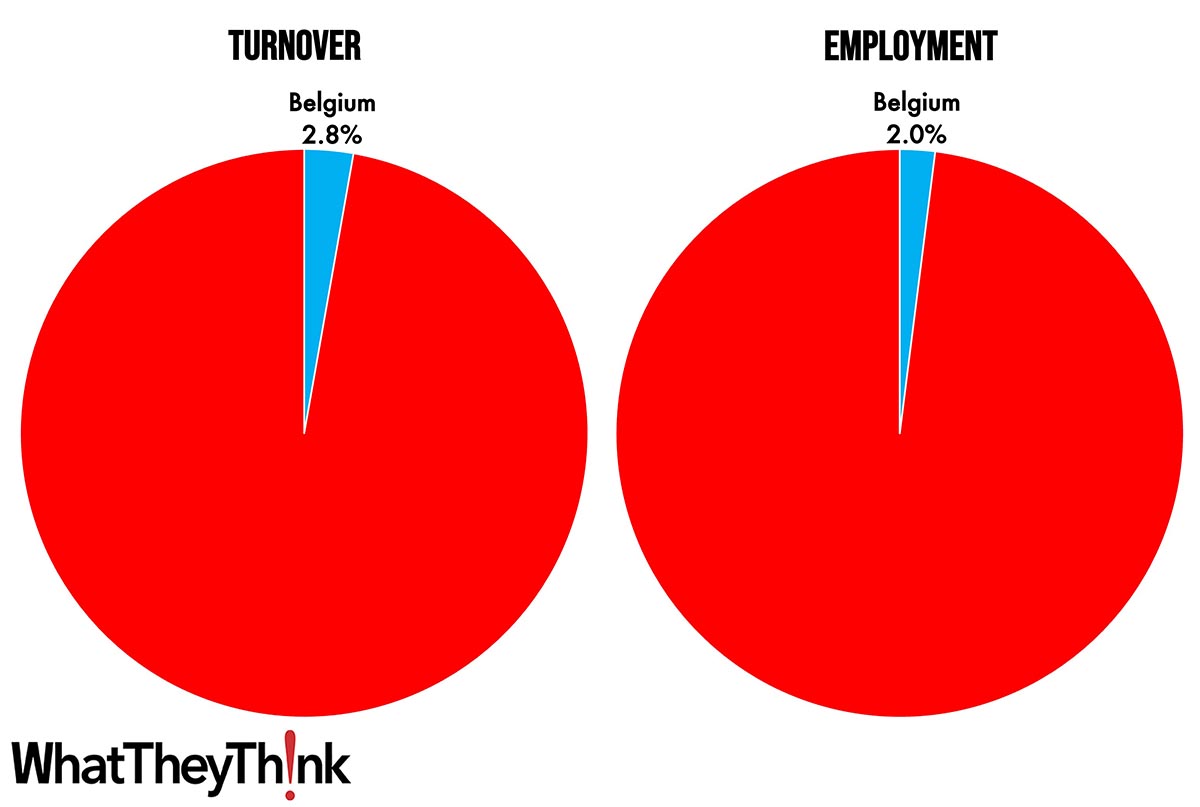
Overall, the printing industry in Belgium accounts for 2.8% of the total European printing industry, falling between Switzerland and Austria. In terms of the number of employees in print, the European share of Belgium is noticeably smaller at 2.0%.
Source: Eurostat 2022 and digitalprintexpert.de
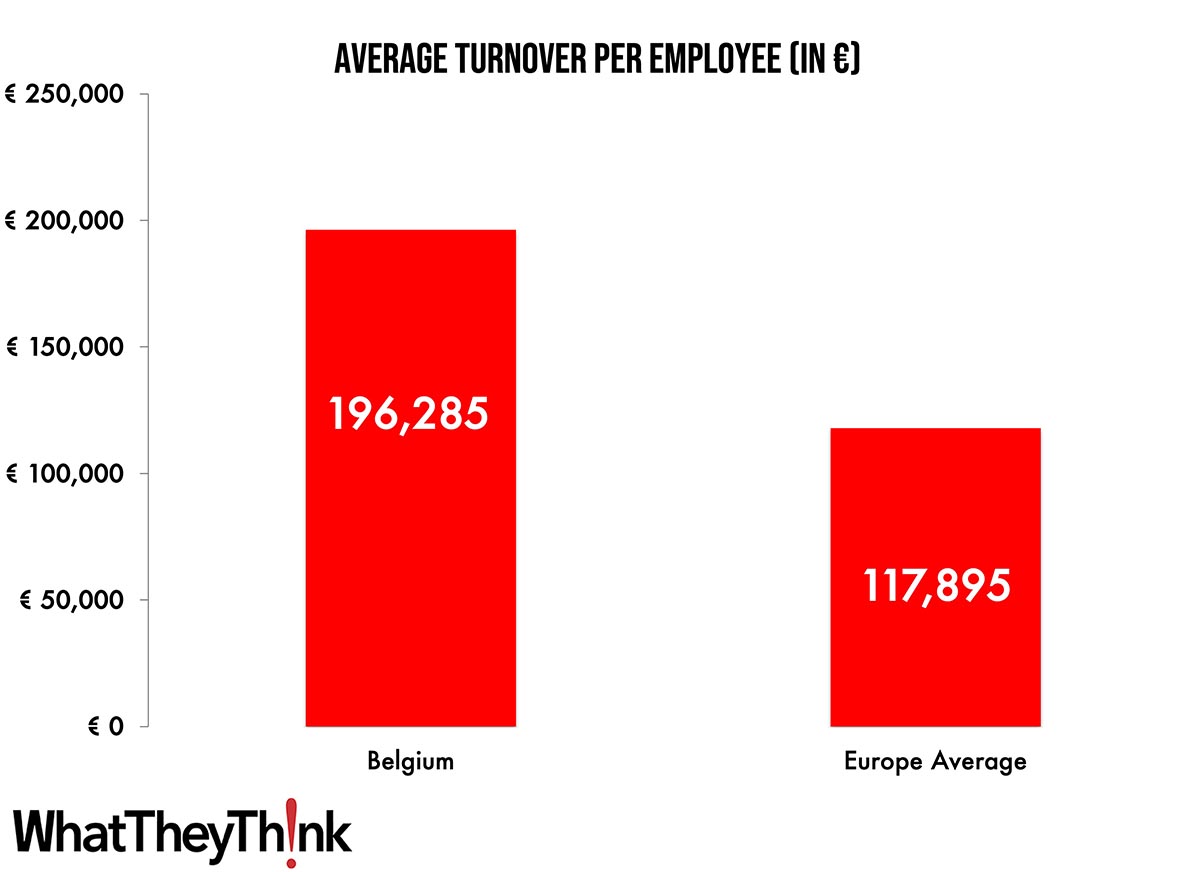
Based on Eurostat numbers for turnover and the number of employees in the printing industry, the average annual turnover per employee can be calculated. The €196,285 for 2019 is much higher than the European average. It surpasses neighboring Netherlands and the Nordic countries. Only Switzerland has a similar employee-to-turnover ratio. The employment number does include part-time employees and owners with a salary. The year 2019 has been chosen for the comparison as 2020 could have been impacted by the COVID-19 pandemic and the differing speed the labor markets reacted.
Source: Eurostat 2022 and digitalprintexpert.de
Please keep in mind that the data is based on Eurostat numbers for printing and related services (complemented by some estimates), which consists mainly of commercial and publishing printing, including prepress and finishing companies. That means that packaging, data center, direct mail print, or quick print/copy shops are not included or only on a limited basis. I- house print/CRD are not included at all. Europe as used in the series of articles includes the EU countries plus Norway, Switzerland, and the UK. If you have questions about sizing the European printing industry or need clarification, please contact me at [email protected] .
This series on the turnover and employment development in commercial print in Europe will be continued. Next time we will have a look at the printing industry in Sweden.


