The national employment data may have had a headline of +227,000 payroll jobs, but the household survey did not indicate the same. Every year, the report released in February includes revisions to the prior year. The press release from the Bureau of Labor Statistics said that employment was “little changed.”
Remember, the payroll report counts workers for whom establishments must pay payroll tax (since it’s tax time, call those workers “W-2” workers), which means that workers with two employers are counted twice. Self-employed workers are not included in their counts. The household survey takes care of both problems, and that is the report from which the unemployment rate is calculated.
The household survey was basically unchanged and the unemployment rate budged only slightly. You have to see the difference in a few decimal places. In December, the rate was 4.7162%, and January’s rate was 4.7804%. The difference in percentage points? A mere 0.0641%, which is why the BLS used the phrase “little changed.”
Then there’s the corrections they made because the BLS models were overestimating important parts of their labor force calculations. This is actually the more important part of the report: they were overestimating “civilian noninstitutional population” by 831,000, the civilian labor force by 508,000, employment by 487,000, and the unemploymed by 21,000. And, the number of persons not in the labor force was lowered by 323,000. Whoops! That’s just part of statistical life.
These are not big on a percentage basis, but on an absolute basis some of these numbers are bigger than entire industries. The employment miss is more than that of the entire commercial printing industry; the labor force miss is a little less than the state of Rhode Island. But then again, maybe not… a jump in payrolls of +227,000 that was in the report was about equal to half of the employment miss. It means that they were overestimating employment gains by 40,000 per month. The percentage may be small, but in absolute terms it’s still a big deal.
The fact that all their corrections were downward implies that personal income numbers will be revised down for 2016, as will 2016 GDP, and perhaps other important data series.
* * *
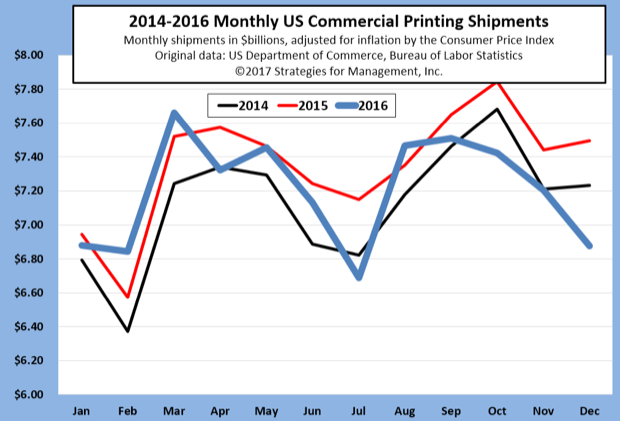
US commercial printing shipments had a very rough December. Shipments in current dollars were $6.875 billion, down -5.8% from December 2015. On an inflation-adjusted basis they were down -8.3%. The year was down -0.7% in current dollars ($85.4 billion) and -2.0% in inflation-adjusted dollars ($86.4 billion).
The chart shows the divergence that started to occur in the second quarter, where 2016 inflation-adjusted shipments were at levels somewhat between 2014 and 2015 levels, then falling to below both years later.
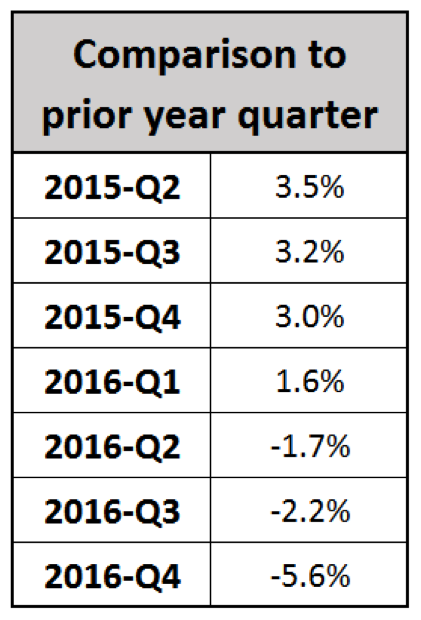
The pattern looks a little more disturbing on a quarterly basis compared to the prior year. The year-to-year comparison was last strong in the second quarter of 2015, and the growth rate has been sliding since.
There will be more details in Mondays with Dr. Joe next week, February 13.
Printing shipments will be revised and released on May 18, 2017. The revisions usually go back three years, with very small additional revisions to seasonality two to five additional years.


