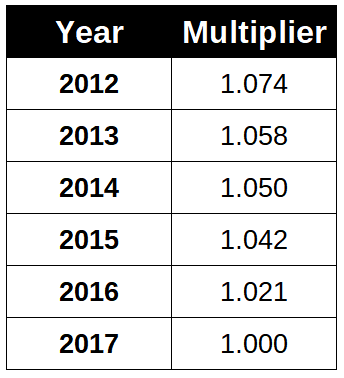
Inflation distorts our interpretation of history and clouds business decisions. All dollars may look alike, but what a dollar bought in 1950 is a lot different than a dollar in 2017. This chart is based on the Consumer Price Index, calculated for the December comparison to the prior year. The CPI are the dollars in your pocket that you and your fellow employees spend in the marketplace. Unfortunately, commercial printing prices have not kept up with inflation, but the costs of running a printing business usually have. This means that it’s harder to keep earnings and payrolls up to this level. If past dollars had greater value, this chart can be used to adjust past financial statements to bring those data to current value. This is especially important in budgeting processes where looking for trends in prior years is one way of assessing performance and goals.


