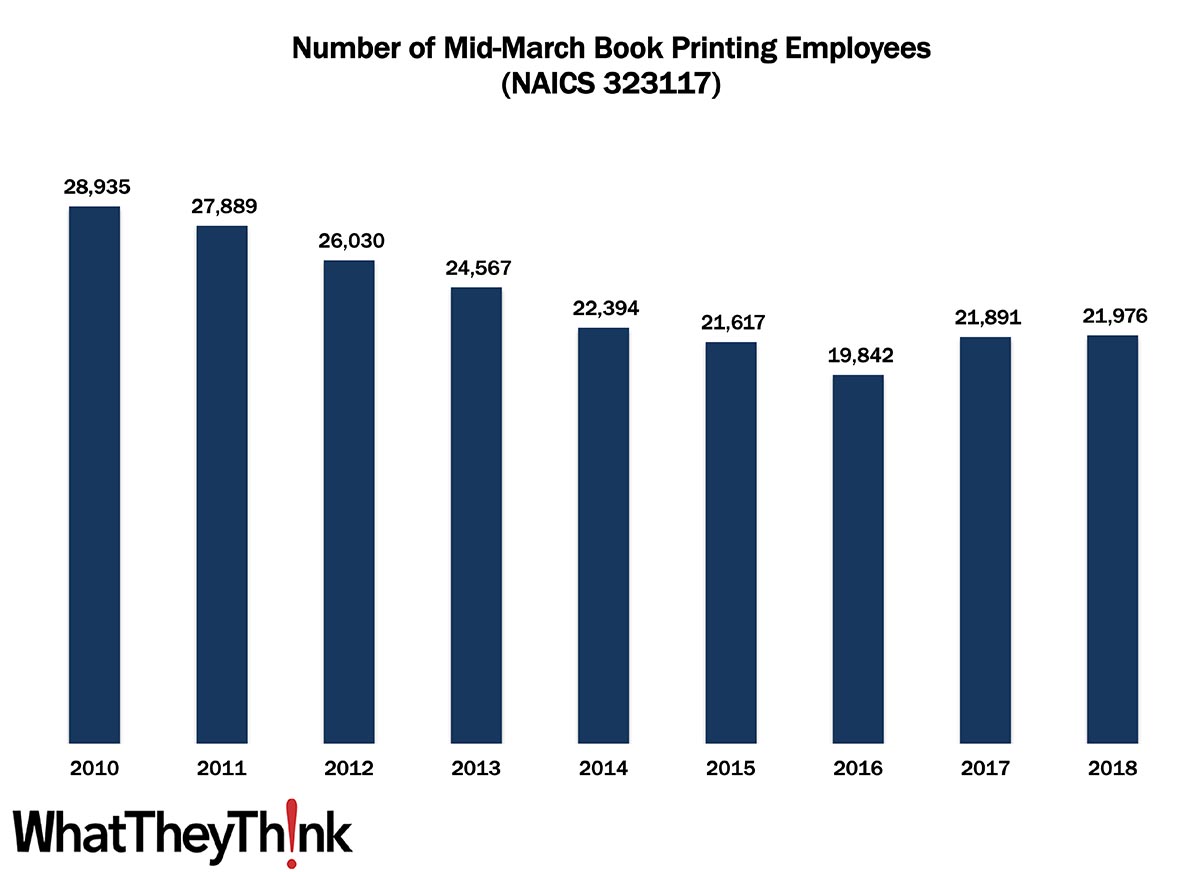
In 2010, there were 28,935 employees in U.S. book printing establishments (NAICS 323117), a count which had declined to 21,976 by 2018, despite a brief upward spurt in 2017. As we saw with establishments, book printing employees are also up in 2018 from 2017. The ebbing and flowing in this business category reflect the old story of consolidation as well as the results of both shop diversification and specialization. Today’s equipment (production inkjet in particular) can produce a variety of print products, so shops don’t have to stick to any one particular niche the way they used to. So some quantity of “book printers” may not consider themselves just book printers, and thus they classify as general commercial printers or some other business classification that better describes the business. It also goes in the other direction: books have remained a perennially popular print product (this data series predates COVID, so it will interesting to revisit these numbers in a few years), and as more book production moves to the digital on-demand variety, it can be a significant niche to pursue all on its own. Books also lend themselves to more dedicated workflows (highly integrated text printing, cover printing, binding, shipping) so it often makes sense to dedicate production solely to books, especially if the volume is there.
These counts are based on data from the Census Bureau’s County Business Patterns. Every other week, we update these data series with the latest figures. These counts are broken down by printing business classification (based on NAICS, the North American Industrial Classification System). Next up, we will be looking at employment in:
- 32312 (Support Activities for Printing—aka prepress and postpress services)
These data, and the overarching year-to-year trends, like other demographic data, can be used not only for business planning and forecasting, but also sales and marketing resource allocation.
This Macro Moment
The Bureau of Labor Statistics released the Consumer Price Index (CPI) for February:
The Consumer Price Index for All Urban Consumers (CPI-U) increased 0.4 percent in February on a seasonally adjusted basis after rising 0.3 percent in January, the U.S. Bureau of Labor Statistics reported today. Over the last 12 months, the all items index increased 1.7 percent before seasonal adjustment.
The gasoline index continued to increase, rising 6.4 percent in February and accounting for over half of the seasonally adjusted increase in the all items index. The electricity and natural gas indexes also increased, and the energy index rose 3.9 percent over the month. The food index rose 0.2 percent in February, with the index for food at home and the index for food away from home both rising.
The index for all items less food and energy rose 0.1 percent in February. The indexes for shelter, recreation, medical care, and motor vehicle insurance all increased over the month. The indexes for airline fares, used cars and trucks, and apparel all declined in February.
The all items index rose 1.7 percent for the 12 months ending February, a larger increase than the 1.4-percent reported for the period ending in January. The index for all items less food and energy rose 1.3 percent over the last 12 months, a smaller increase than the 1.4-percent rise for the 12 months ending January. The food index rose 3.6 percent over the last 12 months, while the energy index increased 2.4 percent over that period.
“Headline CPI,” the number we use when we “adjust for inflation,” is up 1.7% from last February, and while it has been rising slightly, that was mostly due to rebounding from the dive it took when the pandemic began. (If you remember buying gas last April you know how low gas prices got once lockdowns began.)
Core CPI—the measure that the Fed is most concerned with, as it excludes food and energy, which can be volatile—is up 1.3% and has been declining. So this is a bit of good news.


