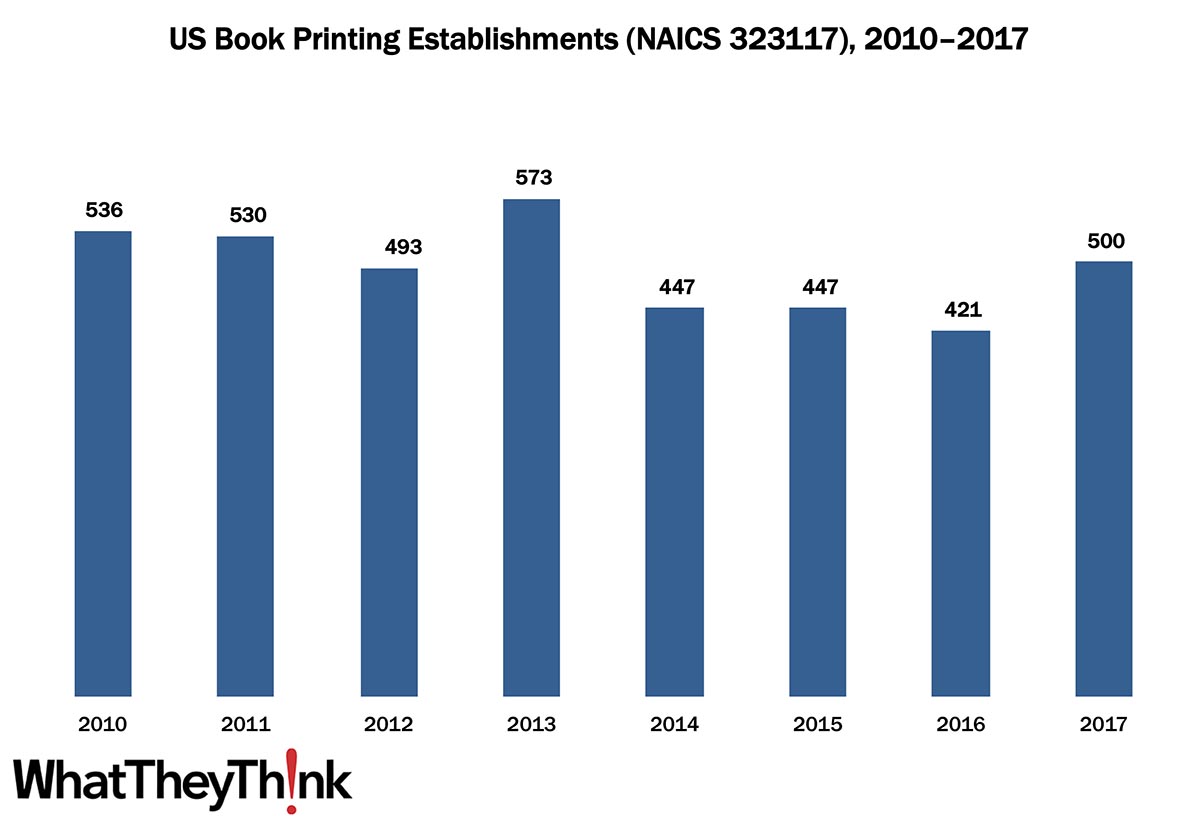
In 2010, there were 536 U.S. book printing establishments (NAICS 323117), a count which had declined to 500 (-6.7%) by 2017, despite a brief upward spurt in 2013. Book printers are also up from 2016. The establishment ebbing and flowing in this business category reflects the old story of consolidation as well as the results of both shop diversification and specialization. Today’s equipment (production inkjet in particular) can produce a variety of print products, so shops don’t have to stick to any one particular niche the way they used to. So some quantity of “book printers” may not consider themselves just book printers, and thus they classify as general commercial printers or some other business classification that better describes the business. It also goes in the other direction: books have remained a perennially popular print product, and as more book production moves to the digital on-demand variety, it can be a significant niche to pursue all on its own. Books also lend themselves to more dedicated workflows (highly integrated text printing, cover printing, binding, shipping) so it often makes sense to dedicate production solely to books, especially if the volume is there.
In 2018, we began highlighting data from our Commercial Printing Establishments, which complements and supplements our regular tracking of printing industry shipments and other industry data. These counts are based on data from the Census Bureau’s County Business Patterns. Throughout this year, we will be updating these data series with the latest CBPfigures. County Business Patterns includes other data, as well, such as number of employees, payroll, etc. These counts are broken down by commercial printing business classification (based on NAICS, the North American Industrial Classification System):
- 323 (Printing and Related Support Activities)
- 32311 (Printing)
- 323111 (Commercial Printing, except Screen and Books)
- 323113 (Commercial Screen Printing)
- 323117 (Books Printing)
- 32312 (Support Activities for Printing—aka prepress and postpress services)
These data, and the overarching year-to-year trends, like other demographic data, can be used not only for business planning and forecasting, but also sales and marketing resource allocation.
Every other week, we will be breaking these establishment data down in different ways. Over time, we will be adding additional data from County Business Patterns, such as number of employees, payroll, and similar information for additional business classification of relevance to the graphic communications industry.
This Macro Moment
In other data news, Wednesday saw the Bureau of Economic Analysis release GDP growth for the first quarter of 2020. It had been forecast to be in the -4–5% range, and sho’ ’nuff, it came in at -4.8%. But that raises a question as to why it was as bad as that. Sure, March lasted 5,000 years, but the COVID-19-related business shutdowns didn’t start until mid-March—only two or three weeks before the end of Q1. Sure, those two or three weeks wrought havoc upon the economy, but enough to drag down the entire quarter? Or were global supply chain issues (such as from China and other early-impacted countries) causing trouble as early as late January or February? Or perhaps the US economy was headed somewhat recession-ward anyway?
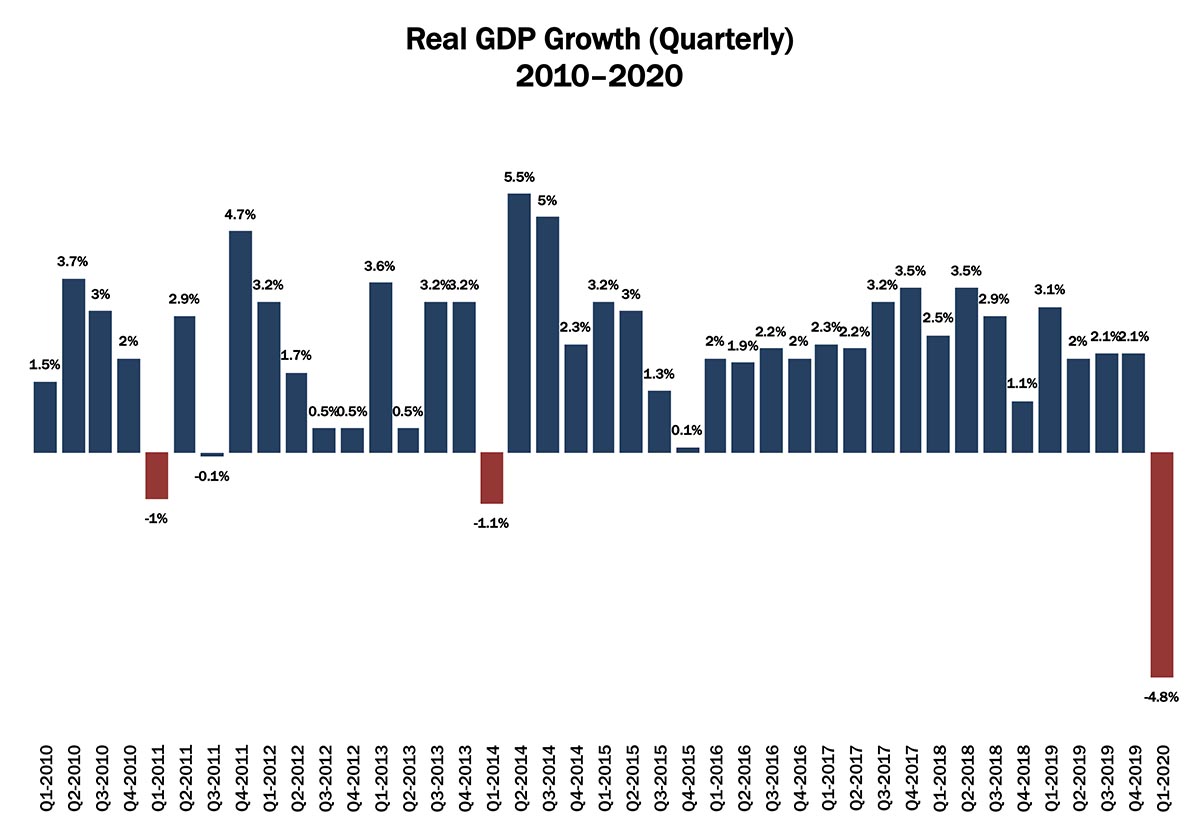
Source: Bureau of Economic Analysis via FRED
It is a puzzlement, but as bad as Q1 looks, you ain’t seen nothin’ yet. Wait ’til Q2 data comes out. Start drinking now.


