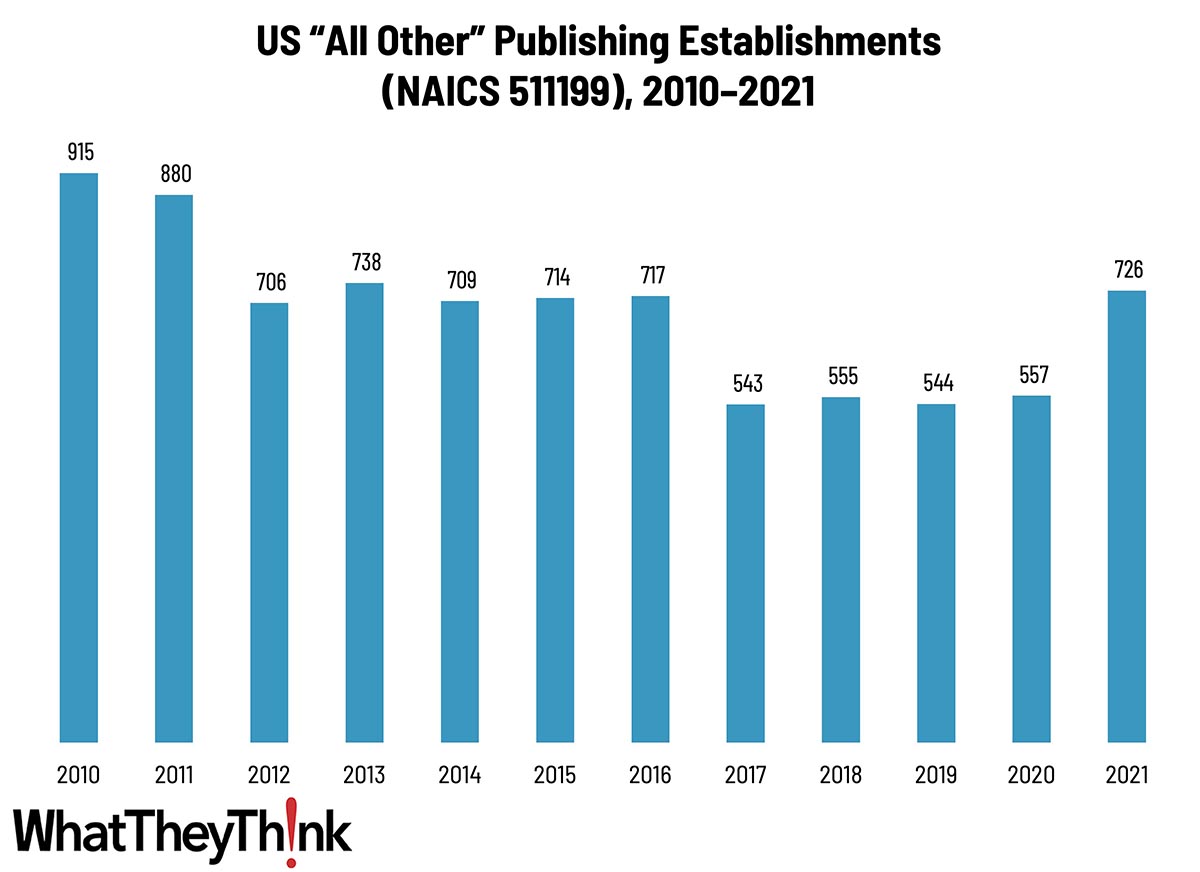
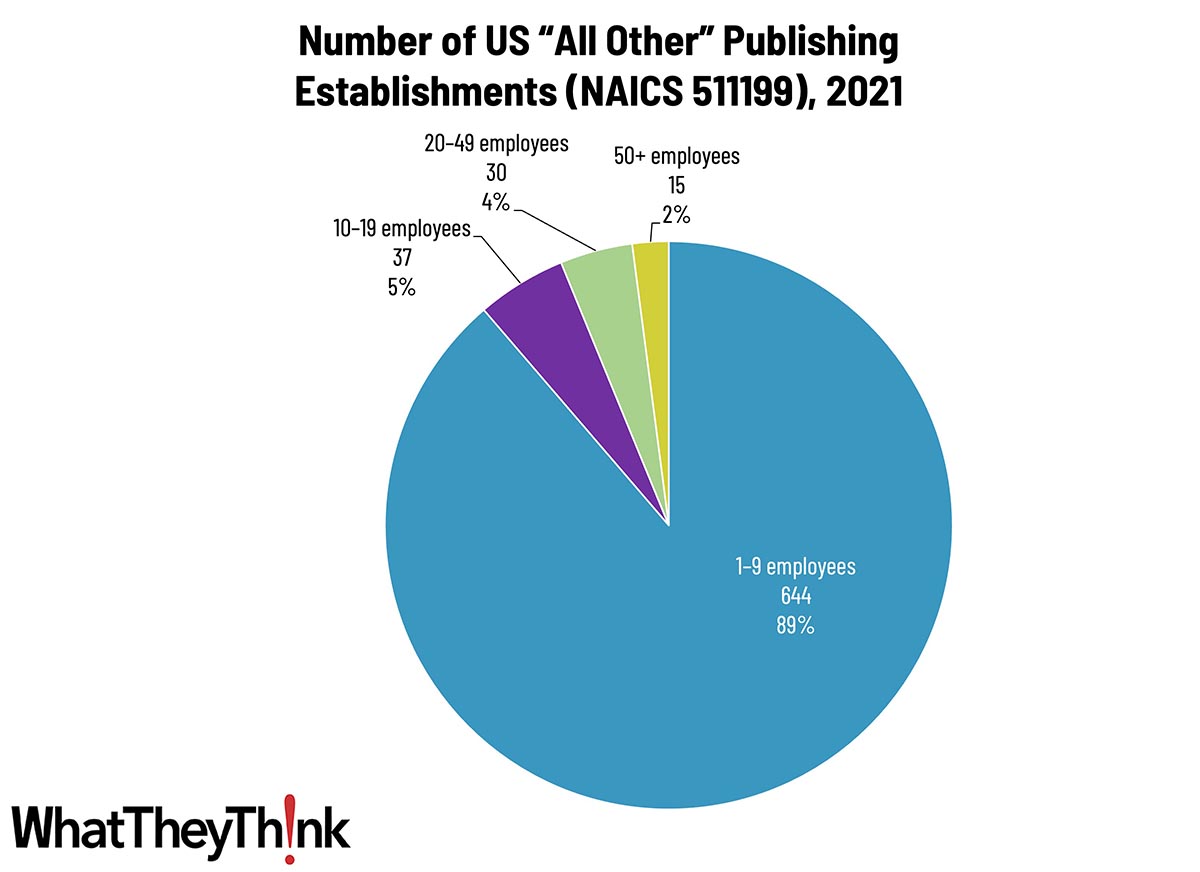
Our Friday data slice’n’dice look at the latest edition of County Business Patterns has been detailing the publishing industries. As 2021 began, there were 726 establishments in NAICS 511199 (All Other Publishing). This represents a net decrease of 39% since 2010, although establishments spiked from 2020 to 2021.
The Census Bureau defines this category as:
This U.S. industry comprises establishments generally known as publishers (except newspaper, magazine, book, directory, database, music, and greeting card publishers). These establishments may publish works in print or electronic form.
This is a catchall category that includes publishers who specialize in printed postcards, art prints, calendars, maps and atlases, etc. Unfortunately, a lot of these print applications have been largely replaced by digital alternatives: printed and mailed postcards have been superseded by posting pictures of trips and events on social media sites, for example. Art prints are increasingly produced digitally on inkjet equipment like Epson SureColor units and there is still a very large market for these prints, and wall and “page-a-day” calendars are still fairly strong, despite electronic calendar apps. The last time we looked at this category, we had said, “printed maps have almost entirely been replaced by GPS/GoogleMaps (except for historical or collectors maps).” And yet, as we pointed out in Around the Web last year, via Axios: “AAA produced 123% more maps in 2022 than 2021, the Wall Street Journal reports. “Digital maps, while powerful, aren’t perfect navigational tools: Phone batteries die, cell signals fail. And though a smartphone can easily direct you to the quickest route, taking it often means you’ll miss the best scenery. A paper map...can provide a bigger picture. And it’s not just for navigation. People are buying maps as gifts or to hang on their walls as art. Artists on Etsy will hand-draw custom maps of neighborhoods with beautifully illustrated landmarks.” So think various “boutique” publishing operations.
Regardless of what they produce, publishing establishments in this category are concentrated at the lower end of the employee-count spectrum. Small publishers (1 to 9 employees) account for 89% of all establishments, with the other three size classifications ranging from 2–5%.
These counts are based on data from the Census Bureau’s County Business Patterns. Every other week, we update these data series with the latest figures. These counts are broken down by printing business classification (based on NAICS, the North American Industrial Classification System). Next time, we’ll look at:
- 51913 Internet Publishing and Broadcasting and Web Search Portals
To clarify what is included in the 2021 CBP, establishment counts represent the number of locations with paid employees at any time during the year. If an establishment existed at any point during the year, it would be included in the CBP count of the number of establishments for 2021 CBP.
These data, and the overarching year-to-year trends, like other demographic data, can be used not only for business planning and forecasting, but also sales and marketing resource allocation.
This Macro Moment…
Q1 2024 is in the books, and the folks at Bureau of Economic Analysis are beavering away on the advance estimate of Q1 GDP. What are the experts predicting? Calculated Risk rounds up the usual suspects, and the consensus is around 2%:
- BofA: +2.2%, “largely due to downward revisions to core capital goods orders and shipments and lower than expected core capital goods shipments being offset by higher than expected manufacturing inventories.”
- Goldman: +2.1%, “reflecting stronger consumption growth and a larger contribution from inventory accumulation that more than offset a slightly wider trade deficit.”
- Altanta Fed: GDPNow: +2.3%, “the nowcast of first-quarter real personal consumption expenditures growth increased from 1.9 percent to 2.6 percent, while the nowcast of the contribution of the change in real net exports to first-quarter real GDP growth decreased from -0.16 percentage points to -0.47 percentage points.”
The BEA releases its advance estimate on April 25. Place your bets!