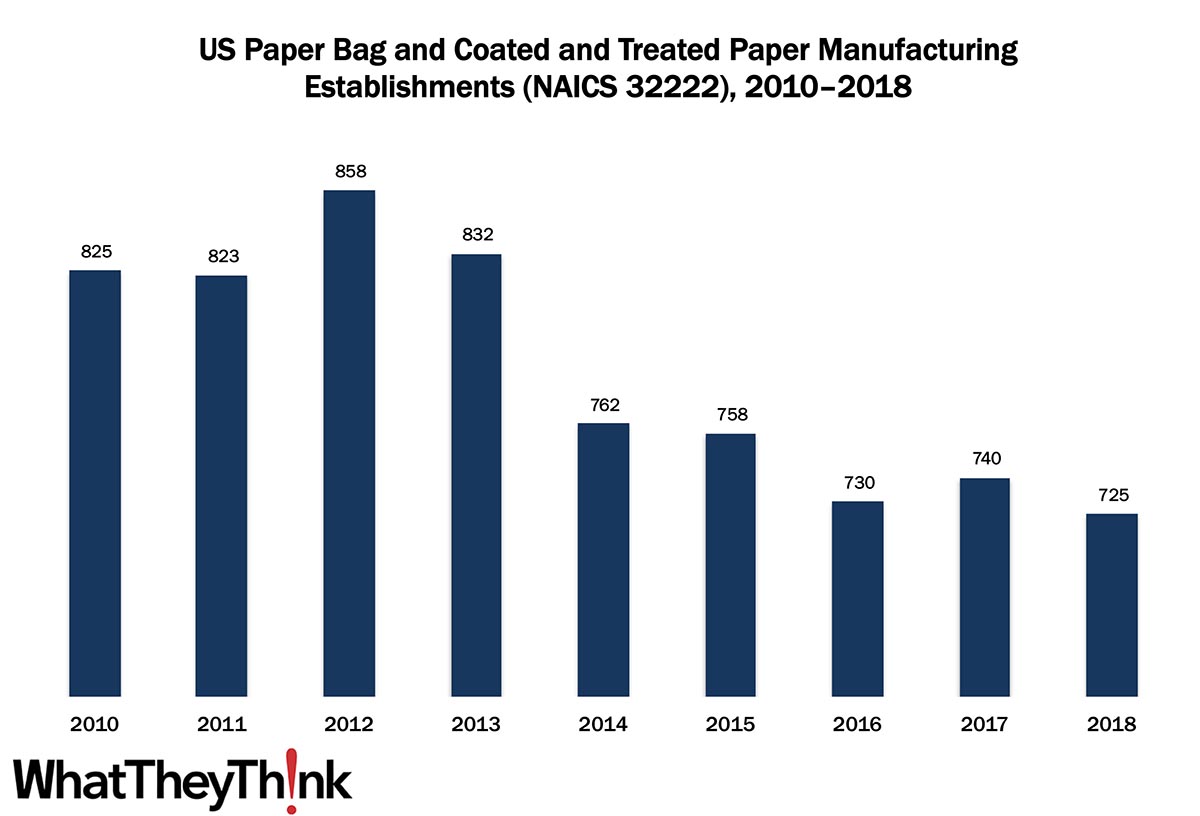
In our ongoing, semi-weekly look at establishment and employee counts of graphic arts businesses, we have turned to packaging/paper converting establishments. In 2010, there were 825 establishments in NAICS 32222 (Paper Bag and Coated and Treated Paper Manufacturing), but by 2018, that number had declined to 725, despite a shooting up to 858 establishments in 2012.
The Bureau of the Census definition for this business classification:
This industry comprises establishments primarily engaged in one or more of the following: (1) cutting and coating paper and paperboard; (2) cutting and laminating paper, paperboard, and other flexible materials (except plastics film to plastics film); (3) manufacturing bags, multiwall bags, sacks of paper, metal foil, coated paper, laminates, or coated combinations of paper and foil with plastics film; (4) manufacturing laminated aluminum and other converted metal foils from purchased foils; and (5) surface coating paper or paperboard.
At the time, “paper vs. plastic” considerations anecdotally worked in paper bags’ favor, more and more municipalities had been banning or adding surcharges to plastic bags, and paper bags are easily recycled. At the same time, the growth and popularity of reusable bags have been making this conversation moot. (Remember, this was long pre-COVID.) Trends in retail can trickle down to affect bag demand, and there is still demand for niche/boutique bags. Digital printing can eliminate the “blank bag,” and laminates and other types of coatings—plastics, foils, embellishments, etc.—increase strength, aesthetic appeal, etc., but may adversely impact recyclability.
This four-digit NAICS comprises a variety of different converted packaging types, and over the next few weeks, we will be looking at them in turn, including:
- 322219 Other Paperboard Container Manufacturing
- 32223 Stationery Product Manufacturing
These counts are based on data from the Census Bureau’s County Business Patterns. Every other week, we update these data series with the latest figures. Census Bureau reports include other data, as well, such as number of employees, payroll, etc. These counts are broken down by publishing business classification (based on NAICS, the North American Industrial Classification System).
These data, and the overarching year-to-year trends, like other demographic data, can be used not only for business planning and forecasting, but also sales and marketing resource allocation.
Over time, we will be adding additional data from County Business Patterns, such as number of employees, payroll, and similar information for additional business classification of relevance to the graphic communications industry.
This Macro Moment
It’s been a while since we checked in with unemployment claims. Yesterday, the Department of Labor reported:
In the week ending November 14, the advance figure for seasonally adjusted initial claims was 742,000, an increase of 31,000 from the previous week's revised level. The previous week's level was revised up by 2,000 from 709,000 to 711,000. The 4-week moving average was 742,000, a decrease of 13,750 from the previous week's revised average. The previous week's average was revised up by 500 from 755,250 to 755,750.
Well, it’s below one million, if that’s our new benchmark. By the way, the number above does not include the 320,237 initial claims for Pandemic Unemployment Assistance (PUA)—which itself was up from 296,374 the previous week. On the “plus” side, continued unemployment claims for the week of November 7 (continued claims lag initial claims) decreased to 6,372,000 (seasonally adjusted) from 6,801,000 the week before.
Meanwhile, we hit s grim landmark with 250,000 COVID deaths and new record high infection rates every day. It’s going to be a long winter.