Data Analysis
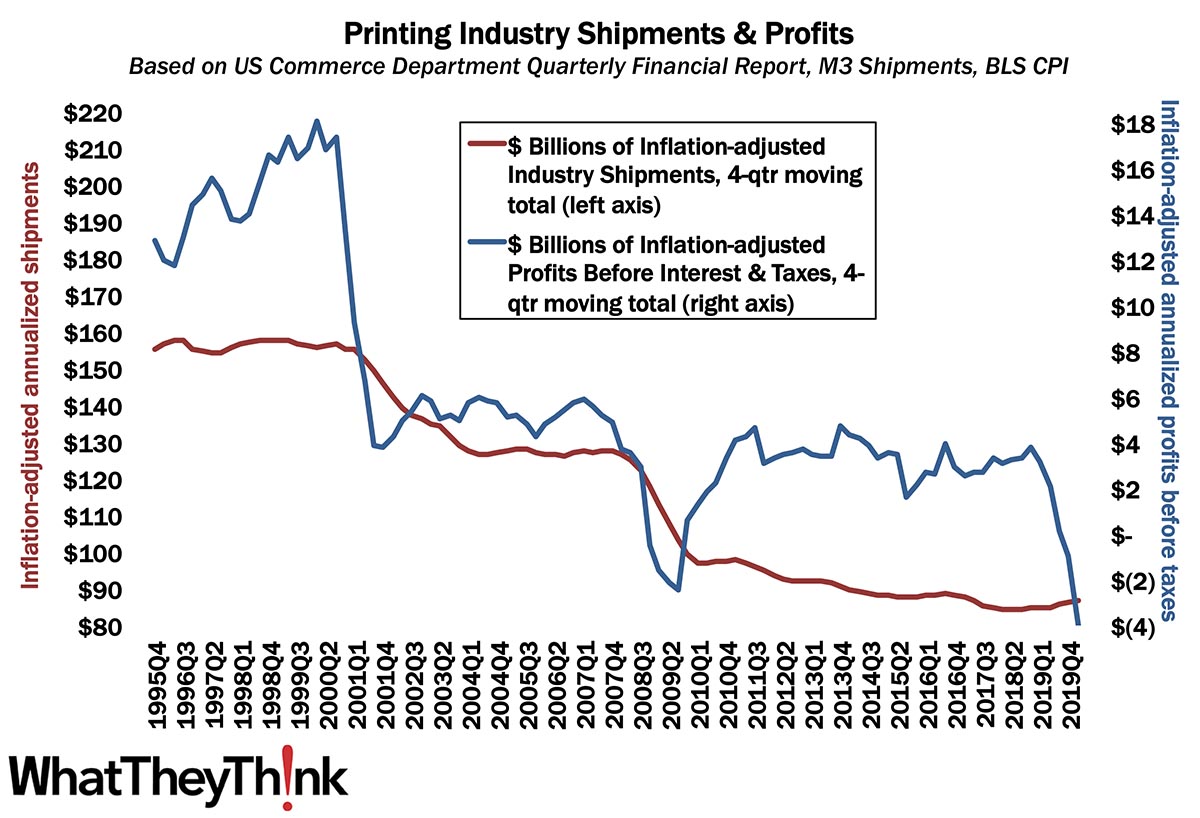
A Tale of Two Cities: The Pandemic Years
Published: June 19, 2020
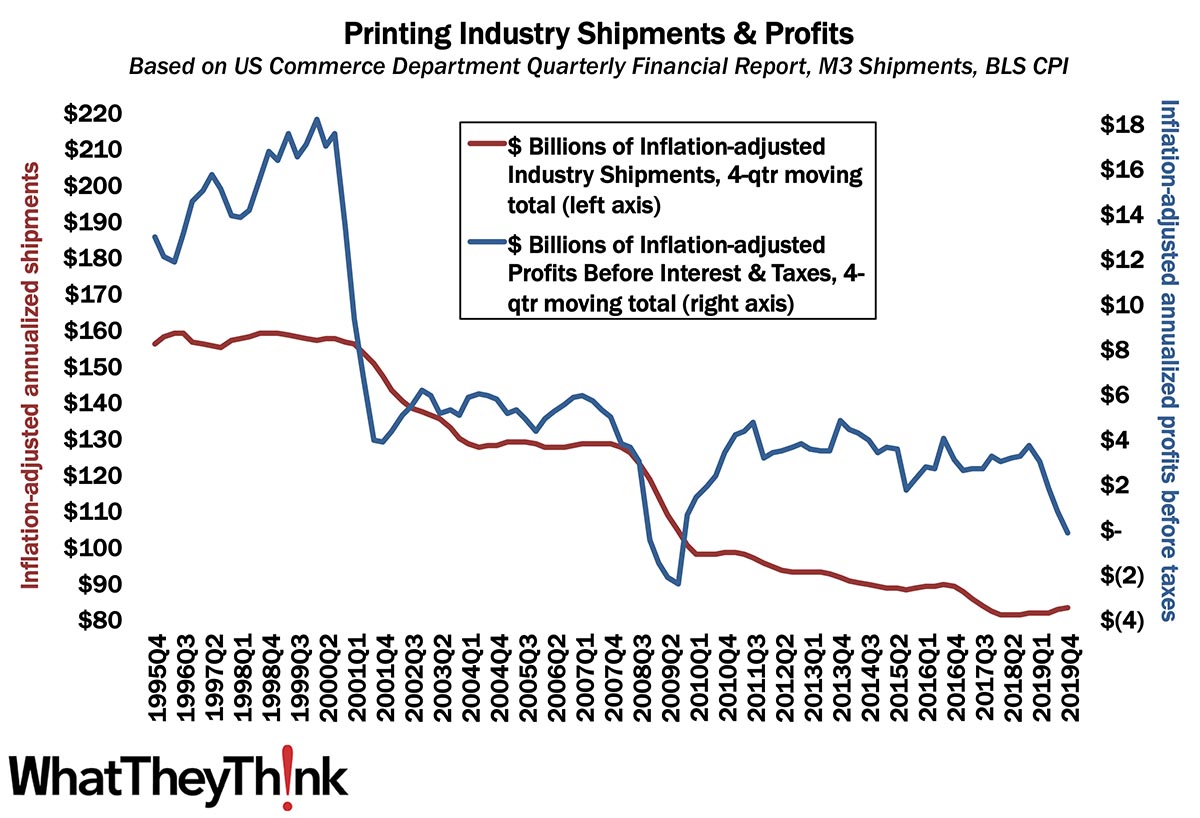
Annualized profits for Q1 2020 took a nosedive from $990 million to -$4 billion. Sure, the pandemic hit in the last three weeks of the quarter, but this is an old story that predates COVID. Full Analysis
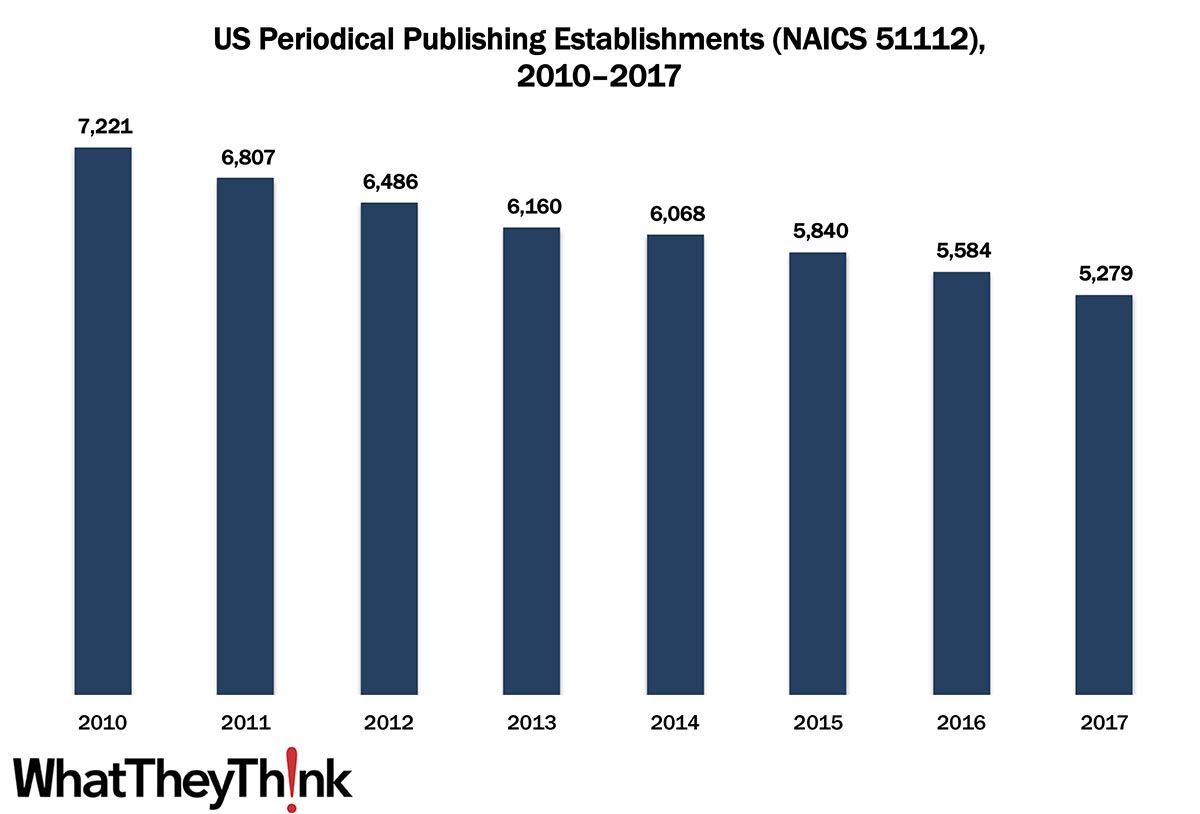
Periodical Publishing Establishments—2010–2017
Published: June 12, 2020
In 2010, there were 7,221 US periodical publishing establishments; by 2017, that number had dropped to 5,279. Magazines have been struggling in the Internet age, with closures and consolidations, but also have been seeing a shift in what constitutes “periodical publishing.” Also: we’re officially in a recession (surprise). Full Analysis
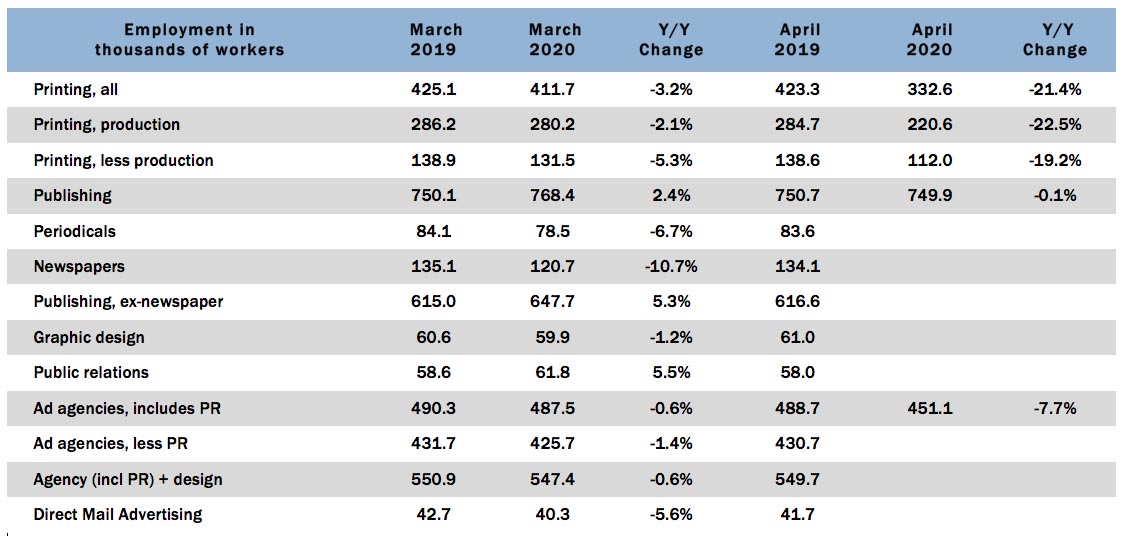
Graphic Arts Employment—April 2020
Published: June 5, 2020
Here we go: in April 2020, the overall printing employment was down -19.2% from March and down -21.4% from April 2019. We’ve been expecting this. Full Analysis
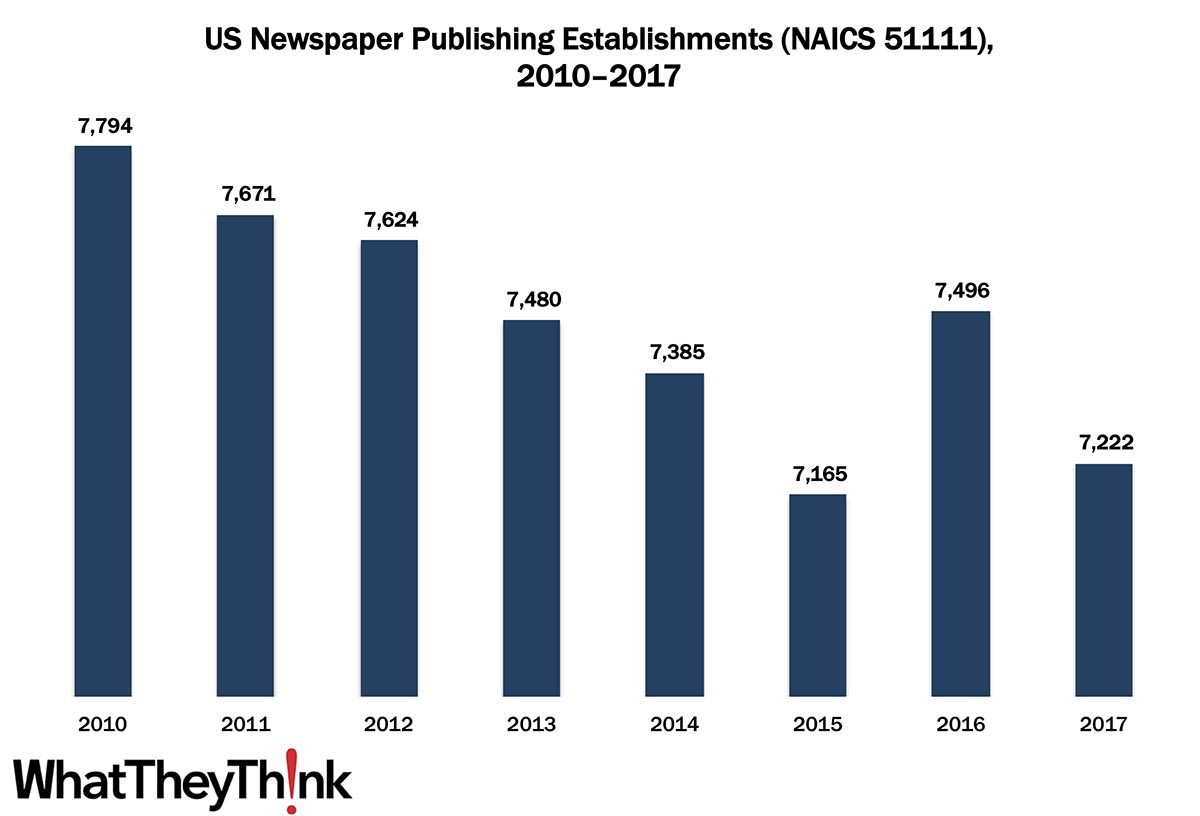
Newspaper Publishing Establishments—2010–2017
Published: May 29, 2020
In 2010, there were 7,794 US newspaper publishing establishments; by 2017, that number had dropped to 7,222. The newspaper industry’s woes have been well-documented, but the trouble started well before the Internet era. Also: Q1 GDP revised down. Full Analysis
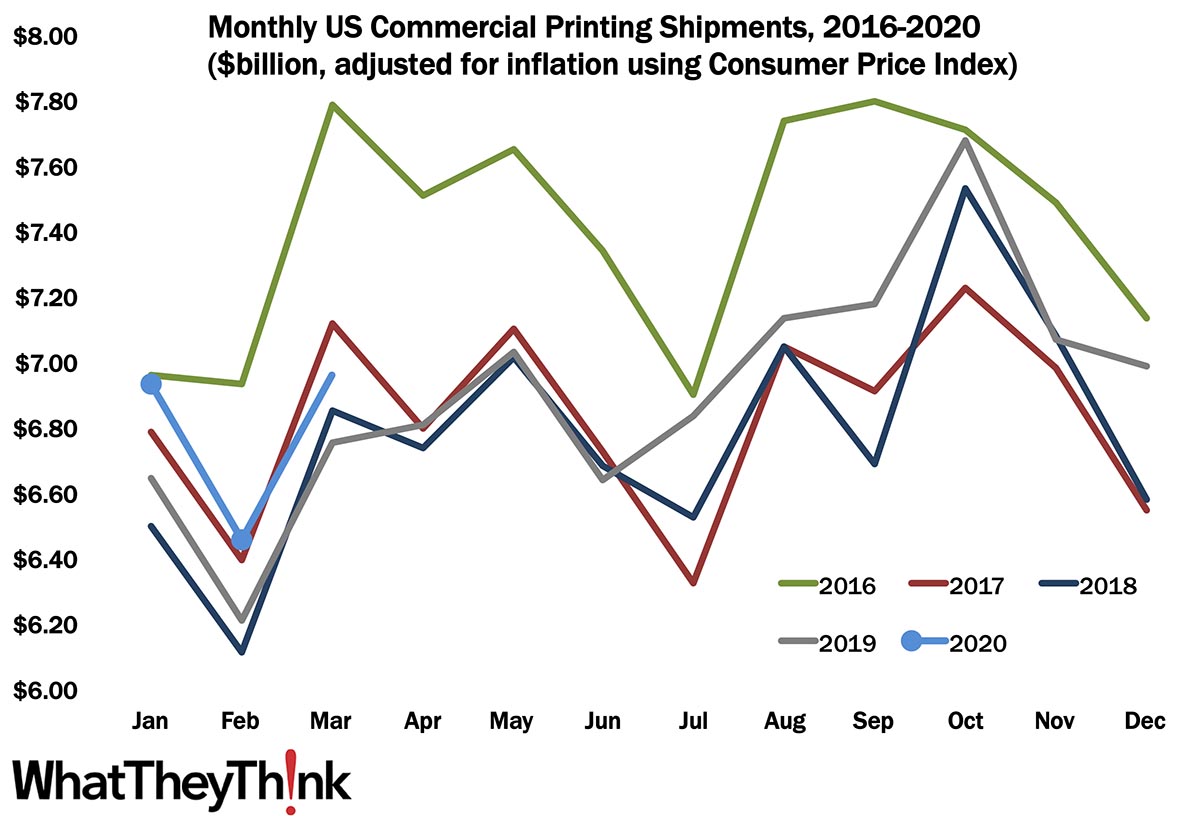
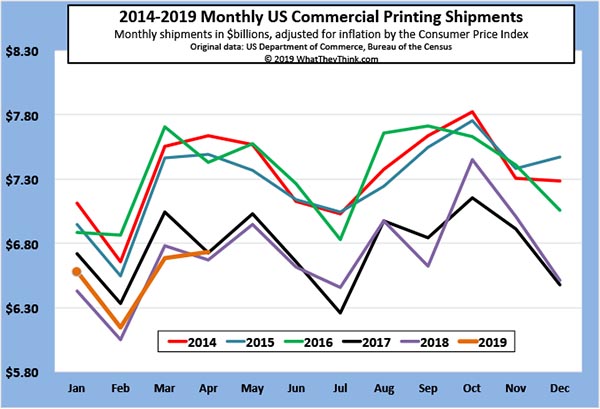
March Shipments—Crest of a Wave
Published: May 22, 2020
As we kind of expected, at $6.96 billion, March shipments were up from February’s $6.48 billion, and well enough above March 2019’s $6.75 billion. Full Analysis
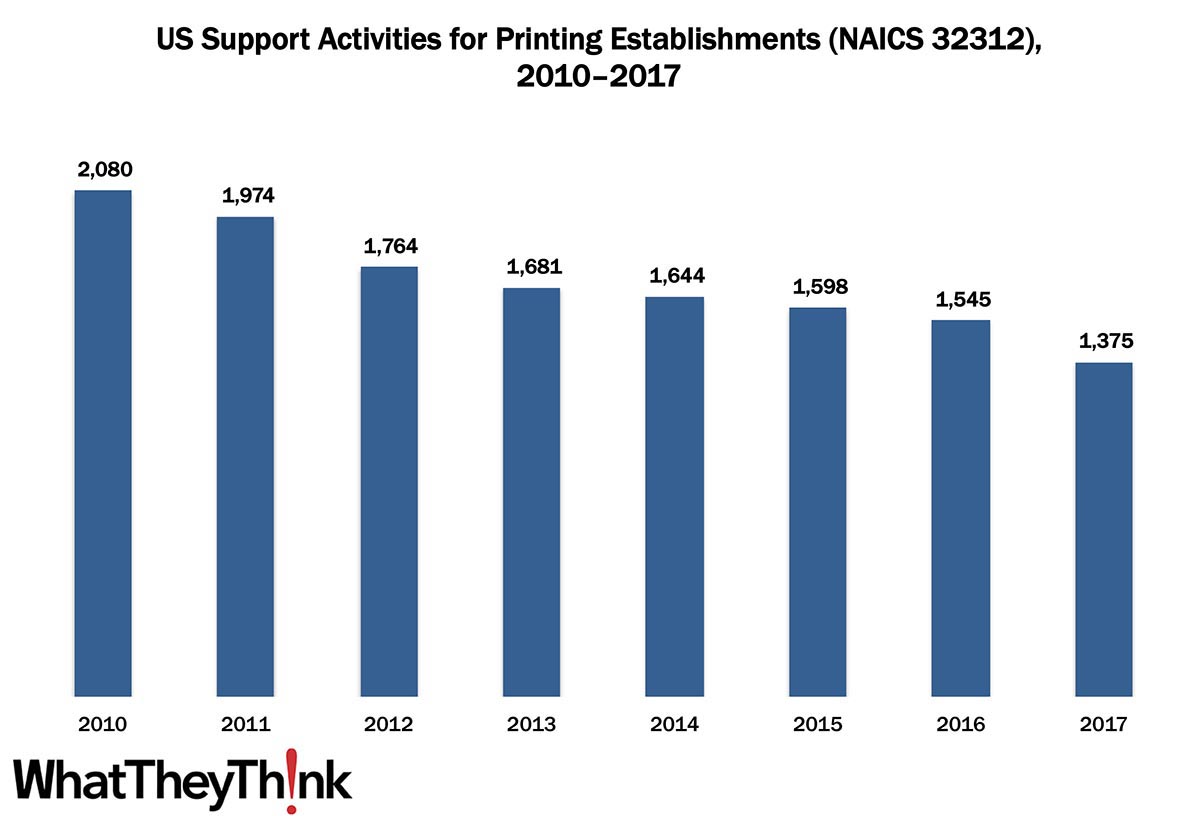
Prepress and Postpress Services Establishments—2010–2017
Published: May 15, 2020
In 2010, there were 2,080 establishments offering prepress and/or postpress services; by 2017, that number had dropped to 1,375. It’s not difficult to understand why the number of these establishments has been dropping: prepress is being absorbed into the printing process itself (especially in digital printing), and more print businesses are acquiring their own finishing capabilities. Full Analysis
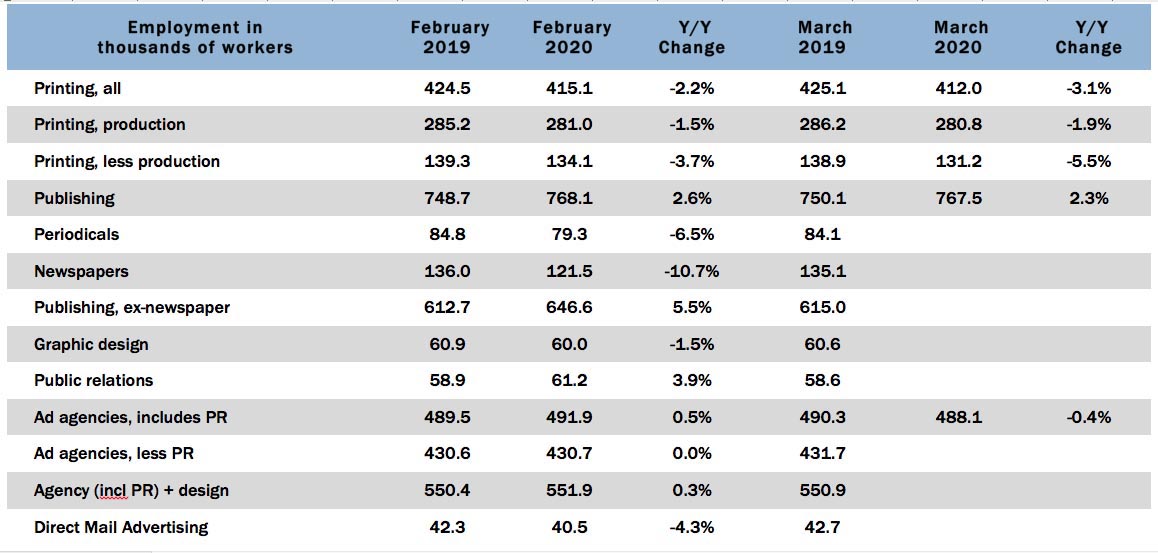
Graphic Arts Employment—March 2020
Published: May 8, 2020
Another of the Scenes from the Before Times: in March 2020, the overall printing employment was virtually unchanged from February (-0.7%) and on a year-over-year basis is down -3.1%. Obviously, this is the calm before the storm. Full Analysis
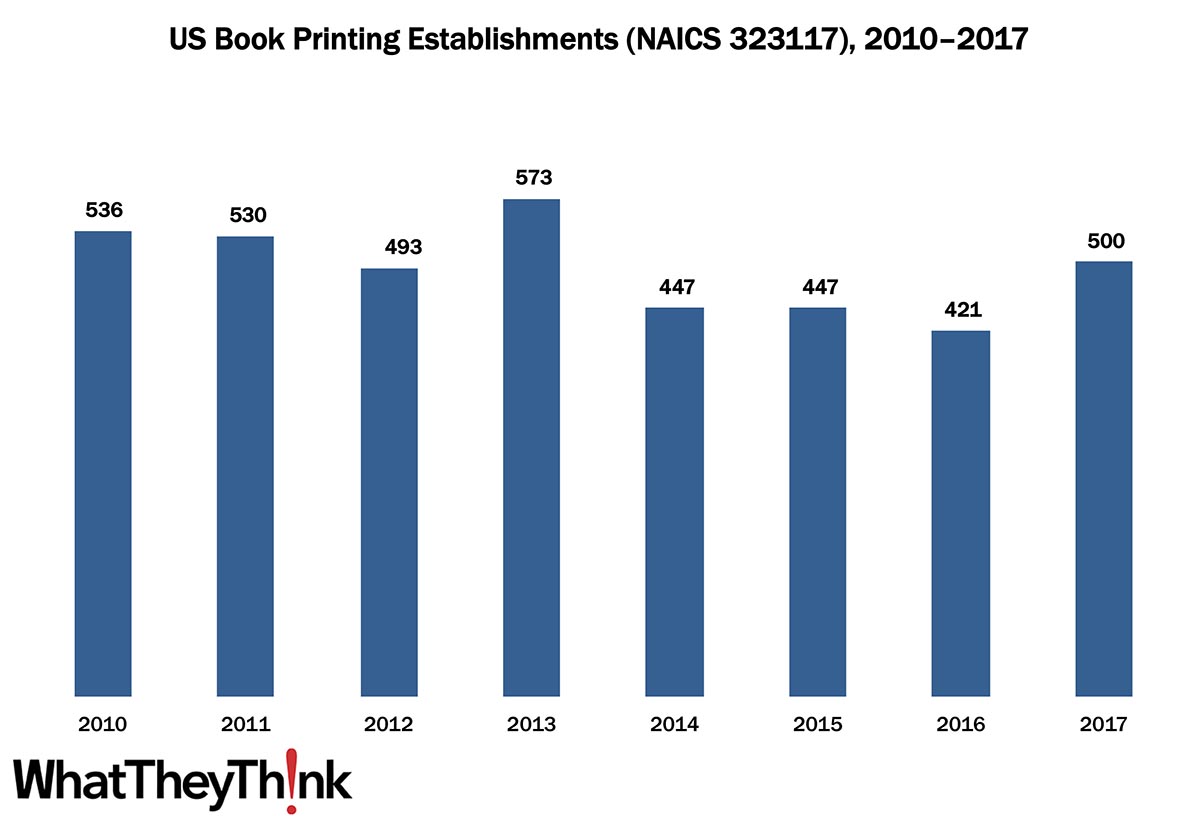
Book Printing Establishments—2010–2017
Published: May 1, 2020
According to the latest edition of County Business Patterns, in 2017 there were 500 establishments in NAICS 323117 (Book Printing Establishments). This represents an decline of -6.7% since the decade began. In other data news, the BEA released Q1 2020 GDP growth. Click on through, if you dare. Full Analysis
February Shipments: Tales from The Before Times
Published: April 24, 2020
At $6.48 billion, February shipments were down from January’s $6.94 billion, but well above February 2019’s $6.22 billion—and indeed was the best February we’ve had since 2016. Ah, well... Full Analysis
Printing Profits Plunged—Even Before the Crisis
Published: April 10, 2020
Annualized profits for Q4 2019 took a nosedive from $720 million to -$170 million in the latest chapter in our “tale of two cities” narrative, this time with the profitability gap between large and small printers narrowing. Full Analysis
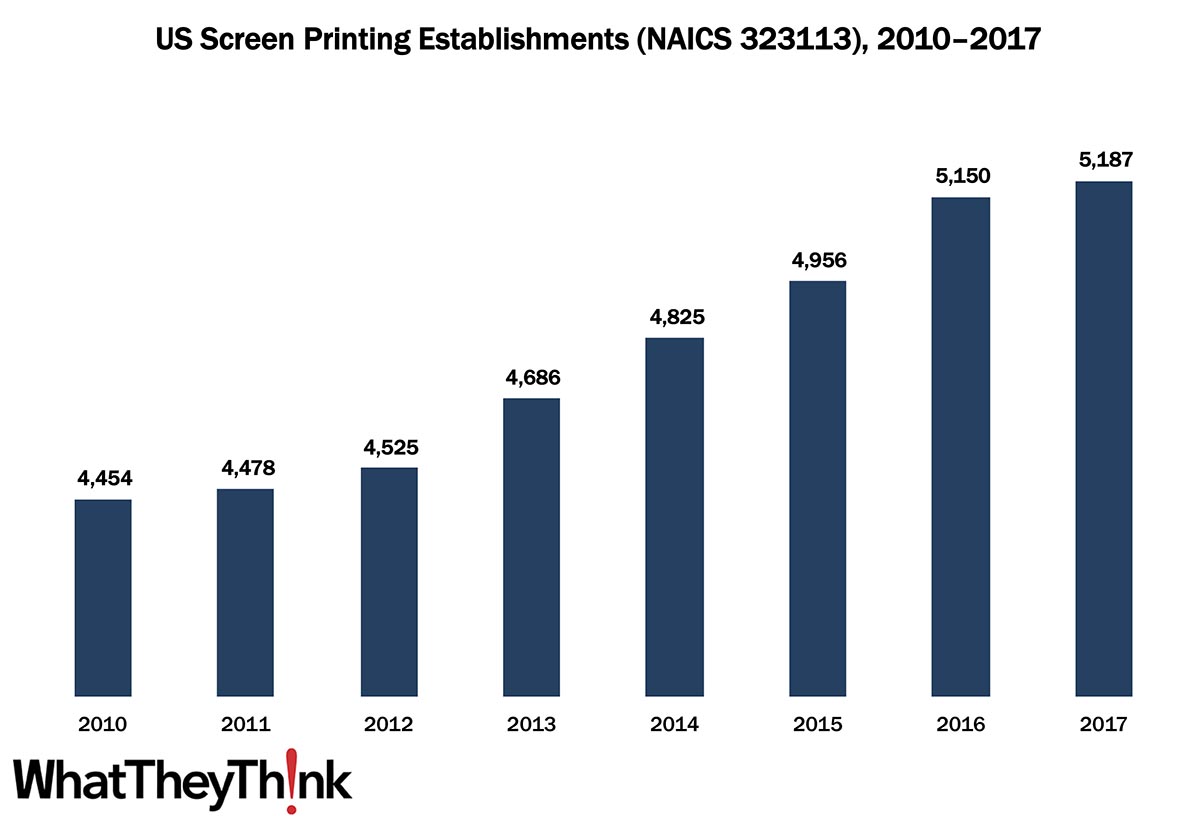
Screen Printing Establishments—2010–2017
Published: April 3, 2020
According to the latest edition of County Business Patterns, in 2017 there were 5,187 establishments in NAICS 323113 (Commercial Screen Printing). This represents an increase of +16% since the decade began. Full Analysis
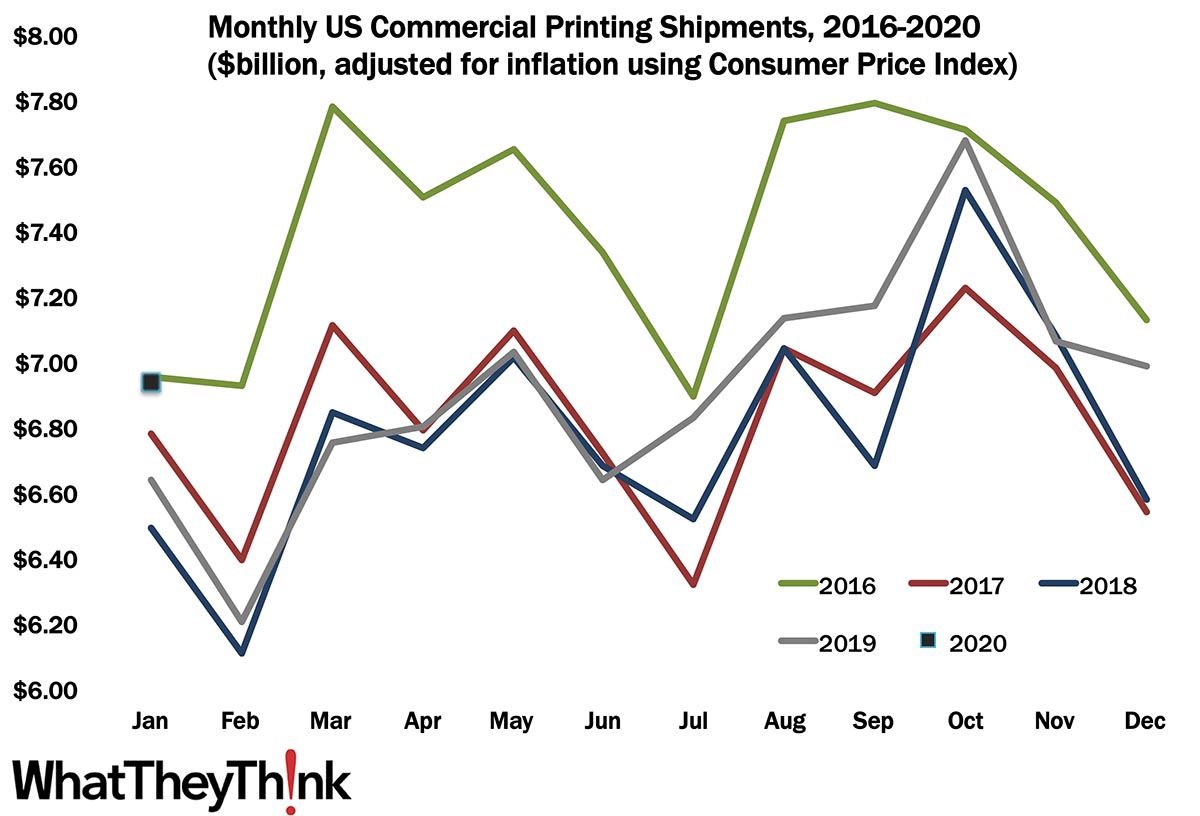
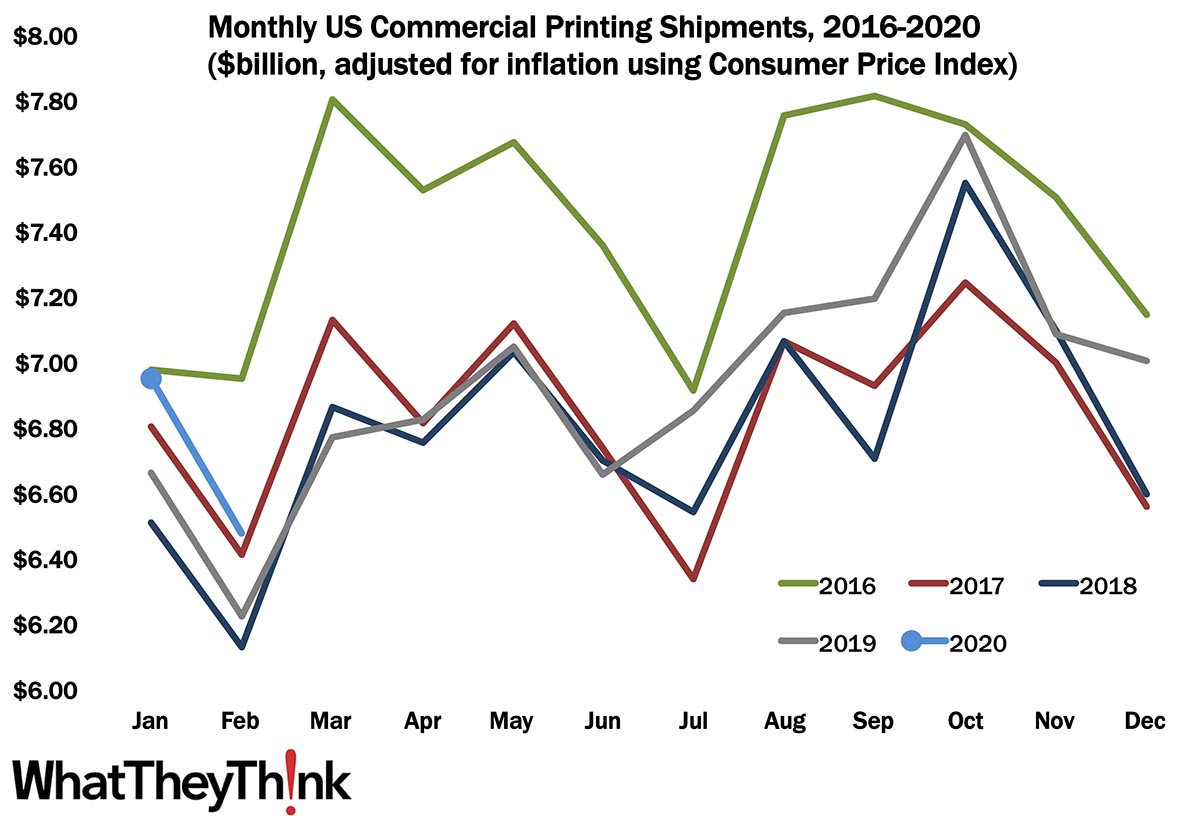
January Shipments: Well, We Started Great
Published: March 27, 2020
At $6.94 billion, January shipments were down a little from December’s $6.98 billion, but that was just slightly lower than January 2016’s $6.95 billion—the best January we have had since then. But, elephant in the room... Full Analysis
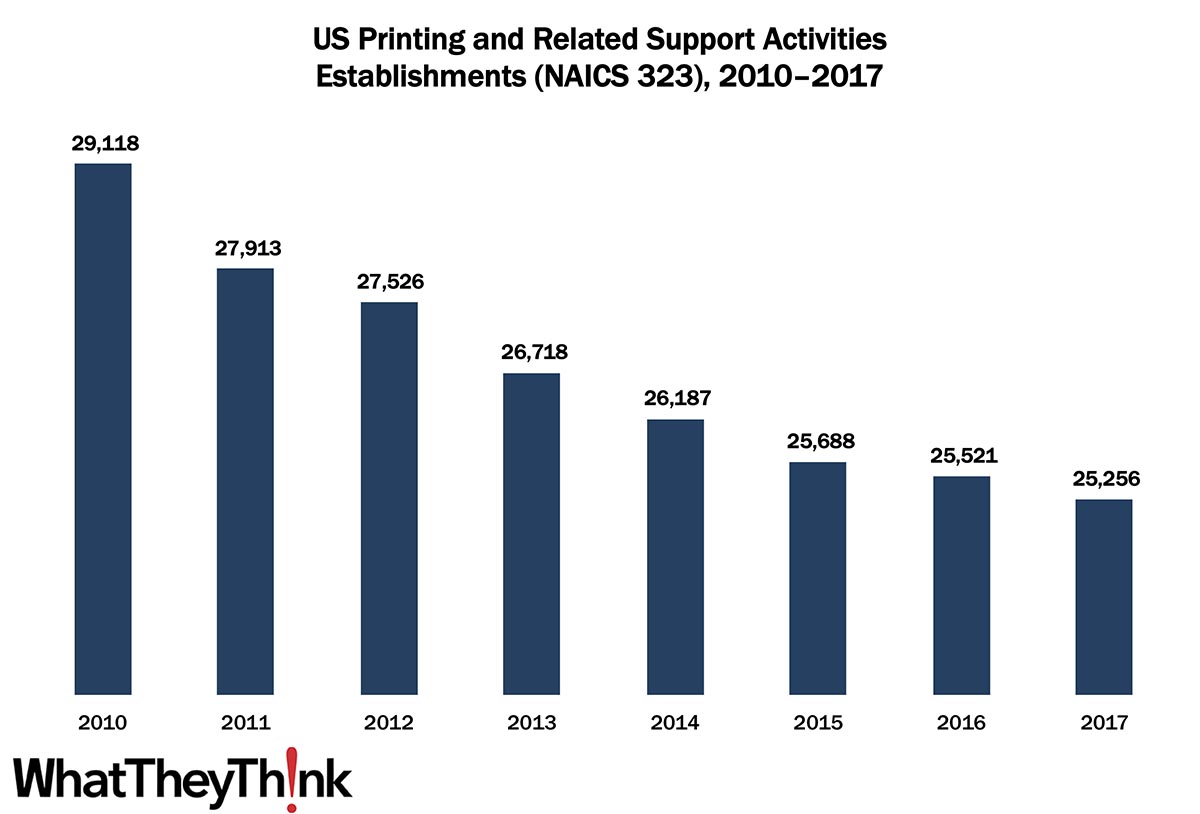
Printing Establishments—2010–2017
Published: March 20, 2020
According to the latest edition of County Business Patterns, in 2017 there were 25,256 establishments in NAICS 323 (Printing and Related Support Activities). This represents a decline of 13% since the decade began. Full Analysis
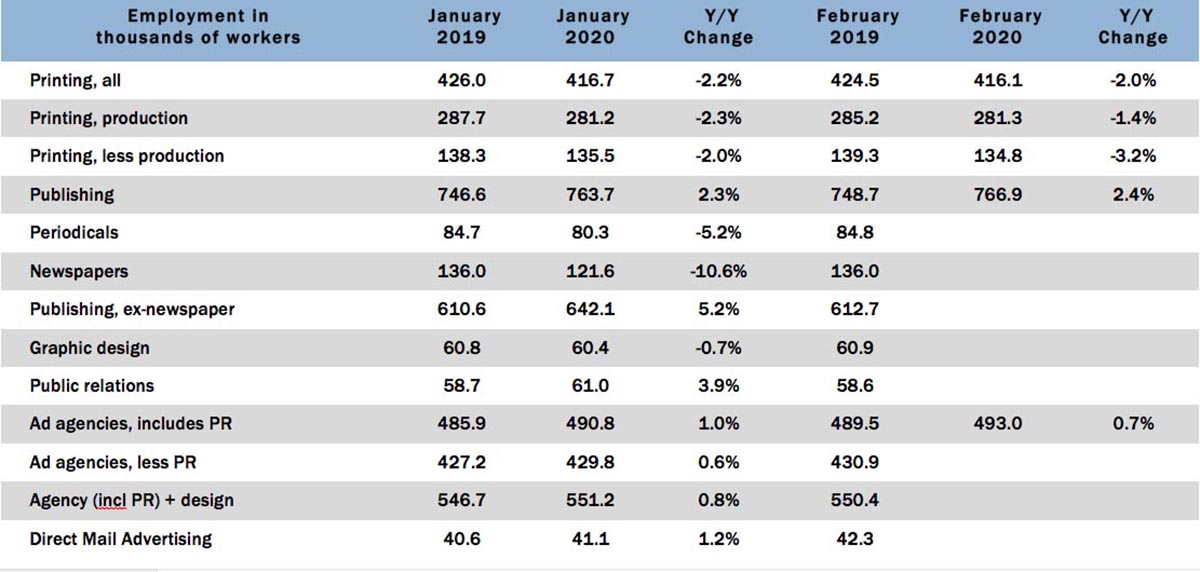
Graphic Arts Employment—February 2020
Published: March 13, 2020
In February 2020, overall printing employment was virtually unchanged from January (-0.1%) and on a year-over-year basis was down -2.0%. Interestingly, production employment was up, albeit infinitesimally. Full Analysis
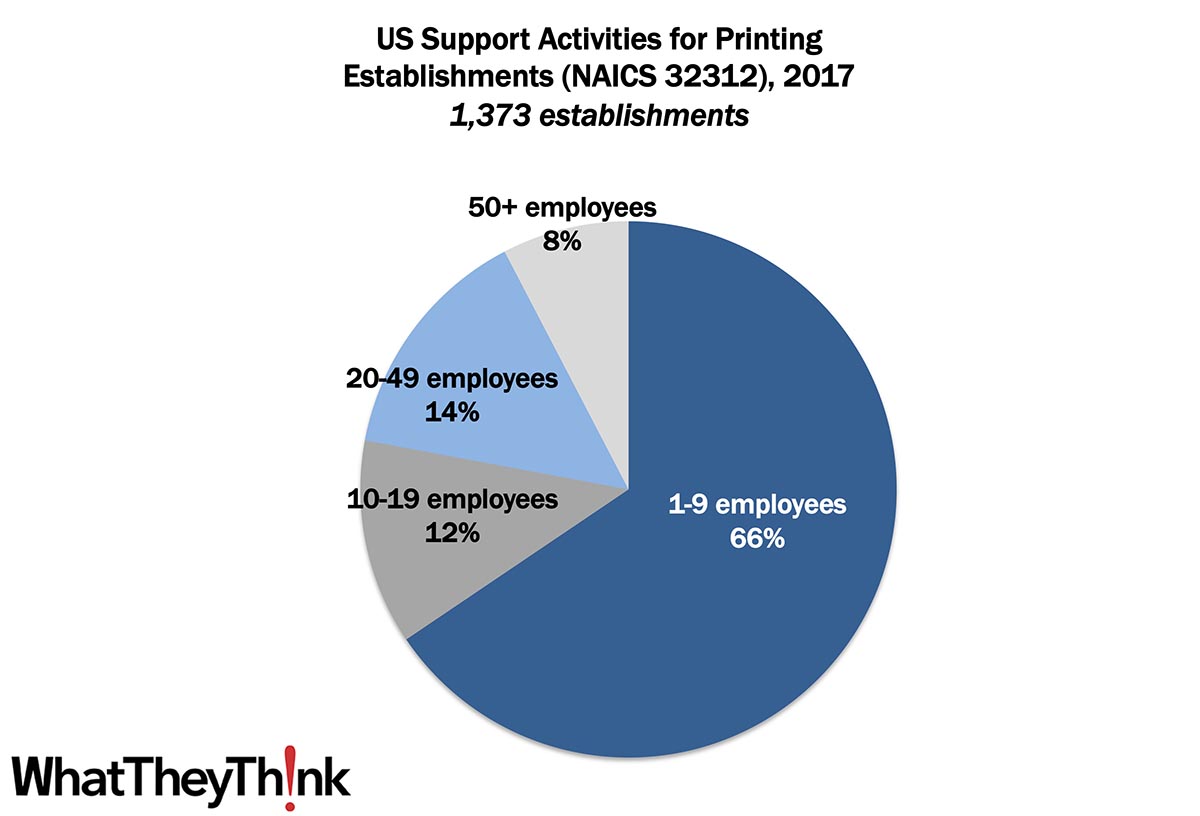
Prepress and Postpress Establishments—2017
Published: March 6, 2020
According to the latest edition of County Business Patterns, in 2017 there were 1,373 establishments in NAICS 32312 (Support Activities for Printing). The majority of these establishments (66%) had fewer than 10 employees. Full Analysis
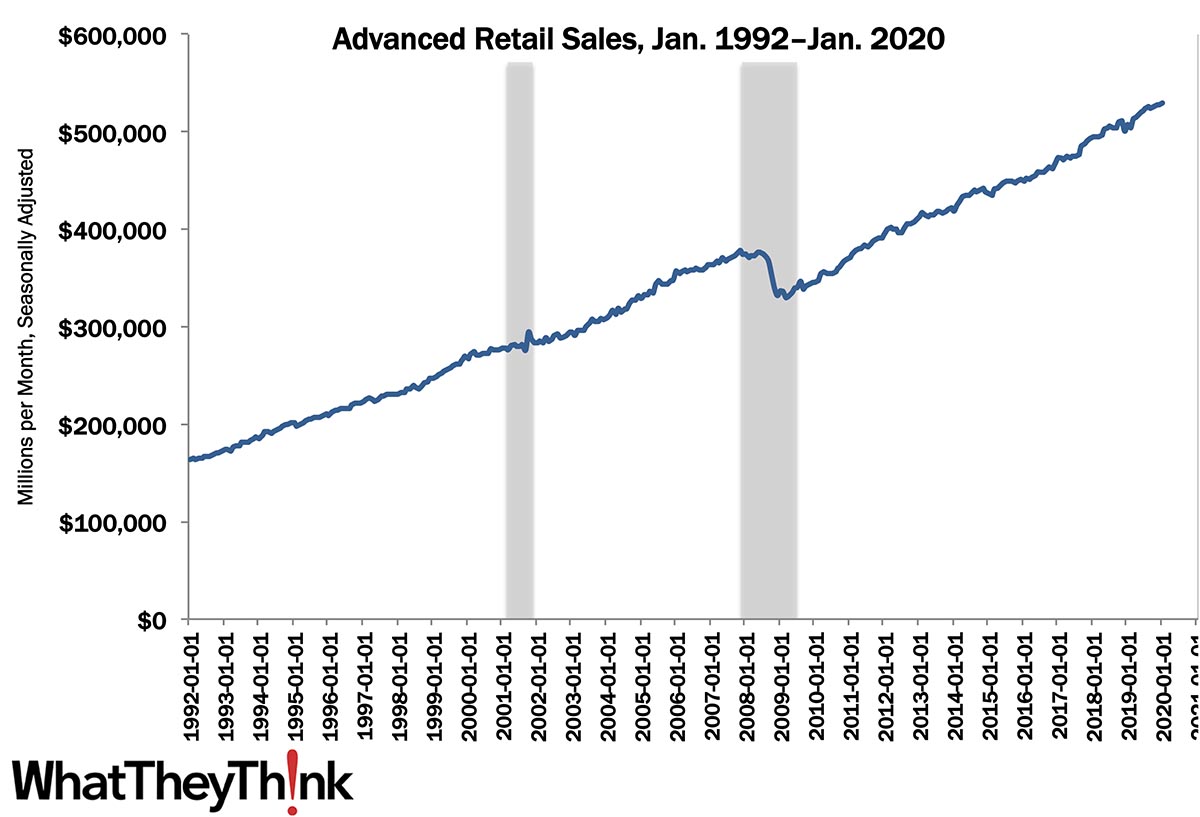
Retail Sales—January 2020
Published: February 28, 2020
Advance estimates of U.S. retail and food services sales for January 2020, adjusted for seasonal variation and holiday and trading-day differences, but not for price changes, were $529.8 billion, an increase of +0.3% (±0.4%) from the previous month, and +4.4% (±0.7%) above January 2019. Retail drives a lot of printing and packaging volume, so it’s important to keep an eye on that sector. Full Analysis
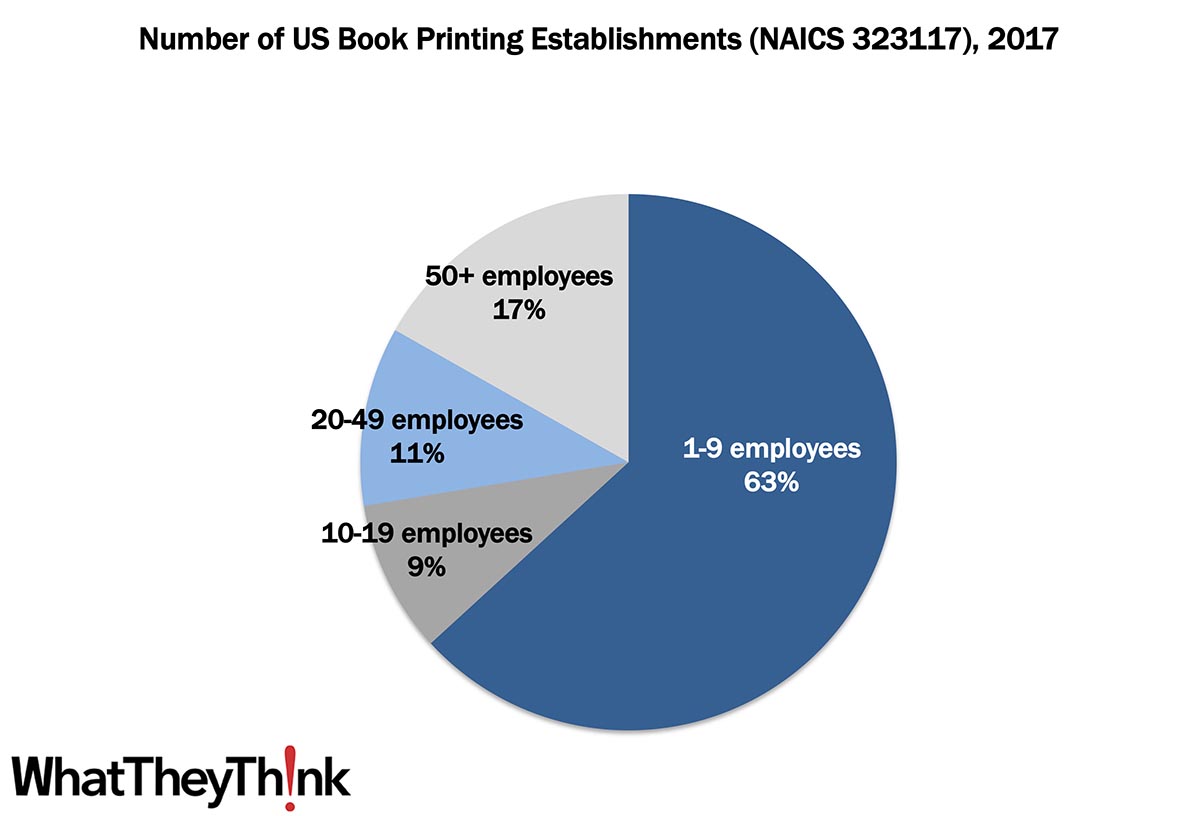
Book Printers—2017
Published: February 21, 2020
The latest edition of County Business Patterns is out, which updates number of establishments and other data to 2017. In that year, there were 500 establishments in NAICS 323117 (Book Printing). The majority of these establishments (63%) had fewer than 10 employees. Full Analysis
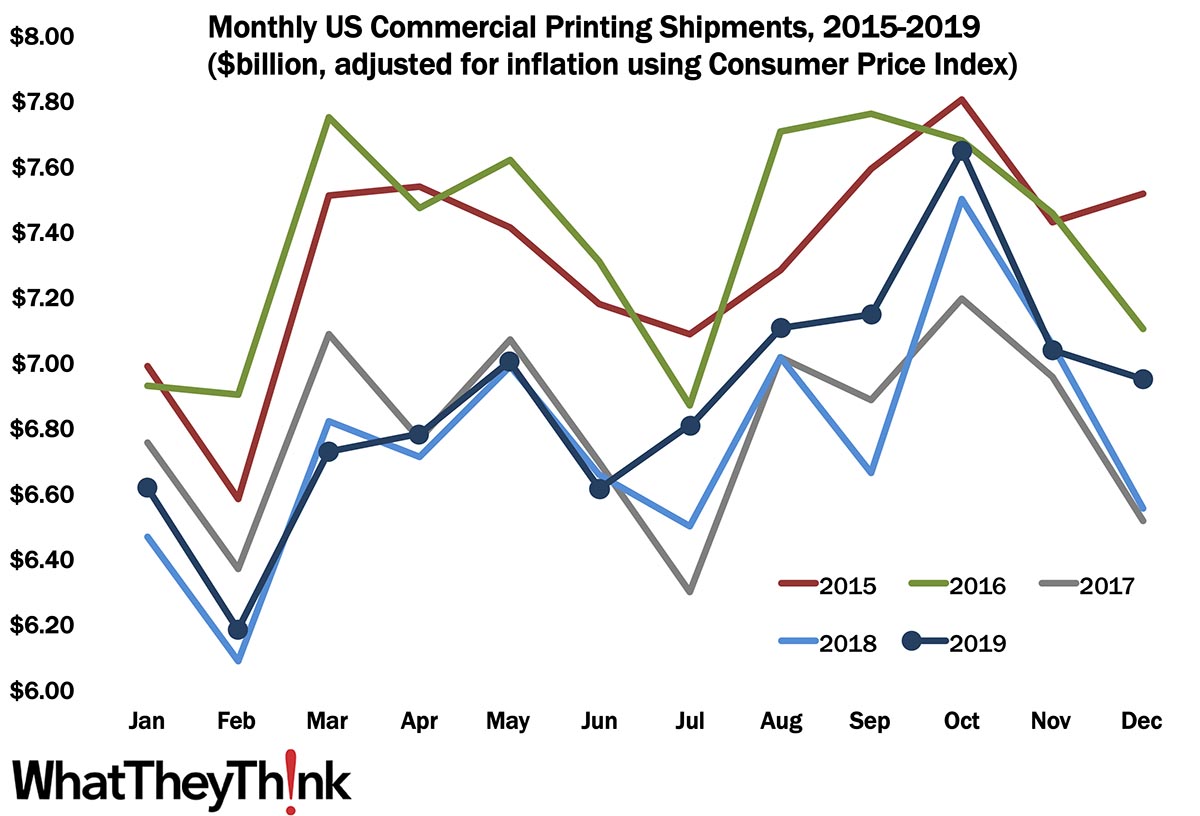
December Shipments: Ending 2019 on a High Note
Published: February 14, 2020
The value of printing shipments for December 2019 was down from November—as we expected it would be—but not down as much as been the case in recent years. At $6.95 billion, December shipments were down from November’s $7.03 billion, but far above the depths of 2017 and 2018. Full Analysis
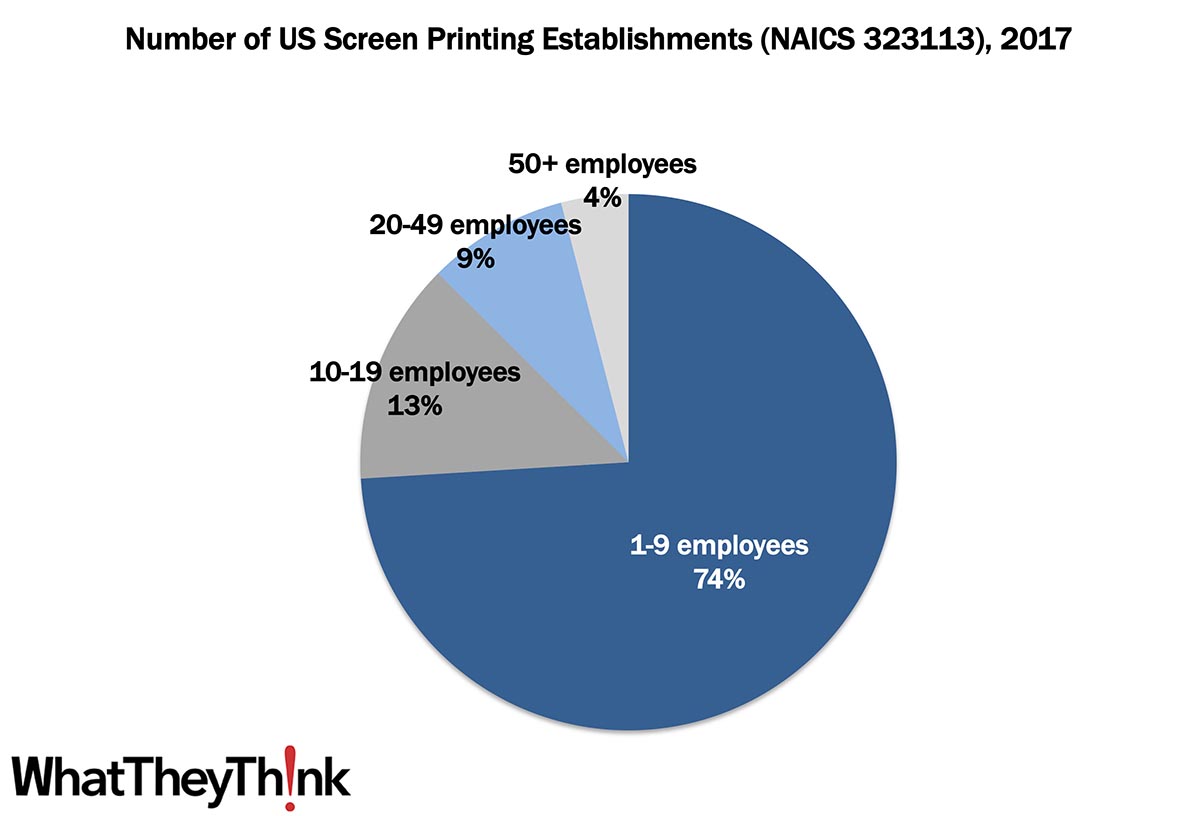
Screen Printing Establishments—2017
Published: February 7, 2020
The latest edition of County Business Patterns is out, which updates number of establishments and other data to 2017. In that year, there were 5,186 establishments in NAICS 323113 (Commercial Screen Printing). The majority of these establishments (74%) had fewer than 10 employees. Full Analysis
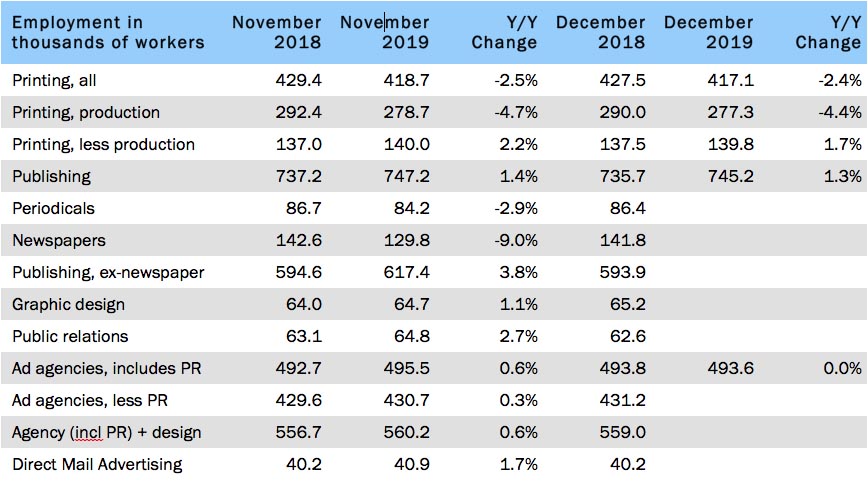
Graphic Arts Employment—December 2019
Published: January 31, 2020
In December 2019, overall printing employment dropped -0.2% from November, and on a year-over-year basis, it is down -2.4%. Production employment was down -0.5% from November to December (and -4.4% Y/Y) while non-production employment was down -0.1% from November to December—but actually up +1.7% Y/Y. Full Analysis
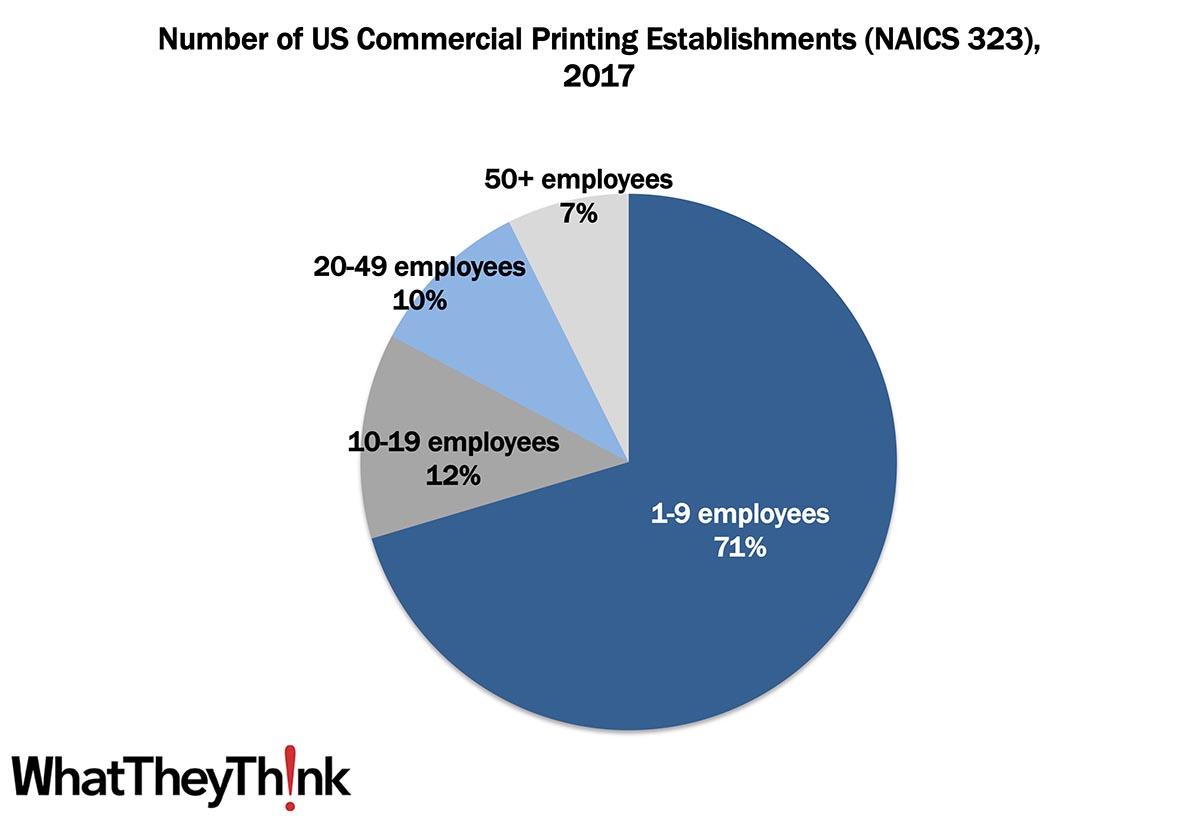
Commercial Printing Establishments—2017
Published: January 24, 2020
The latest edition of County Business Patterns is out, which updates the number of establishments and other data. In 2017, there were 25,256 establishments in NAICS 323 (Printing and Related Support Activities). The majority of these establishments (71%) have fewer than 10 employees. Full Analysis
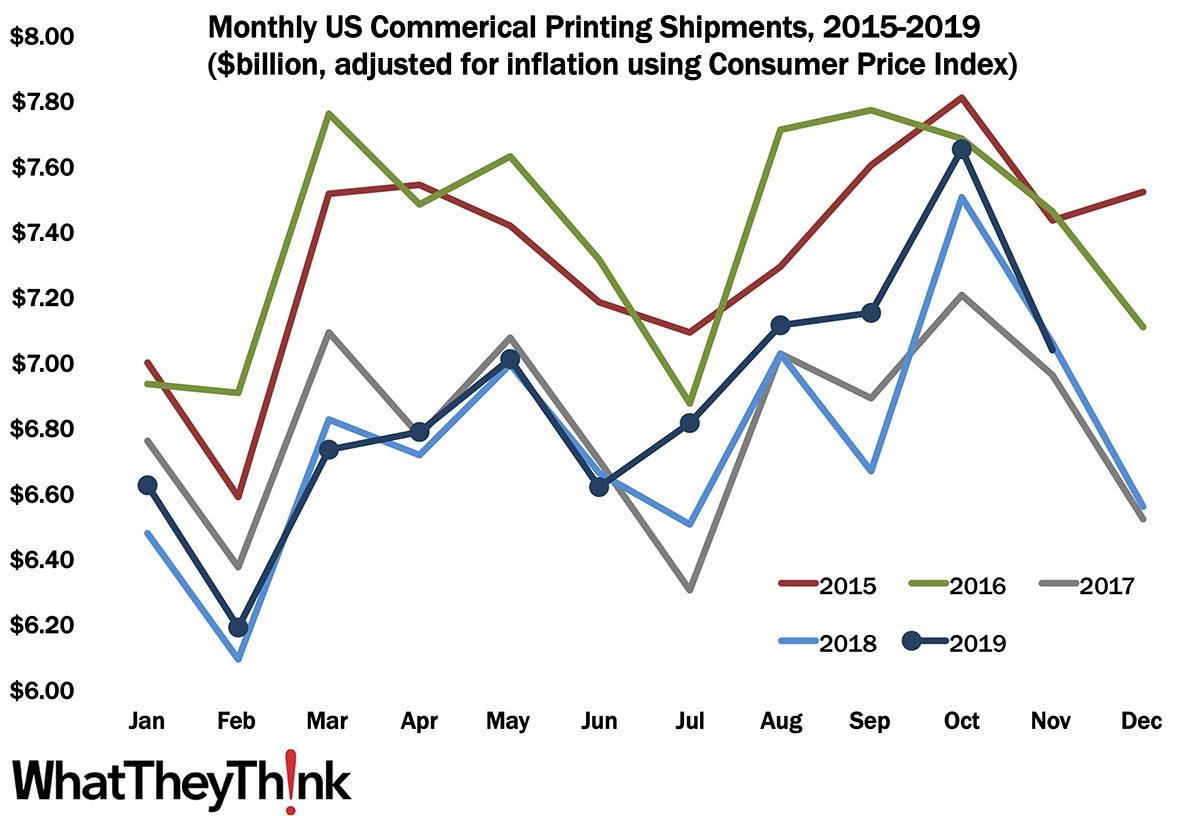
November Printing Shipments: Off for the Holidays
Published: January 17, 2020
The value of printing shipments for November 2019 was $7.03 billion—a pretty big drop from October’s $7.65 billion, but we kind of expected it, as November and December see business slow down for the holidays. Full Analysis
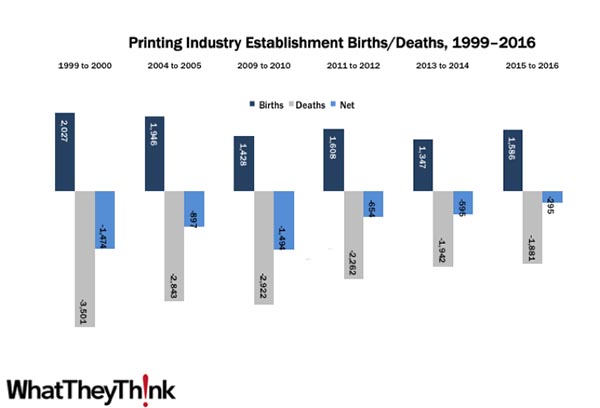
Establishment Births/Deaths: Industry Attrition Continues to Slow
Published: January 10, 2020
From 2015 to 2016, there had been an increase of 1,586 establishments, but a decrease of -1,881 establishments, for a net loss of -295 establishments. That’s a smaller percentage change than previous years, which reflects somewhat of a deceleration in industry consolidation. Full Analysis
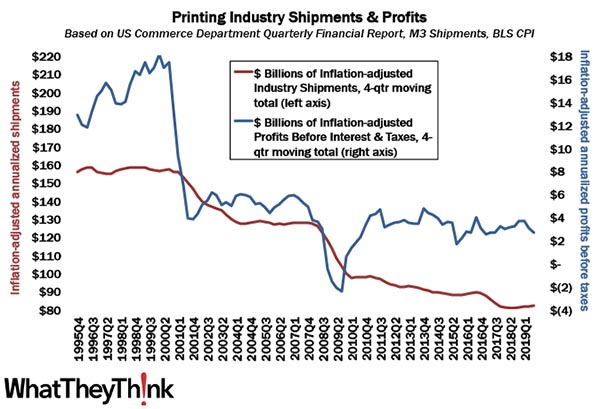
The Next Chapter in the Printing Profits “Tale of Two Cities”
Published: December 20, 2019
Industry profits data for the third quarter of 2019 were down from $3.05 billion in Q2 to $2.65 billion. Large printers continue to be the trouble spot. Full Analysis
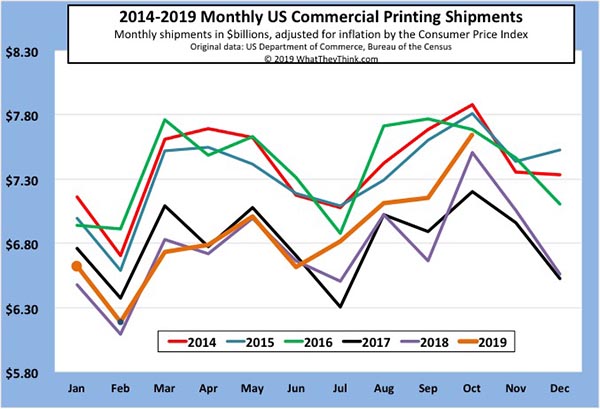
October Printing Shipments: Raise a Glass of Holiday Cheer
Published: December 13, 2019
The value of printing shipments for October 2019 was $7.65 billion—a pretty big jump from September’s $7.14 billion. October has become the biggest month of the year, and this is the best October the industry has had since 2016. Full Analysis
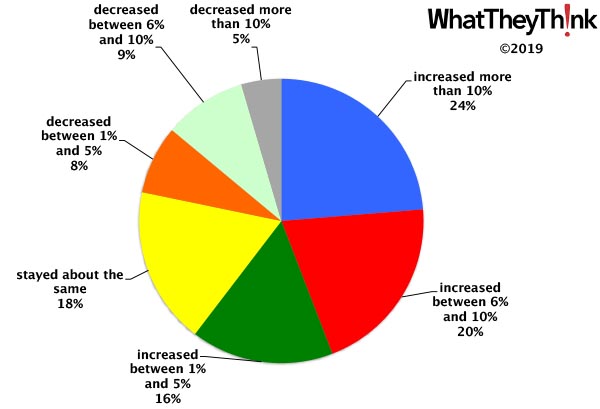
First Look: Industry Business Conditions 2019
Published: December 6, 2019
Preliminary results from our 2019 Business Outlook Survey show that one-fourth (24%) of survey respondents reported that, compared to 2018, revenues for 2019 were up more than 10%. That’s the highest this has been since we started our annual survey in 2015. Elsewhere, though, things are a bit more muted. Full Analysis
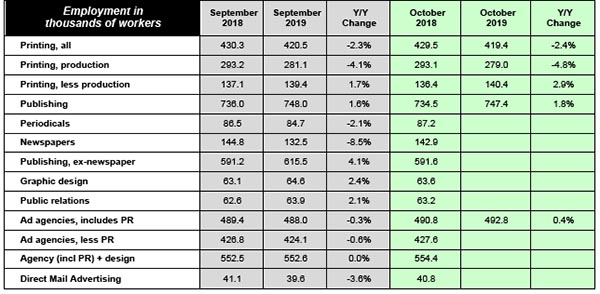
October Jobs: Production Down, Managerial Up
Published: November 22, 2019
In October, overall printing employment dropped -0.3% from September. On a year-over-year basis, though, it was down -2.4%. Production employment was down -0.7% from September to October, but year-over-year was down -4.8%. On the other hand, non-production employment was up +0.7% from September to October, and year-over-year was up +2.9%. Full Analysis
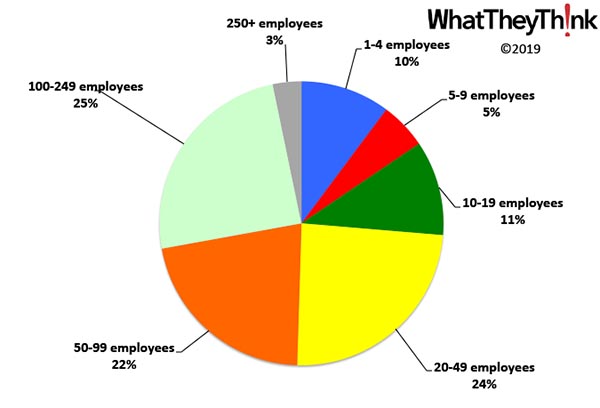
Paperboard Container Manufacturing Establishments—2016
Published: November 15, 2019
In 2016, there were 1,971 establishments in NAICS 32221 (Paperboard Container Manufacturing). One-half of these establishments have 50 or more employees, and three-fourths have 20 or more employees. Full Analysis
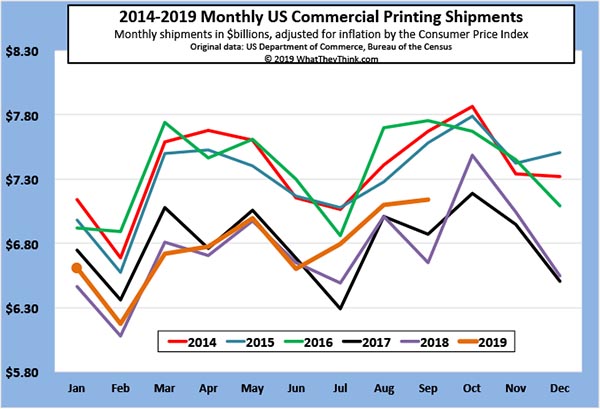
No Fall for Printing Shipments
Published: November 8, 2019
Heading into Fall 2019, the value of printing shipments for September 2019 was $7.14 billion—up from August’s $7.10 billion. It’s not a huge rise, but given that for the last few years September shipments declined from August’s, we’ll take it. Full Analysis
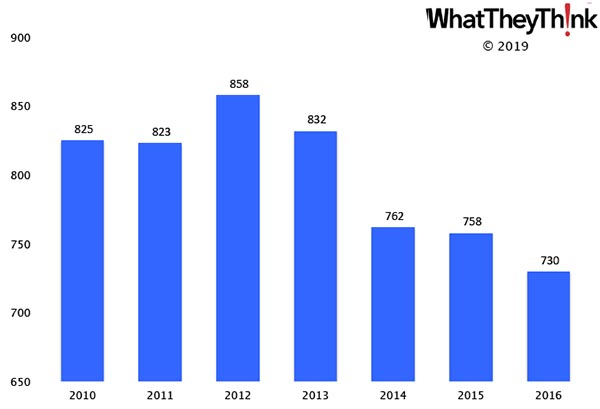
Paper Bag and Coated and Treated Paper Manufacturing—2010–2016
Published: November 1, 2019
In 2010, there were 825 establishments in NAICS 32222 (Paper Bag and Coated and Treated Paper Manufacturing). By 2016, that number had declined for a net loss of -12% to 730. Full Analysis
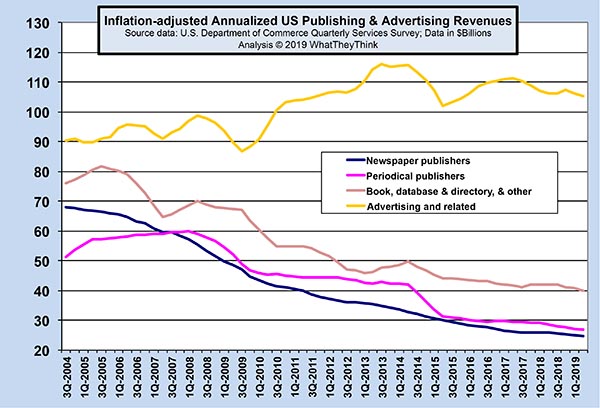
The View from the Other Side: Print Buyers’ Revenues
Published: October 25, 2019
Publishing and advertising are among the biggest print-buying markets. Last month, the Census Bureau released its Quarterly Services Survey, which reported revenues for these markets. Publishers’ revenues continue their long decline, while the up-and-down of advertising revenues indicate the extent to which the nature of advertising is changing. Full Analysis
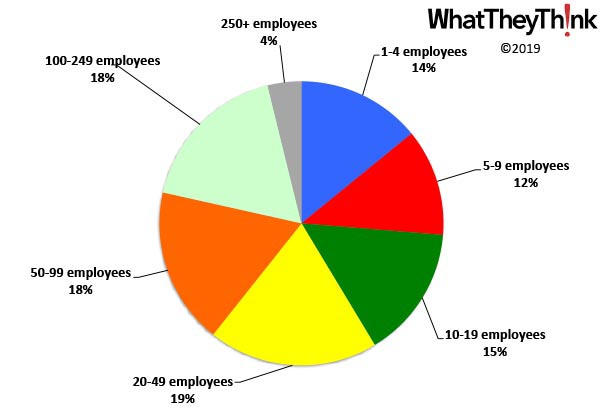
Paper Bag and Coated and Treated Paper Manufacturing Establishments—2016
Published: October 18, 2019
In 2016, there were 730 establishments in NAICS 32222 (Paper Bag and Coated and Treated Paper Manufacturing). Nearly four out of 10 (39%) have 50 or more employees, and 59% have 20 or more employees. Full Analysis
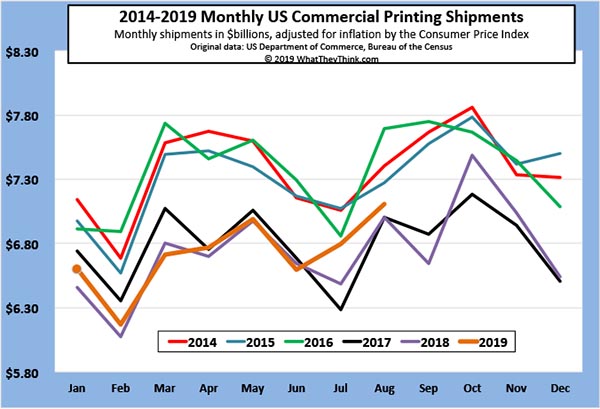
Printing Shipments: The Dog Days of Summer Didn’t Bite
Published: October 11, 2019
The value of printing shipments for August 2019 was $7.1 billion—up from July’s $6.8 billion. As we head into the autumn, 2019 is shaping up to be the best year for the industry in three years. Full Analysis
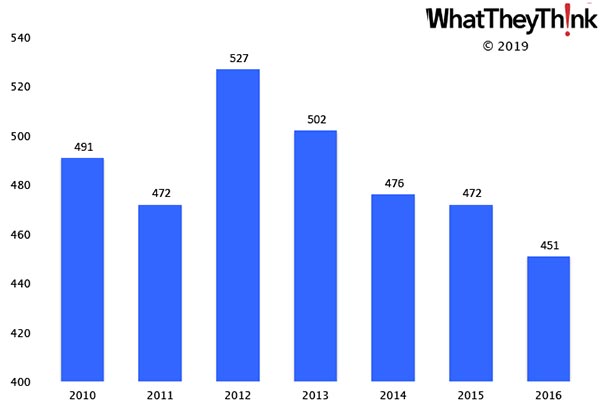
Folding Paperboard Box Manufacturing Establishments—2010–2016
Published: October 4, 2019
In 2010, there were 491 establishments in NAICS 322212 (Folding Paperboard Box Manufacturing). By 2016, that number had declined for a net loss of -8% to 451. Full Analysis
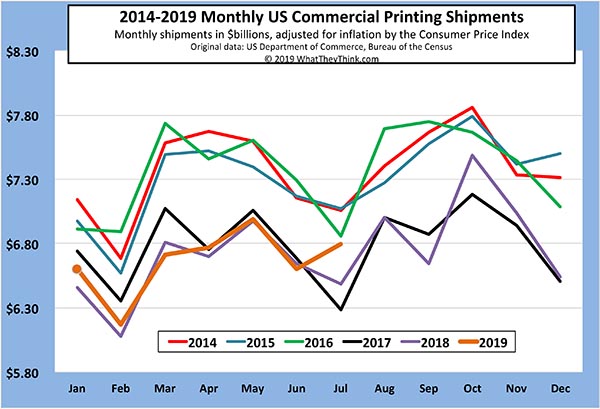
Printing Shipments: Summer Surprise
Published: September 27, 2019
The value of printing shipments for July 2019 was $6.8 billion—up from June’s $6.6 billion. Breaking with seasonality, what has typically been one of the lowest months of the year for printing shipments actually came in pretty good. Full Analysis
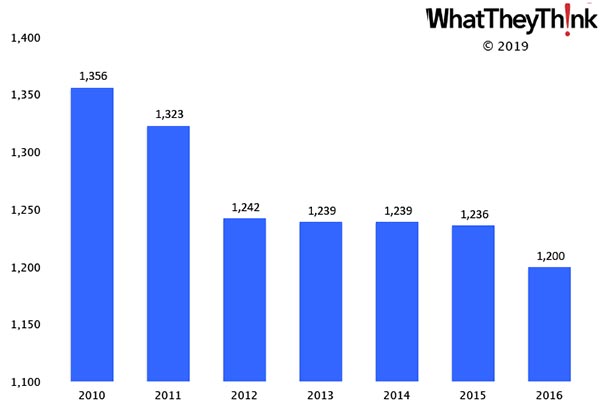
Corrugated and Solid Fiber Box Manufacturing Establishments—2010–2016
Published: September 20, 2019
In 2010, there were 1,356 establishments in NAICS 322211 (Corrugated and Solid Fiber Box Manufacturing). By 2016, that number had declined -12% to 1,200. Full Analysis
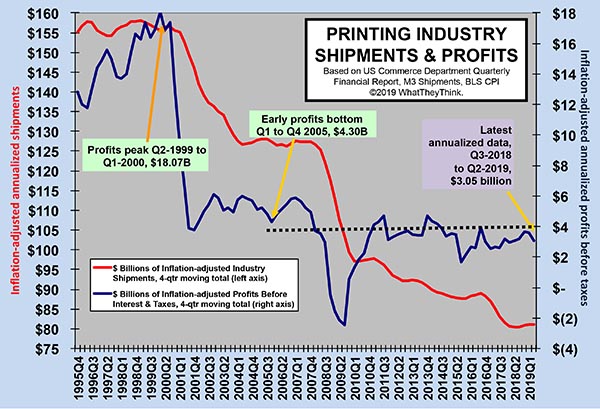
Industry Profits: Mind the Gap
Published: September 13, 2019
Annualized profits for the second quarter of 2019 were down from $3.61 billion in Q1 to $3.05 billion. However, the gap between large and small printers has only narrowed very slightly. Full Analysis
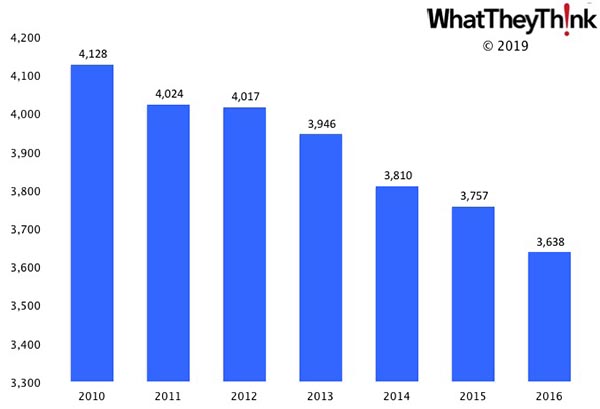
Converted Paper Product Manufacturing Establishments—2010–2016
Published: September 6, 2019
In 2010, there were 4,128 establishments in NAICS 3222 (Converted Paper Product Manufacturing). By 2016, that number had declined -12% to 3,638. Full Analysis
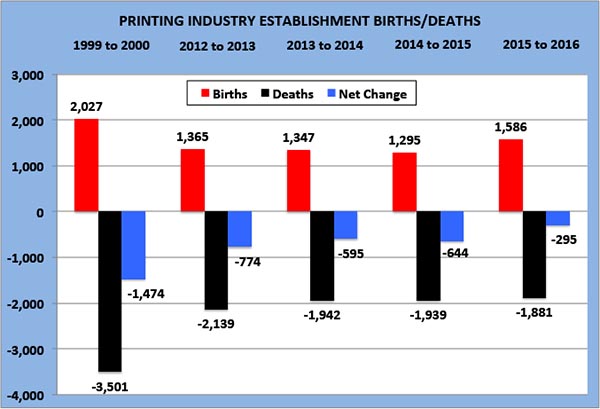
Printing Establishment Births and Deaths
Published: August 30, 2019
From 2015 to 2016, there was an increase of +1,586 printing establishments and a decrease of -1,881 establishments, for a net loss of -295 establishments. Full Analysis
Folding Paperboard Box Manufacturing Establishments—2016
Published: August 23, 2019
In 2016, there were 451 establishments in NAICS 322212 (Folding Paperboard Box Manufacturing). More than half of these establishments (57%) have 50 or more employees and more than three-fourths (79%) have 20 or more employees. Full Analysis
June Printing Shipments: The Dog Days of Summer Begin
Published: August 16, 2019
Printing shipments for June 2019 were—as expected—down from May, and came in slightly below June 2018. Full Analysis
Corrugated and Solid Fiber Box Manufacturing Establishments—2016
Published: August 9, 2019
in 2016, there were 1,200 establishments in NAICS 322211 (Corrugated and Solid Fiber Box Manufacturing). About half of these establishments (49%) have 50 or more employees and more than two-thirds (71%) have 20 or more employees. Full Analysis
June Jobs: Up in the Short Term, Down in the Long Term
Published: August 2, 2019
In June, overall printing employment grew +0.5% from May to June 2019. On a year-over-year basis, it is down -2.5%. Production employment was up +0.4% from May to June, but year-over-year was down -4.9%. Non-production employment was up +0.7% from May to June, and year-over-year was up +2.6%. Full Analysis
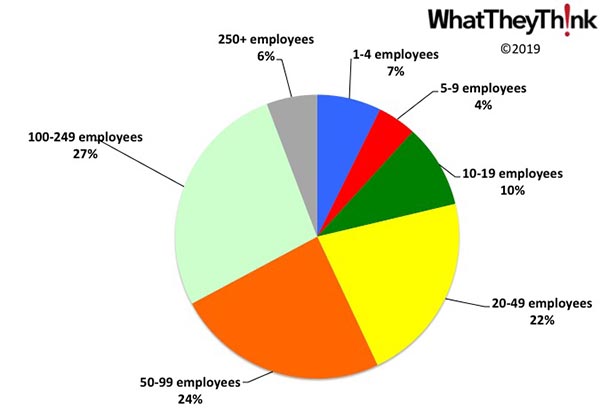
Converted Paper Product Manufacturing Establishments—2016
Published: July 26, 2019
in 2016, there were 3,638 establishments in NAICS 3222 (Converted Paper Product Manufacturing). More than four out of 10 of these establishments (42%) have 50 or more employees and two-thirds (65%) have 20 or more employees. Full Analysis
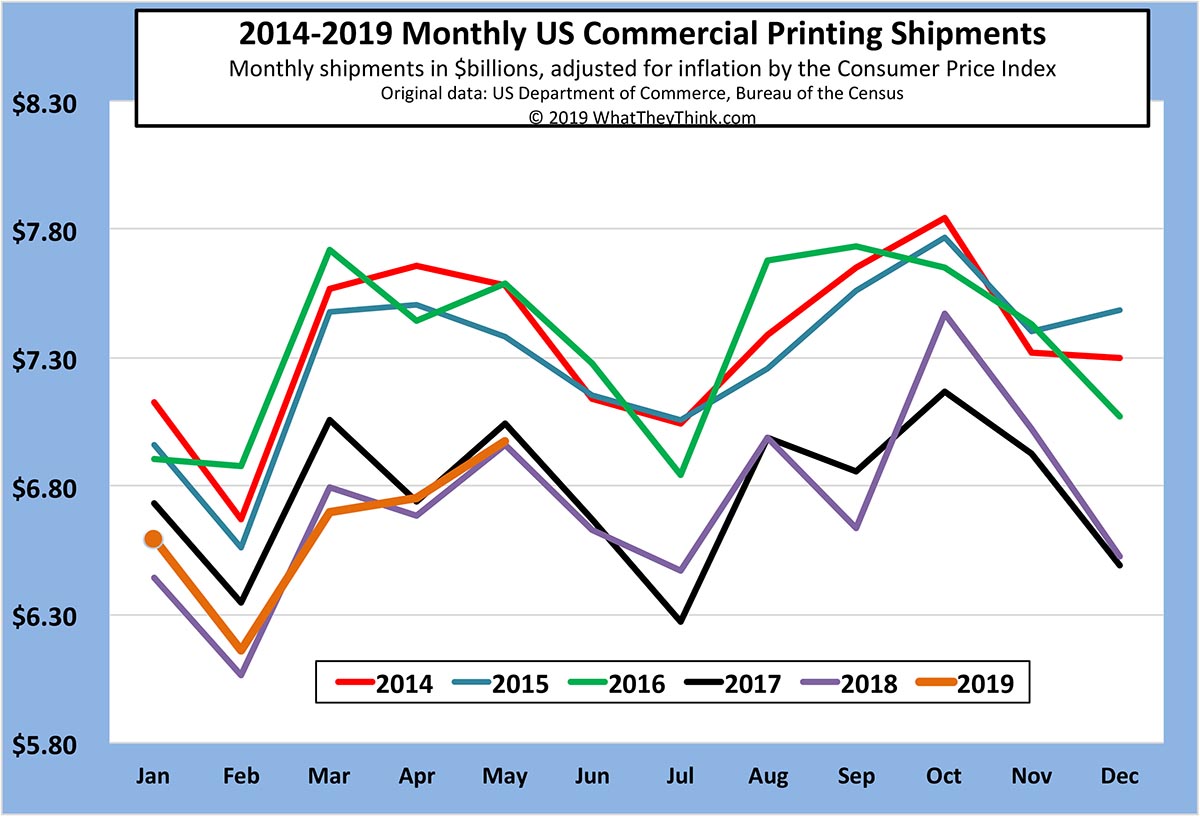
May Printing Shipments Up from April
Published: July 19, 2019
Printing shipments for May 2019 were up from April—and even came in above May 2018 shipments, albeit only very slightly. Full Analysis
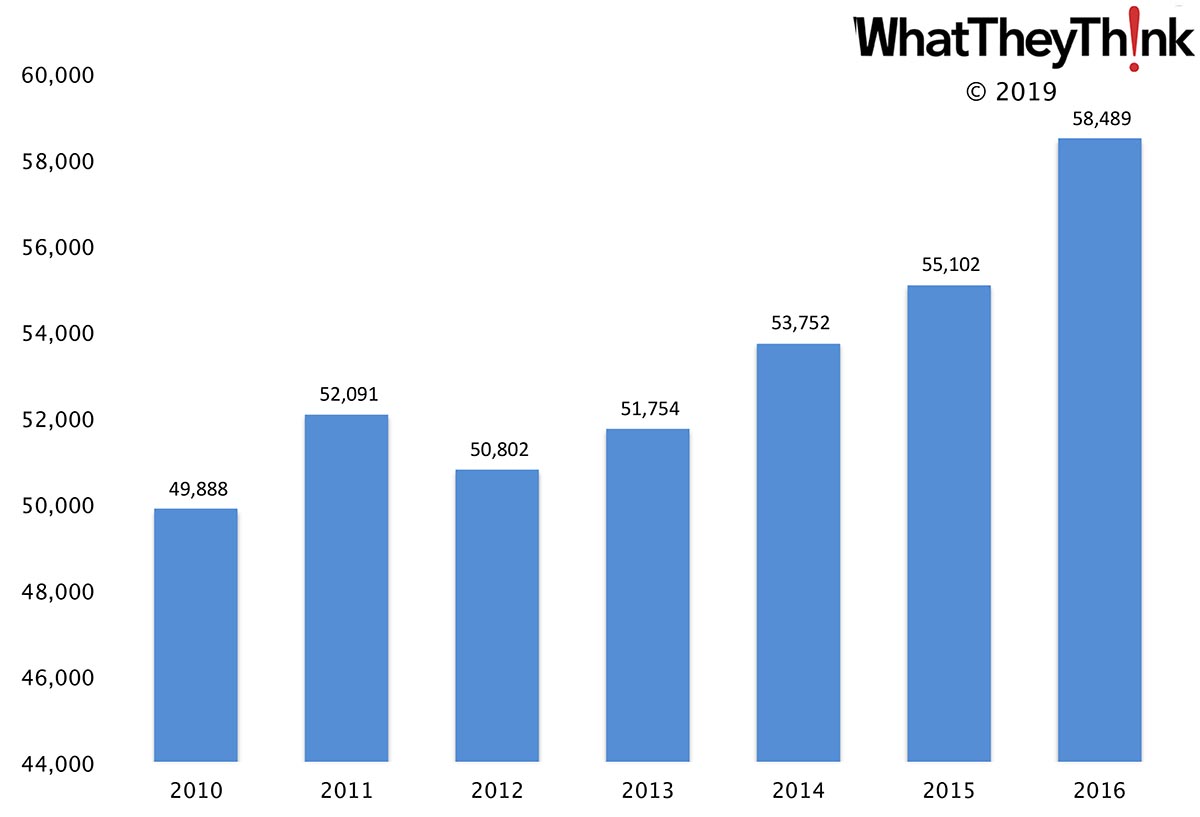
PR Agency Employees—2010–2016
Published: July 12, 2019
In 2016, there were 58,489 employees in establishments in NAICS 54182 (Public Relations Agencies). Employment in this category has grown +17% from 2010 to 2016. Full Analysis
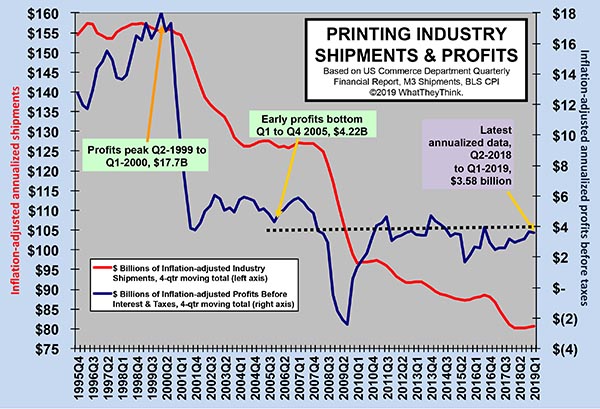
Printing Industry Profits: What Goes Up...
Published: June 28, 2019
Industry profits data came out earlier this month, and overall profits slipped a little. Annualized profits for Q1 2019 were $3.58 billion, down slightly from $3.66 billion in Q4 of last year. Again, it’s the large printers that are dragging down overall industry profitability. Full Analysis
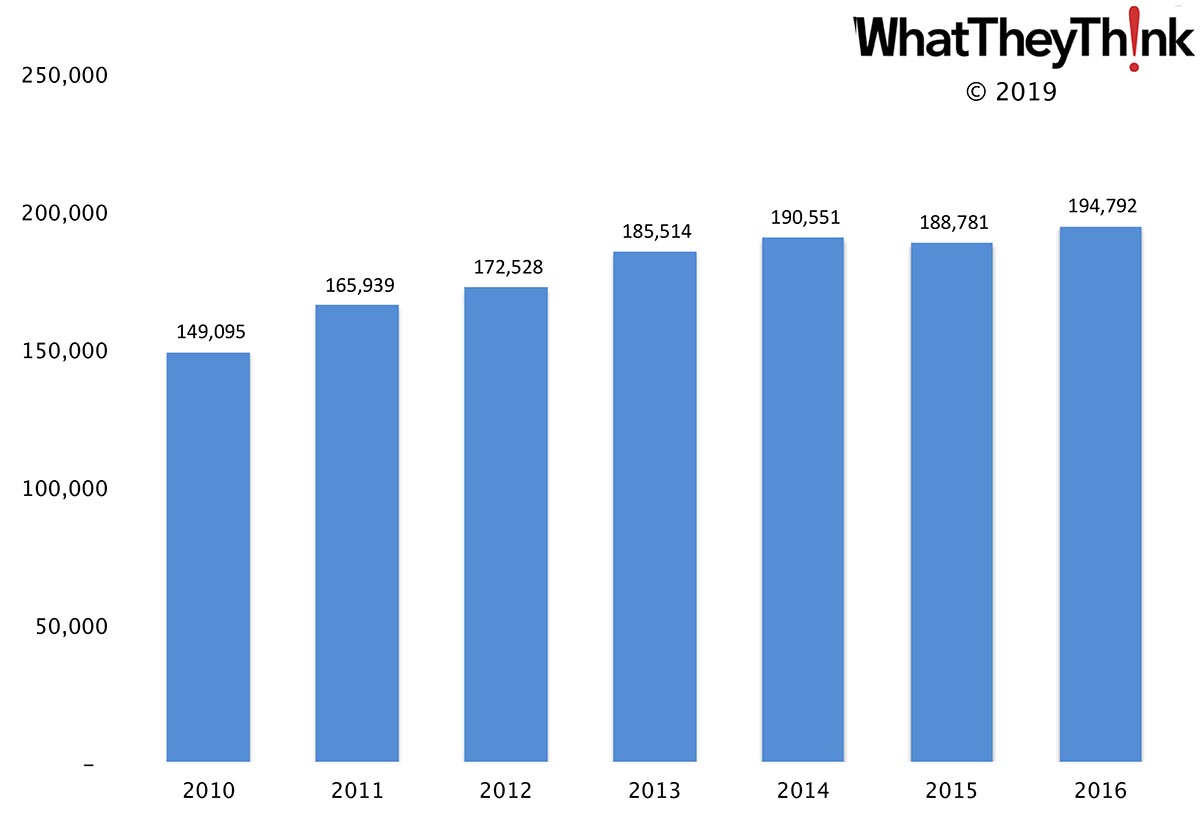
Advertising Agency Employees—2010–2016
Published: June 21, 2019
In 2016, there were 194,792 employees in establishments in NAICS 54181 (Advertising Agencies). Employment in this category has grown +31% from 2010 to 2016. Full Analysis
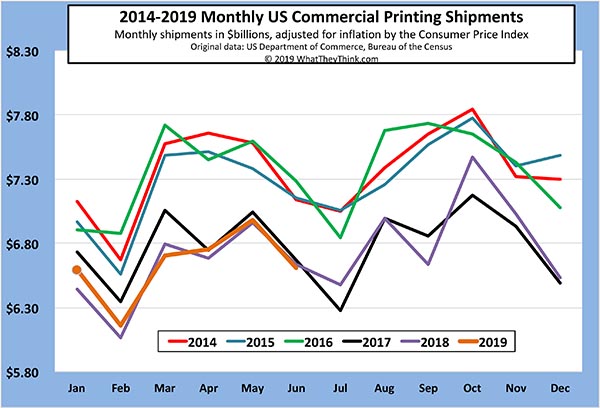
April Printing Shipments—A New Season?
Published: June 14, 2019
Printing shipments for April were up from March, happily disrupting what has become the usual seasonal pattern. Even better, April 2019 shipments came in above April 2018 shipments. Full Analysis
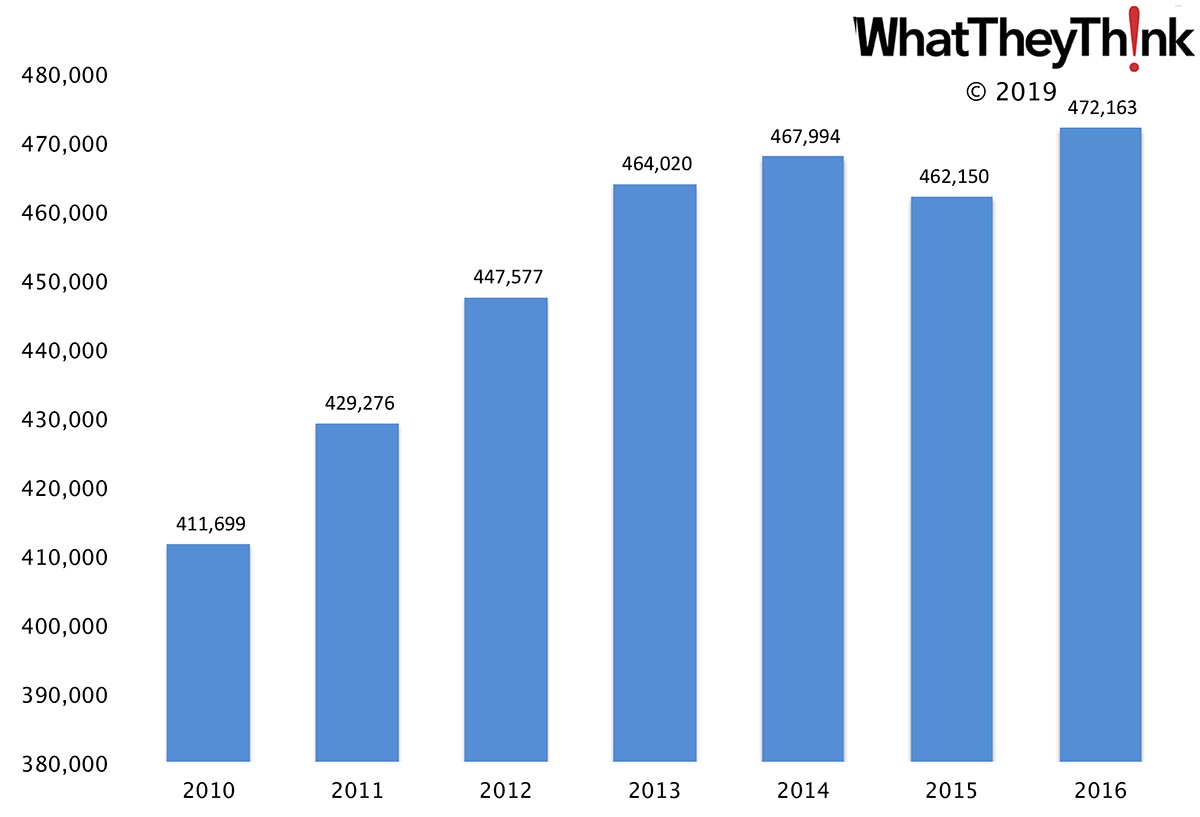
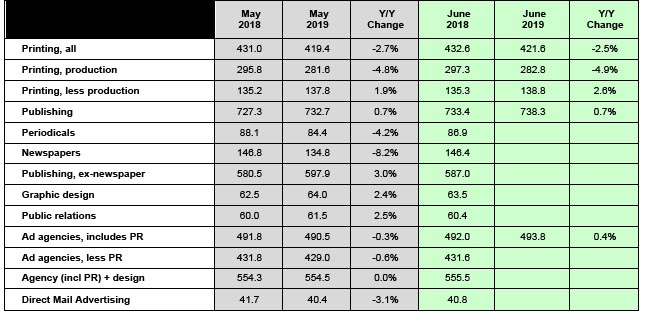
Advertising, Public Relations, and Related Services Employees—2010–2016
Published: June 7, 2019
In 2016, there were 472,163 employees in establishments in NAICS 5418 (Advertising, Public Relations, and Related Services). Employment in this category has grown +15% from 2010 to 2016. Full Analysis


![]()
- KYOCERA NIXKA INKJET SYSTEMS (KNIS) INTRODUCES BELHARRA, THE NEW WAVE OF PHOTO PRINTERS
- New RISO Printing Unit Offers Easy Integration for Package Printing
- March 2024 Inkjet Installation Roundup
- Inkjet Integrator Profiles: Integrity Industrial Inkjet
- Revisiting the Samba printhead
- 2024 Inkjet Shopping Guide for Folding Carton Presses
- The Future of AI In Packaging
- Inkjet Integrator Profiles: DJM

WhatTheyThink is the official show daily media partner of drupa 2024. More info about drupa programs
© 2024 WhatTheyThink. All Rights Reserved.