When industries grow, market research and other statistical efforts tend to be easy, and errors to the upside are easy to shrug off. When industries experience declines in demand, the structural adjustments of plant closures and merger and acquisition activities (including tuck-ins) affect industry data. Researchers need to project the size of the industry and measure its trends. When changes in demand are negative and consolidation activities are strong, that job becomes more difficult.
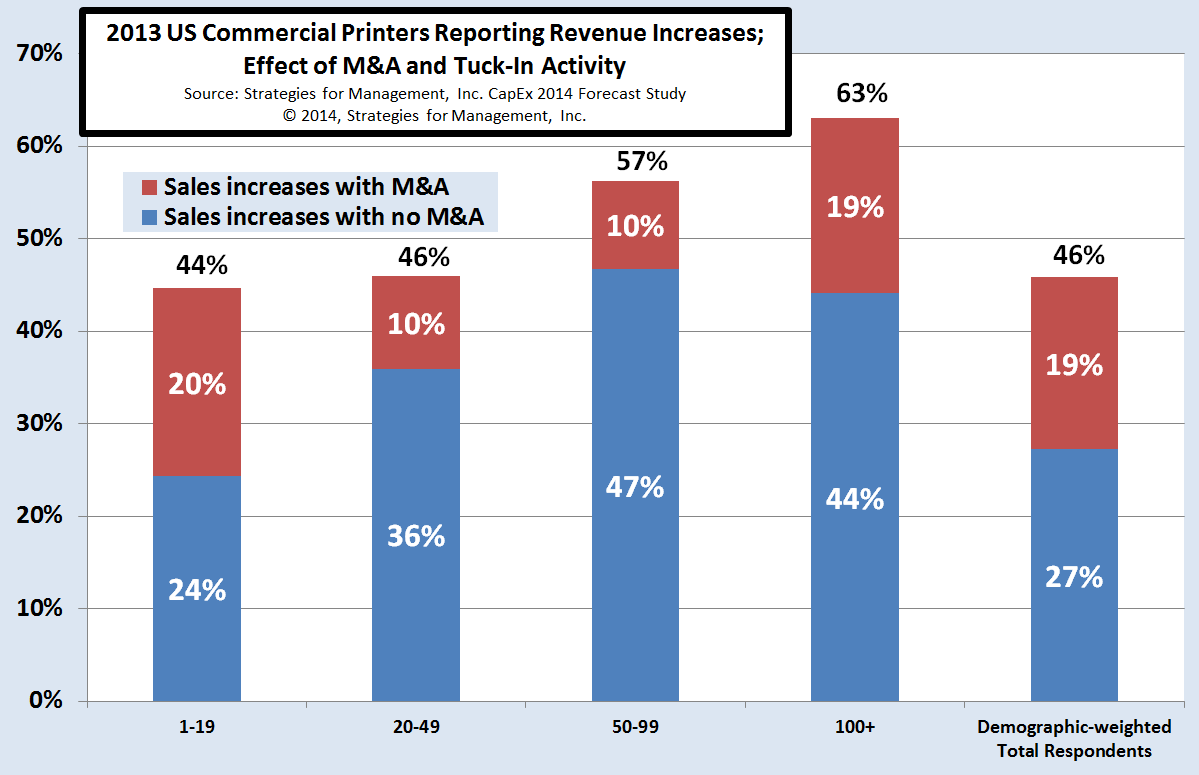
In a survey we conducted recently, we asked a typical question about business conditions. Because we know that merger activities of all types (including tuck-ins) were common in recent years, we asked respondents if their increases were affected by that activity. (click chart to enlarge)
Increases that included the additional sales volume of consolidation varied by employee size. Almost half of the establishments with 1 to 19 employees had increases that included M&A. About 1 in 6 of establishments with 50 to 99 employees were affected, the lowest rate of the industry. Taking that into account, the number of establishments with sales increases of any size was not really 46%. After adjusting for businesses with increases including M&A, only 27% had organic increases in sales volume.
Had the question not been asked, it would have been assumed that more than half of responding printers had organic sales increases. That would have been true, but if used to project the size of the industry, it could have led to making incorrect decisions because it did not account for other critical industry factors.
Most consolidations are undetected because they are done by small businesses, and often accomplished by two businesses closing and one new business opening. Because the previous separate owners are the same as the new owners, they consider it to be just another step on their journey in the same industry. In other cases, there are establishments that cannot combine, and just close. Their business is absorbed by the remaining ones. This factor is called survivorship.
Below is an updated example I have used in the past:
- Assume there are three printing companies in a geographic area, all with the same sales volume, but one is healthy, one is mediocre, and one is very sick.
Healthy printer's sales volume: $100
Mediocre printer's sales volume: $100
Sick printer's sales volume: $100
Total market: $300
- The consumption of print declines to 250 from the original 300, and hits the sick printer the hardest.
Healthy printer's sales volume: $100
Mediocre printer's sales volume: $90
Sick printer's sales volume: $60
Total market: $250
- The sick printer realizes that costs can’t be covered, and goes out of business. That business is absorbed by the others.
Healthy printer's sales volume: $130
Mediocre printer's sales volume: $120
Sick printer's sales volume: $0
Total market: $250
- The healthy printer notes that sales are up 30%, and the mediocre printer notes that sales went from 90 to 120, business is up 33%. On an aggregate basis, sales of print are down $50, or -17%.
In surveys, is called "survivor bias." It explains a difficulty in using survey data to represent a larger marketplace. Unless the survey analyst included overall industry size in their analysis, they would have been misled into thinking that sales volumes were up by 30% or more. Instead, the market contracted even though the survey "said" otherwise.
The concept of economic survivorship is not about surveys but is a real process. The attrition and absorption effect illustrated above shows the effect of industry consolidation in an industry with declining aggregate volume. Those effects appear to be in full force at this time.
The main danger is attributing revenue growth rates of individual businesses and assuming they apply to the overall industry. The decreasing number of firms needs to be applied to the process.
How can executives and researchers figure out what's really happening? It's not that the survey data are wrong, it's that it survey data is just one input that needs to be placed in context. This is why all good research has a combined "top-down" and "bottom-up" approach. The survey data are the bottom-up input. The top-down are larger perspectives of aggregate industry data such as employment and total industry shipments.
Together, the two approaches provide a better perspective. While an industry declines, there are individual establishments that are growing, making new investments, absorbing the revenues of deceased establishments, and replacing obsolete capital and approaches with more effective ones.
This is why it is very important to not rely on not just one source of data, but a collection of them. This underscores the value of an experienced executive who seeks data from many sources, including personal experience, and makes strategic decisions based on those multiple inputs.
Because total industry shipments and employment are declining it is easy to miss the reallocation of industry capital being driven by dynamic businesses and entrepreneurial owners. To turn an old saying on its head, don't miss the trees because the forest is in the way.
# # #