Commentary & Analysis
Friday's Employment Data: All This Dynamic Inertia and No Place to Go
Last Friday'
Last Friday's employment report showed that the unemployment rate went up to 7.6% but the change was so minor that it was basically the same we've been seeing for a few months. The there are many trends buried in the tables that are more interesting than the unemployment rate.
On a net basis with revisions of prior data, the payroll survey was up +163,000, but that was no big deal. Payroll surveys increases have not been big enough to show anything but an economy mired in sluggish +1.5-2.5% growth, well below post-WW2 levels of +3.3%-3.4%. Think of the payroll survey as people who get weekly paychecks and W2s.
The household survey is the report where all workers are included, such as self-employed and freelancers (basically those who pay social security with their income tax). The household survey is what is used to calculate the unemployment rate. That showed a +319,000 increase in employment. Last year, the unemployment rate was 8.2%, and now it is 7.6%. The number of unemployed workers was 12.7 million and now it is 11.8 million. The labor participation rate was 63.8%, and now it is 63.4%. There are almost 1.6 million more workers today than there were last year, but 1.7 million people no longer consider themselves part of the labor force.
The sluggish economic conditions and adjustment to the Affordable Care Act is plainly seen in the data for part-time work. Of the +319,000 increase in employment in the household survey, 194,000 of them, or almost two-thirds, could only find part-time work. On an aggregate basis, experienced workers are the ones finding work. Re-entrants to the workforce was 182,000 in May, and the number of new entrants fell by -12,000. Of the 1.6 million more workers employed since last year, 1.2 million are 55 years or older. Of those, half are 65 or older.
Overall, there were encouraging and discouraging data in the report, hence its sluggishness. “Dynamic inertia” was what a former boss used to describe lots of activity but staying in the same place. Here we are.
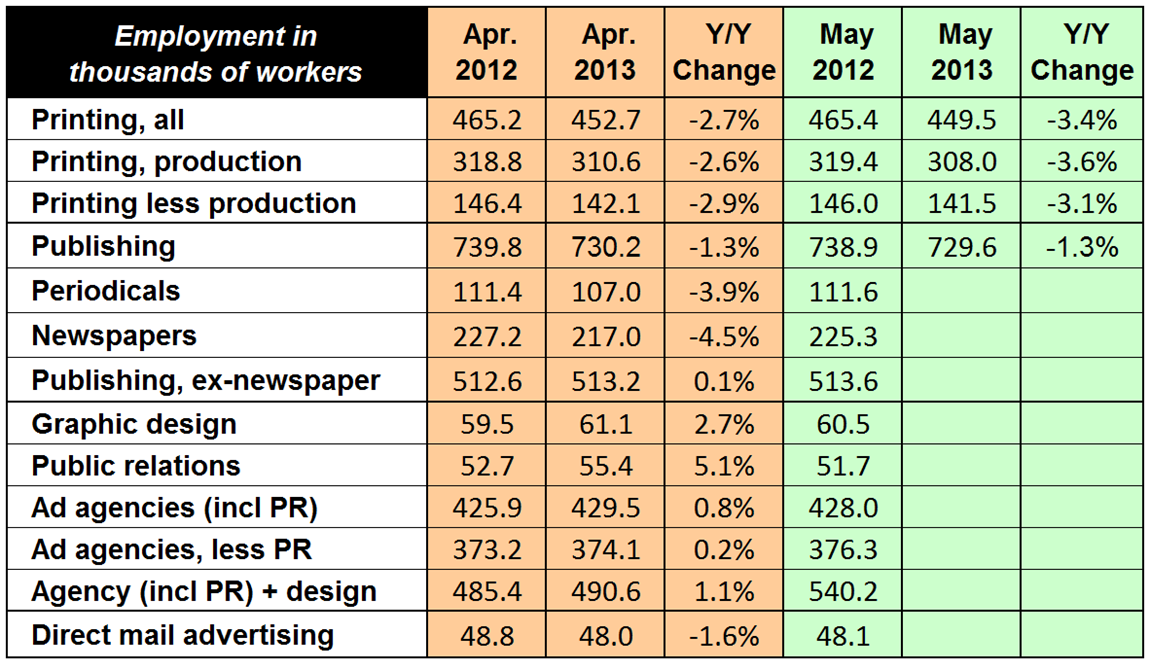
For our industry, here is the latest employment chart (click to enlarge)
About Dr. Joe Webb
Dr. Joe Webb is one of the graphic arts industry's best-known consultants, forecasters, and commentators. He is the director of WhatTheyThink's Economics and Research Center.
Video Center


![]()
- KYOCERA NIXKA INKJET SYSTEMS (KNIS) INTRODUCES BELHARRA, THE NEW WAVE OF PHOTO PRINTERS
- New RISO Printing Unit Offers Easy Integration for Package Printing
- March 2024 Inkjet Installation Roundup
- Inkjet Integrator Profiles: Integrity Industrial Inkjet
- Revisiting the Samba printhead
- 2024 Inkjet Shopping Guide for Folding Carton Presses
- The Future of AI In Packaging
- Inkjet Integrator Profiles: DJM

WhatTheyThink is the official show daily media partner of drupa 2024. More info about drupa programs
© 2024 WhatTheyThink. All Rights Reserved.