This month's recovery indicators had just a minor stumble, as the ISM Non-manufacturing new orders tripped over a pebble; otherwise, all of the indicators are higher than last month. (click chart to enlarge)
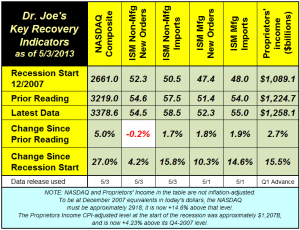
The new orders index is still above its level at the start of the recession and indicates moderate growth. The same is true for all of the other ISM components. The NASDAQ was up 5% since last month, and is now +14.6% above the level at the start of the recession, more than five years ago. From an annual return basis comparing this point to here, it's not good. If you dollar-cost-averaged throughout the period, you did well. The NASDAQ rise was all the more notable in that it occurred after the drop of Apple from the high $600s to the low $400s, so other companies have picked up the slack.
Let's not get too crazy though, as other economic data still have problems. Last week's
GDP was not particularly good, but it looks like the next revision of the Q1-2013 data will be slightly higher because the trade deficit was lower in this week's report. While this makes GDP bookkeeping appear better, the lower trade deficit has often indicated that fewer raw materials and minerals are being imported. That has usually been a contrary indicator (for me, at least) than the business press, which loves to hear that the trade deficit is shrinking. As the US energy market has been changing because of increased domestic oil production, this indicator may not be as reliable as it used to be. The trade deficit says nothing about where value is created (don't make me use the Starbucks example of us being better off if they bought domestic coffee grown in North Dakota).
The unemployment report issued on
Friday, May 3, was yet another one where the package looked nice on the outside, but not so good on the inside, indicating continuing sluggish growth. The unemployment rate fell to 7.5%, even as there was an increase in the size of the workforce. The Bureau of Labor Statistics often uses an important phrase, "little changed," which means that even though the percentage may go up or down by a tenth of a decimal point, it was virtually the same on a statistical basis as their last report. The phrase was used this month, but that doesn't stop the cable TV talking heads, of course.
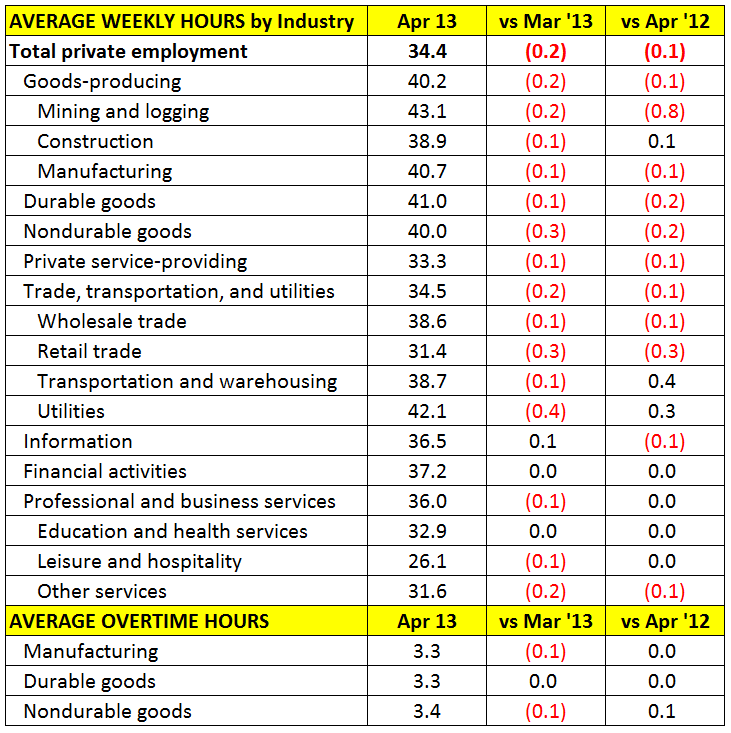
As we peer deeper into the report, the household survey showed +293,000 more employed workers than last month, and an increase in the workforce by +210,000. The labor participation rate was unchanged, at 63.3%, still at 35-year lows. What's more interesting is what is happening to hours worked. In nearly every category, the number of hours declined. (click chart to enlarge)

We may be seeing the gradual reshaping of the workforce, especially by small businesses, as they adjust their staffing to deal with the upcoming costs and regulations of the Affordable Care Act. Many workers will qualify for coverage based on the number of hours they work. By cutting hours back for each worker, and by adding more part time workers, they may be attempting to manage their potential health care coverage costs. Or, things may be slowing down. Or it's a combination of both. The way this economy has been going, Harry Truman's desire for a one-handed economist cannot be met. An economists is more like an octopus lately.
Overall, the economy is still going sideways with a slight upward tilt. The probability of recession in that kind of economy is always higher than usual, but I believe muddling through will remain the order of the day.
And before I forget...
...that hot stock market is supposedly setting new highs. It's not, except for the Russell 2000, which closed at 954 on Friday, slightly above its all-time inflation-adjusted high. The Dow has to hit in the range of 15,900, the S&P about 2000, and the NASDAQ about 6400. The Dow has the best chance of doing so, needing less than 1000 more points to do so. The S&P has to rise about one-third, and the NASDAQ has to almost double. That's a tall order.
# # #