Commentary & Analysis
GDP Report Shows Struggling Economy; Should You Use GDP as a Benchmark?
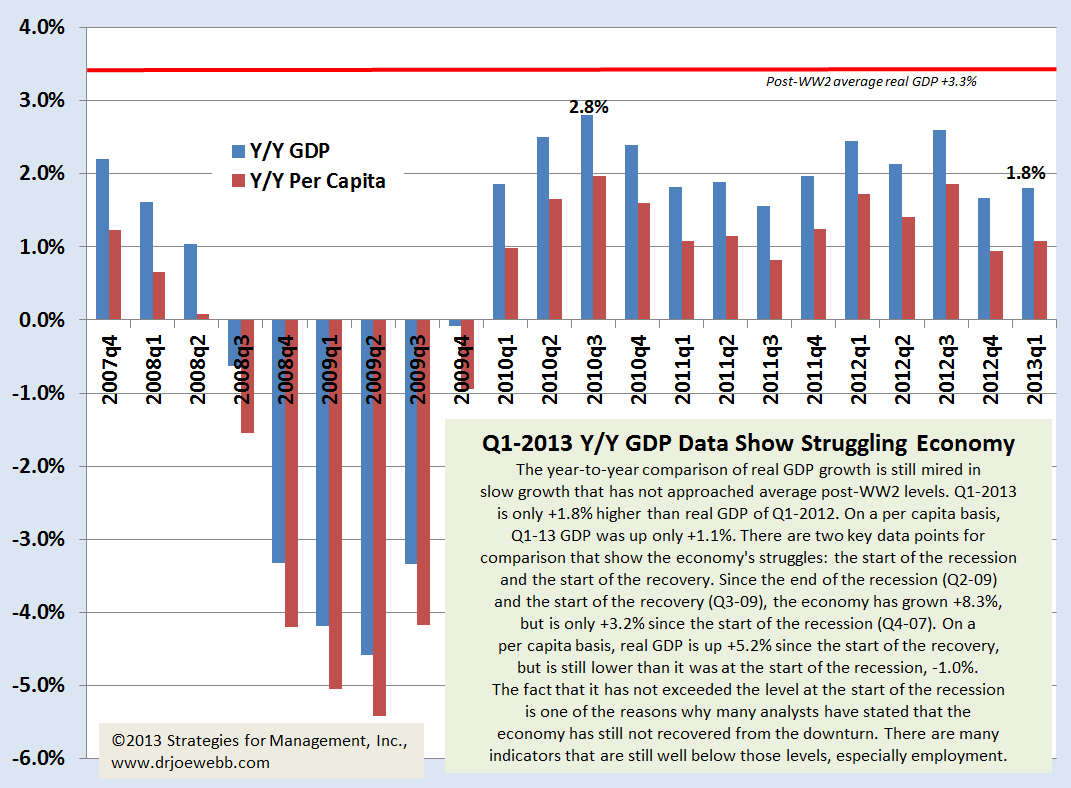
Last Friday'
Last Friday's GDP report for Q1-2013 came in lower than expectations at +2.5%. That is an annual growth rate compared to Q4-2012. That looked like a pickup in activity compared to Q4-2012 which was +0.4%. Because of the changes in tax rates, there were distortions in the Q4 data as companies reduced spending, slowing real GDP growth, and shifting the expenses to Q1. This affected recent reports of incomes as well, so it is probably better to average the two quarters, which would be about +1.45%. Even better is to look at GDP on a year-to-year basis, since businesses make long term decisions and have trouble discerning what short-term fluctuations mean, suspicious that they are just statistical estimation errors. (click chart to enlarge)
About Dr. Joe Webb
Dr. Joe Webb is one of the graphic arts industry's best-known consultants, forecasters, and commentators. He is the director of WhatTheyThink's Economics and Research Center.
Video Center


![]()
- KYOCERA NIXKA INKJET SYSTEMS (KNIS) INTRODUCES BELHARRA, THE NEW WAVE OF PHOTO PRINTERS
- New RISO Printing Unit Offers Easy Integration for Package Printing
- March 2024 Inkjet Installation Roundup
- Inkjet Integrator Profiles: Integrity Industrial Inkjet
- Revisiting the Samba printhead
- 2024 Inkjet Shopping Guide for Folding Carton Presses
- The Future of AI In Packaging
- Inkjet Integrator Profiles: DJM

WhatTheyThink is the official show daily media partner of drupa 2024. More info about drupa programs
© 2024 WhatTheyThink. All Rights Reserved.