Last week's unemployment report was like one of those snacks that looks great when it's on the shelf in the store, but when you open the package at home, it's quite different. The picture on the package looked tasty and appetizing, the stuff on the inside was stale and tasteless. The decrease in unemployment to 7.6% was just like that package. Then we looked inside and saw that the labor force shrunk by -496,000 workers, the number of employed workers fell by -206,000. Remember, the formula for the unemployment rate is
100% - (number employed) / (number of people in the workforce)
The workforce is defined as the number of employed persons plus the number of unemployed job seekers.
So, the number of employed workers fell but the number of job seekers fell more. That made the denominator shrink, so the unemployment rate calculation improved.
The Bureau of Labor Statistics has two employment surveys. You may have heard that employment went up by +88,000. That's from the payroll survey; the numbers mentioned above are from the household survey. Think of it this way: the payroll survey is the count of workers who get W-2s. The household survey covers those workers and freelancers who get 1099s, proprietors and partners, and others, who submit their income on Schedule C and similar pages of their tax returns. The household survey is broader, and that's why it's used to calculate the unemployment rate.
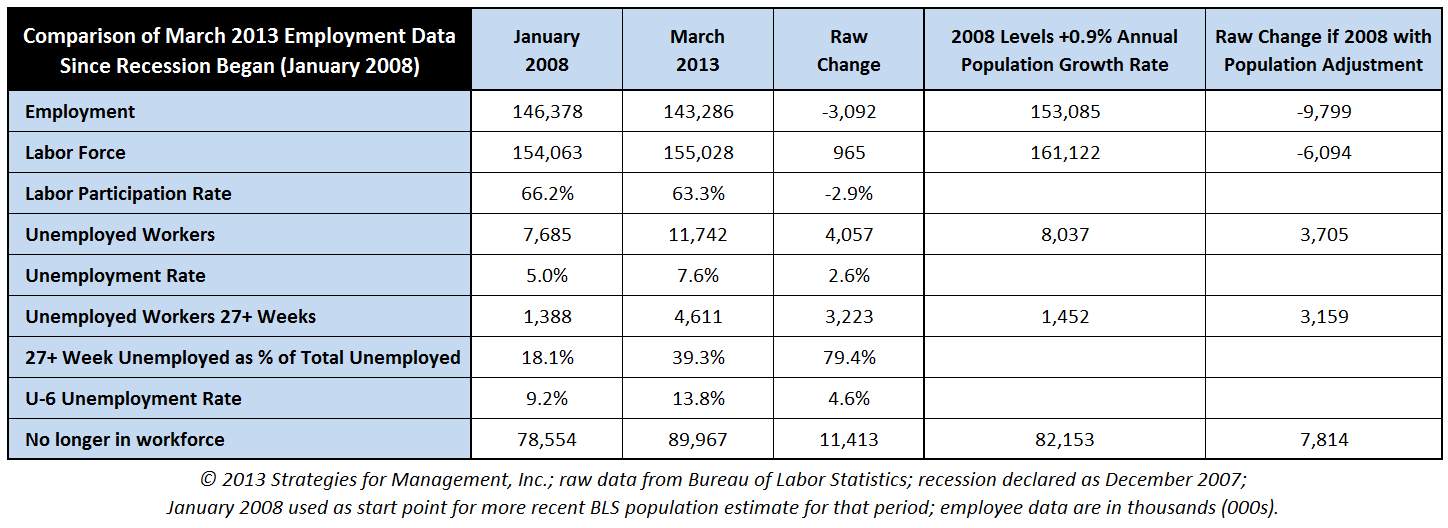
The table below compares the latest unemployment report with that of January 2008. The recession was declared by the academic panel that concerns itself with such matters as beginning in December 2007. The BLS updates its population estimates every January, so it is judicious to use those 2008 data to represent that moment because it is just a month after the recession began and would include corrections to data that they had been working on in all of 2007. (click to enlarge; it may also be worthwhile to print out so it is easier to follow the discussion in the rest of this blogpost).
Since January 2008, employment is down by nearly -3.1 million, and the labor force has risen by almost +1 million workers. The participation rate is down by 2.9 percentage points. The number of unemployed workers has increased by about +4 million workers, with the unemployment rate moving from 5% to 7.6%. Full employment is generally considered to be between 4% and 6%. The number of long-term unemployed (27 or more weeks) has more than tripled, moving from about 1.4 million workers to more than 4.6 million. They went from 18% of the unemployed to almost 40%, and are almost 80% of the total increase in the unemployed workers.
The BLS offers a wider definition of unemployment that includes discouraged workers, referred to as "U-6." That has increased from 9.2% to 13.8%. Finally, the number of persons no longer in the workforce has increased by 11.4 million. Even the U-6 calculation drops unemployed workers out of its estimate eventually, and this appears to be what is happening.
This slow economic period has lasted a long time, and there are many analysts who believe that the economy never ended its recession. The date of a recession is set at the last high of economic measures like GDP and employment; they do not use just one factor, as recession dating is by consensus of an academic panel that assesses many factors. When the economy reaches its lowest point, that is the end of the recession and the start of a recovery. When the recovery passes the levels that were seen at the start of the recession, the recovery is over, and a new cycle begins. A "double dip" means that the economy started to recover and then fell again, or that the period of recovery was very short. According to GDP data, the recovery began in June 2009 and was completed with the fourth quarter of 2010. From a GDP perspective, if a recession should start now, it would be a new one, and would not be a "double dip." Technically, there is no such thing as a "double dip" in economic terms, but it is a useful metaphor in describing what's happening to non-economists.
For those who believe that the recovery never completed, their strongest argument is that employment has actually contracted. Their contention usually relates to GDP and other data series being adjusted for inflation using a method that understates inflation and therefore makes those measures seem better than they are. It's always been my contention that no one has to manipulate the data with nefarious intentions because the data are bad enough on their own.
One of the key problems in making historical economic comparisons, however, is not just inflation, but also population. The US population grows at a rounded rate of 1% per year, but it's actually closer to 0.9%. In those terms, 2008 was a long time ago. Adjusting the 2008 data for population growth of 0.9% per year yields a more accurate picture of where the economy needs to be to replicate the employment conditions of January 2008, just a month after the recession started. With that, the economy should have about 9.8 million more workers than it has today with a labor force that was approximately 6.1 million larger.
GDP for the fourth quarter was around 0% or 0.1%, depending on which revision you last saw and will be revised yet again sometime in June when historical adjustments are made to the data series. The first estimate of first quarter GDP data will be out in about two weeks, and should be at least in the 2-3% range. So the directions of employment and GDP will be different yet again. The lack of confirmation of economic growth in employment data should be disconcerting from an analytical standpoint, but is common when economies insist on moving sideways. There is always some comfort that even low growth is better than a decline, but low growth rates provide no cushion against a downturn, and makes its chances greater.
I still believe that there will be no out-and-out recession, but that the sluggish economy is a great burden, and creates longer term problems as businesses focus on efficiencies in their current operations and are fearful of expanding into new ones. Only clear-cut expansion opportunities with big after-tax and after-inflation returns get funding, while other opportunities are perceived as so risky that even Treasury bonds that pay 2% or less, and do not keep up with inflation, are considered as "safe." It takes a while for that psychology, and those calculations, to change.
# # #