 There were some movements in the indicators from the Institute for Supply Management non-manufacturing indices, the biggest being non-manufacturing imports, which is now at 50, or neutral. Even though new orders for non-manufacturing businesses retreated, it is still showing strong growth. The same is true for the ISM manufacturing new orders; in that sector, however, the import indicators rose. The NASDAQ had its ups and downs all month, especially with the crisis in Japan, but ended up increasing for the month, and is actually above the inflation-adjusted level of December 2007. The Q4-2010 proprietors' income data final data, our indicator of the condition of small business, finally broke above the current dollar level at the start of the recession by 2%. It is still about 5% below the recession start on an inflation-adjusted basis.
Finally, virtually all of these measures all show an economy that has recovered. Unfortunately, the employment data of last week do not show such a recovery. We'll discuss employment conditions and the continuing unevenness of the economy next week.
There were some movements in the indicators from the Institute for Supply Management non-manufacturing indices, the biggest being non-manufacturing imports, which is now at 50, or neutral. Even though new orders for non-manufacturing businesses retreated, it is still showing strong growth. The same is true for the ISM manufacturing new orders; in that sector, however, the import indicators rose. The NASDAQ had its ups and downs all month, especially with the crisis in Japan, but ended up increasing for the month, and is actually above the inflation-adjusted level of December 2007. The Q4-2010 proprietors' income data final data, our indicator of the condition of small business, finally broke above the current dollar level at the start of the recession by 2%. It is still about 5% below the recession start on an inflation-adjusted basis.
Finally, virtually all of these measures all show an economy that has recovered. Unfortunately, the employment data of last week do not show such a recovery. We'll discuss employment conditions and the continuing unevenness of the economy next week.
Commentary & Analysis
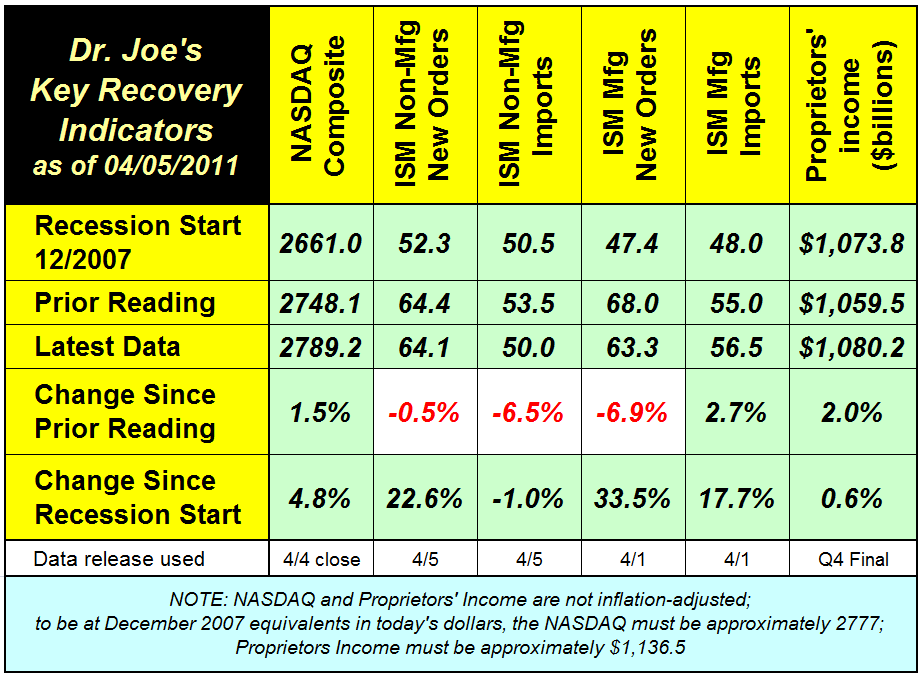
Five of Six Recovery Indicators are Positive (CORRECTED)
(
(NOTE: this post has been corrected; the original post identified six indicators as positive, which was incorrect; the analysis has been updated.)
The chart below (click to enlarge) shows that five of six of our recovery indicators are in positive territory. Proprietors' income finally broke through its December 2007 levels, but non-manufacturing imports have been nudged below their levels of that time.
 There were some movements in the indicators from the Institute for Supply Management non-manufacturing indices, the biggest being non-manufacturing imports, which is now at 50, or neutral. Even though new orders for non-manufacturing businesses retreated, it is still showing strong growth. The same is true for the ISM manufacturing new orders; in that sector, however, the import indicators rose. The NASDAQ had its ups and downs all month, especially with the crisis in Japan, but ended up increasing for the month, and is actually above the inflation-adjusted level of December 2007. The Q4-2010 proprietors' income data final data, our indicator of the condition of small business, finally broke above the current dollar level at the start of the recession by 2%. It is still about 5% below the recession start on an inflation-adjusted basis.
Finally, virtually all of these measures all show an economy that has recovered. Unfortunately, the employment data of last week do not show such a recovery. We'll discuss employment conditions and the continuing unevenness of the economy next week.
There were some movements in the indicators from the Institute for Supply Management non-manufacturing indices, the biggest being non-manufacturing imports, which is now at 50, or neutral. Even though new orders for non-manufacturing businesses retreated, it is still showing strong growth. The same is true for the ISM manufacturing new orders; in that sector, however, the import indicators rose. The NASDAQ had its ups and downs all month, especially with the crisis in Japan, but ended up increasing for the month, and is actually above the inflation-adjusted level of December 2007. The Q4-2010 proprietors' income data final data, our indicator of the condition of small business, finally broke above the current dollar level at the start of the recession by 2%. It is still about 5% below the recession start on an inflation-adjusted basis.
Finally, virtually all of these measures all show an economy that has recovered. Unfortunately, the employment data of last week do not show such a recovery. We'll discuss employment conditions and the continuing unevenness of the economy next week.
About Dr. Joe Webb
Dr. Joe Webb is one of the graphic arts industry's best-known consultants, forecasters, and commentators. He is the director of WhatTheyThink's Economics and Research Center.
Video Center


![]()
- KYOCERA NIXKA INKJET SYSTEMS (KNIS) INTRODUCES BELHARRA, THE NEW WAVE OF PHOTO PRINTERS
- New RISO Printing Unit Offers Easy Integration for Package Printing
- March 2024 Inkjet Installation Roundup
- Inkjet Integrator Profiles: Integrity Industrial Inkjet
- Revisiting the Samba printhead
- 2024 Inkjet Shopping Guide for Folding Carton Presses
- The Future of AI In Packaging
- Inkjet Integrator Profiles: DJM

WhatTheyThink is the official show daily media partner of drupa 2024. More info about drupa programs
© 2024 WhatTheyThink. All Rights Reserved.