Gee, the Economy is Slow...
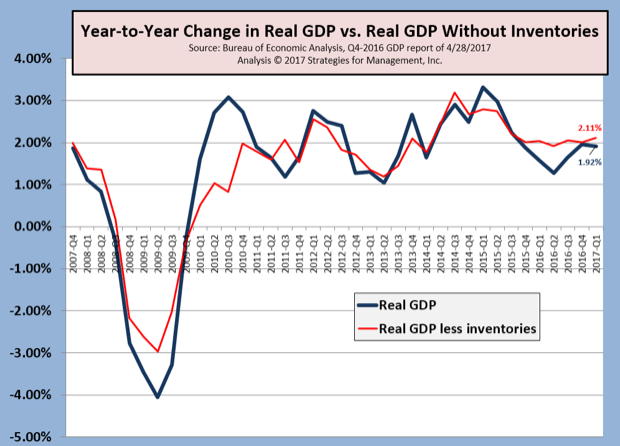
… but if you’ve been following this column and the webinars, you’re not surprised. Real GDP for the first quarter came in at +0.7%, lower than economist estimates and lower than trend. We prefer to look at the year-to-year comparisons rather than quarter-to-quarter, and to also look at the data without inventories. The fluctuations in inventories can make the underlying pattern in the data harder to see. Indeed, there was an inventory correction in the last quarter, and taking that into account the economy is still in the unsatisfying +2% range.
For those who like to compare how their business is doing against the economy, to equal GDP you need to grow at the rate of about +4.25% unless you adjust for inflation, and that would be about a +2.2% growth rate.
Our recovery indicators had a slowdown in two of its six factors. The one item to be concerned about is our small business indicator or proprietors’ income, up +1.3% at an annual rate, which is actually negative after you subtract inflation.
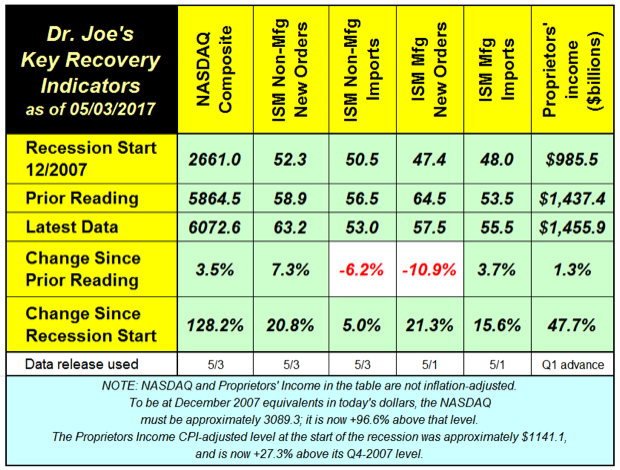
The NASDAQ is probably overdone in relation to various economic but its driven mainly by Apple and FANG stocks (Facebook, Amazon, Netflix, Google). Much was made about the NASDAQ being at all-time highs, but it actually needs another 500 or so points for it to be there after inflation. A while ago we showed that investing in the NASDAQ starting at its true peak on a dollar-cost-averaging basis, ignoring dividends, through all those years of decline and its slow rise, the average annual return was 8%. It’s yet another case of ignoring the indexes and avoiding the quest for “the right time” to invest turning out better than it seems.
Printing Shipments: Should “Everyone” be Worried?
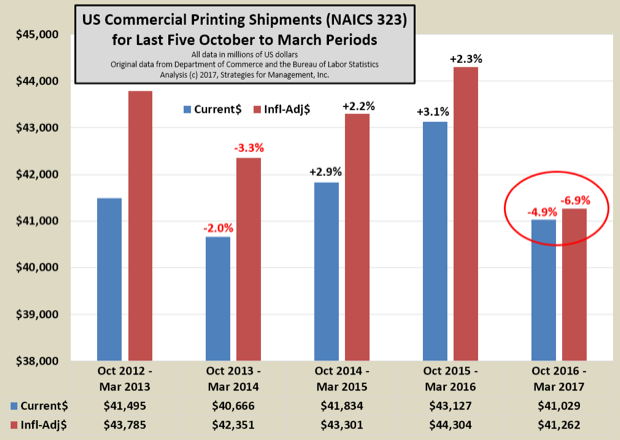
March shipments were not good. March has a history of being the best month of the year or among them. On a current dollar basis, it was barely over $7 billion, down more than $500 million compared to last year. That’s a -6.7% decline, and -8.9% after factoring in inflation.
The negative pattern really got going with September’s shipments. The chart shows the period of October through March for the last five years. The latest period is down -4.9% in current dollars and -6.9% adjusted for inflation.
I’ve been poking around the industry over these last weeks, and looking at various data sources. There are businesses doing well, absorbing the volumes of their deceased and struggling brethren, and the stream of “tuck-in” activities. It does seem that big and long-run printers are having another round of demand declines. Because they still represent a large share of industry shipments, declines there may overstate what small and mid-size print businesses are going through. It’s in those sectors of the market where I get positive reports from data-immersed digital printing operations. Traditional offset operations are in more trouble lately than they already were.
There is the question about whether print in general is having problems, or if volume is just going elsewhere like corporate offices (no, more digital communications), inplant departments (many are closing, others are changing their services and print offerings), office superstores (many stores closing or about to), copy shops (not growing here either), and other places.
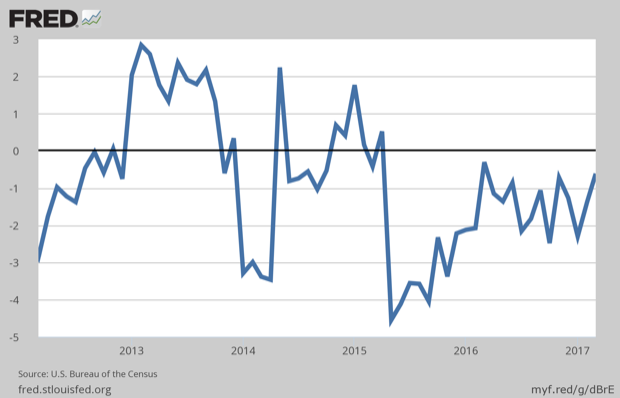
This is a chart of the year-to-year percentage change in CPI-adjusted US paper shipments. It’s not the best measure because it includes all paper, not just paper used in printing, but it does show that the value of shipments has been contracting every month since Spring of 2015.
The steadiest sector of commercial printing has been screen printers. For some of the projects we’ve been working on lately, we’ve actually had to exclude the screen printing data from the industry wide data to work through the details of our analysis because it’s been so resilient compared to the rest of the industry. A lot has to do with their adoption of ink jet processes like wide format for some of their applications, but also because many corporate communicators are staging events and using with a lot of branded promotional goods.
As for offset taking it on the chin, many of the digital printing businesses are doing better. Digital print smartly mingles in the expanding culture of marketing automation and analytics. These businesses should not be worried, but they should stay out in front of the trends. Everyone else should be worried, perhaps.
The next big date for shipments data is May 18 when the Commerce Department issues revisions that may date as far back as but probably as far back as 2013. Revisions to other data series seem to indicate that the statisticians are raising 2015 and lowering 2016 data. All of this activity leads to revisions to historical GDP at the end of July.
Managers can’t wait for the statisticians to get 2014 right. They have to make decisions about today.
Employment Continues an Upward Muddle; Printing Consolidates
The press made a big deal about payroll increasing by +211,000 after a bad prior month that was revised down. Long-term payroll employment is still mired in the +150,000 to +175,000 range, which affirms a slow and sluggish economy.
The unemployment rate fell to 4.4%, but as we have written previously that is no longer a good measure of the health of the labor market. What was good news, not reported, of course, was that full time employment was up by +480,000, and the household survey of all jobs was up by +314,000. Therefore, about 166,000 part time positions were replaced by full time ones.
That tempered some of the negative aspects of the report, such as -162,000 leaving the workforce, one of the factors that nefariously improves the unemployment rate calculation. For the last 12 months “no longer in labor force” has averaged only -28,000 per month, so this reading was considerably higher. The labor participation rate, which is where we will see true labor market improvement (if and) when it occurs fell back to 62.9%. It’s been range-bound between 62.4% and 63.0% since April 2014. When the recession started it was 66.0%, more than nine years ago.
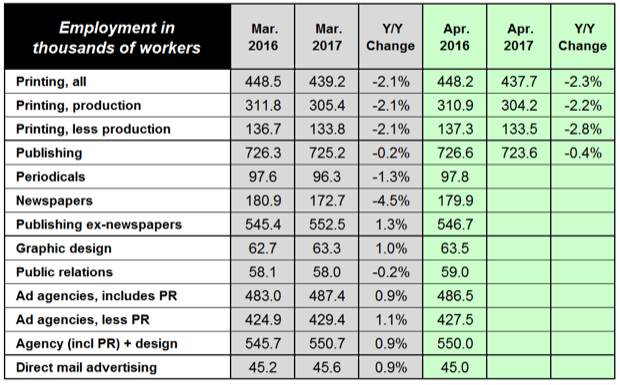
Commercial printing employment is down -10,500 workers since last year (-2.3%) and is now at 437,700. Non-production workers continue a general long term trend of declining faster than production workers (-2.2% vs. -2.8%), mainly the result of consolidation whether acquisition or closure. Growth in public relations employment looks like it's topping out, perhaps the result of more companies taking charge of their content marketing initiatives by bringing it inside and hiring freelance writers on their own. Ad agency employment is up, in recent months. Graphic design employment seems to be in growth mode again.
Data, Expectations, and Reactions
Apple’s financials were interesting, as usual, but what always fascinates me is the reaction of the markets and the stock analysts. The company’s stock price is often penalized because the analysts make incorrect guesses about the company’s sales and costs and seasonal patterns. Their same silly act goes on every quarter.
Does your business run on hard data or guesses? Every manager has rules of thumb or assumptions based on their experiences, but these stock analysts seem to be in a much different place. As managers, when our rules of thumb or assumptions are not correct, our interest is piqued, and we find out what’s different. The stock analysts seem to blame Apple for not meeting their analyst numbers. That’s strange.
Remember, as managers, we look at economic data because they are available, and we want a sense of whether what we are seeing is what’s happening elsewhere. What we do with our own businesses and our own customers and prospects is what really matters.
Strongly held assertions create opportunities when businesses and their executives stick with their assumptions even though realities indicate otherwise. This creates a misallocation of resources and opportunities for competitors.
One might say that about entrepreneurship. There is a strongly held assertion about an opportunity in the marketplace that others cannot see. But even entrepreneurs allow for those risks and the natural lag before data start to affirm their direction.
The real problem is in larger businesses where there are organizational territories to protect and procedures and policies that reinforce out-of-date market assumptions. Yes, that’s you, company bonus and commission programs, built on existing products and capabilities that put blinders (sorry, I meant to say “encourage people to focus like laser beams on their jobs”).
When marketplaces change, one of the first places that problems arise is in the compensation of bonused and commissioned workers. Sales fall, so those workers and top executives focus more on the jobs and customers they know. Difficulties in making forecasts are blamed first on the quality of the efforts and skills of those workers. By the time the business realizes that something else is the cause, they have already wasted time and resources trying to solve a problem for which they did not diagnose a proper cause.
Yes, people need to focus on their jobs, but they also need to be encouraged to learn things from their interactions with the marketplace. They might not be able to interpret them, but they need to be able to report them to management. Both sides need to make sure that the information is not an excuse for poor performance but data that when added with other news and information helps management do their jobs better. Sometimes sales problems are sales problems, but sometimes sales problems are the company producing and selling the wrong things.
Many printers and businesses misdiagnose changes business levels as fluctuations in general economic conditions. Media markets are changing: be aware and open to the reasons why and the extent of those changes, and what opportunities and challenges they bring to your business and your staff.
(Further reading related to this topic is in an earlier column).


