The unemployment rate for March was 8.
The unemployment rate for March was 8.2%, an improvement from 8.3%, but the statisticians at the Bureau of Labor Statistics chided those who would make a big deal of it by saying the employment situation was “little changed.” The unemployment rate's actual change was from 8.27% to 8.19%, a 0.8 percentage point change. It was change, nonetheless.
The problem continues to be the shrinking labor force. It fell by 164,000 workers, and employment fell by 31,000. Remember, these data are from the household survey, which includes very small businesses and self-employed workers. The household survey is used to calculate the unemployment rate.
The payroll data gets all of the press attention, with an increase of +120,000 employees, but that was half of what was expected, so the report was considered to be very discouraging in light of recent months where it was breaking the +200,000 consistently. The payroll report has about a plus or minus range of 130,000, so it could have contracted by 10,000 workers, or increased by 250,000. No one really knows the real numbers for months. It's better to look at the long term trends.
Since March of last year, the labor force is up by 1.3 million, the number employed is up by almost 2.3 million. The number of people not in the labor force is also up by almost 2.3 million. This March alone, the number of people no longer in the labor force was up by +333,000 since February, which is not a good sign.
We know this: the unemployment rate is getting better slowly, and often for the wrong reasons.
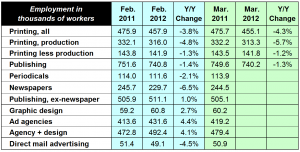
What of printing industry employment. Starting with the beginning of the recession, printing employment has declined for 49 of 52 months, falling by -158,800 jobs in that period, about -3,000 per month. March was a -2,800 drop from February, which does not bode well for March printing shipments; last year's March shipments were in the range of $7.4 billion, but our models suggest $7.1 billion this year. We're hoping for flat instead. (Click on employment chart to enlarge).

Employment in graphic design and ad agencies is still increasing, based on February's data (March data will be released next month). It is likely that ad agency employment will surpass printing industry employment by the end of this year.
An important part of the economy is the condition of small business. Last week, we mentioned that one of our recovery indicators, proprietor's income, was still lagging the level it was at the start of the recession once adjusted for inflation. The
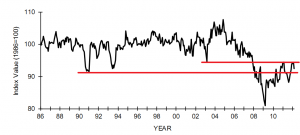
monthly survey of small businesses conducted by the National Federation of Small Business took a step back, breaking a six month rise in small business optimism. Their chart is below (click to enlarge).

I've marked their chart with two lines. The first and longest line is the bottom of the recession in the early 1990s, which by most historical standards was not all that bad. The shorter line above it is the bottom of the small business slowdown in early 2003. The NFIB index reached the levels of the latter recently, but looks like it's stuck in a range between the two lines, at least for now.
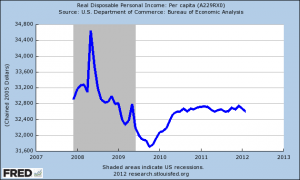
An indicator of the state of the economy that we believe is better to watch than GDP is real disposable per capita income. Real means that it is adjusted for inflation, disposable means that it is income after taxes, and per capita means that it is per person. The sideways state of the economy is obvious from the chart (click to enlarge).

###
 Employment in graphic design and ad agencies is still increasing, based on February's data (March data will be released next month). It is likely that ad agency employment will surpass printing industry employment by the end of this year.
An important part of the economy is the condition of small business. Last week, we mentioned that one of our recovery indicators, proprietor's income, was still lagging the level it was at the start of the recession once adjusted for inflation. The monthly survey of small businesses conducted by the National Federation of Small Business took a step back, breaking a six month rise in small business optimism. Their chart is below (click to enlarge).
 I've marked their chart with two lines. The first and longest line is the bottom of the recession in the early 1990s, which by most historical standards was not all that bad. The shorter line above it is the bottom of the small business slowdown in early 2003. The NFIB index reached the levels of the latter recently, but looks like it's stuck in a range between the two lines, at least for now.
An indicator of the state of the economy that we believe is better to watch than GDP is real disposable per capita income. Real means that it is adjusted for inflation, disposable means that it is income after taxes, and per capita means that it is per person. The sideways state of the economy is obvious from the chart (click to enlarge).
 ###
###


