Every year, the Department of Commerce and the Bureau of Labor Statistics publish data called
County Business Patterns. These are among the best data about the number of business establishments that one can get, because they are compiled from Social Security tax records filed on Form 941. (These data do not include businesses without employees who pay their Social Security tax with their income tax; those are covered in a different report,
Nonemployer Statistics, which we will discuss in an upcoming column.)
Unfortunately, when
County Business Patterns data are released, they are somewhat out of date. The 2009 data were just published. Ordinarily, this is not a problem during typical economic times.
The problem is compounded by the data's baseline week. Every
County Business Patterns report is based on the number of establishments and employees for whatever week includes March 12. In the case of 2008 data, we were not officially in a recession. That is, we actually were, but did not know it yet. The start of the recession was pegged by the
National Bureau of Economic Research in December 2008. This mean that at the time of their meeting, a recession was declared almost a full year after it had actually started.
We also know that the
recession bottomed in June of 2009, also determined by the NBER.
This means that because the 2008
County Business Patterns data were collected close to recession start, and the 2009 data were collected close to the beginning of the recovery, we can compare how some sectors did compared to others.
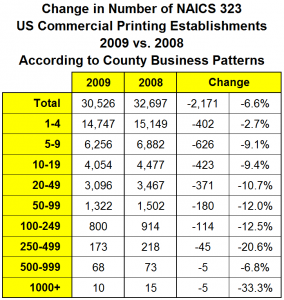
How did the printing industry do? The printing industry has been averaging a net decline in establishments of about -1,000 for more than 15 years. It's a net decline because there are always business formations (or re-formations in the case of more than two or three establishments decide to eschew the M&A or tuck-in process and just close their old businesses and open a new one. More than double that typical declined, occurred during the start of the recession, as -2,171 or -6.6% of establishments exited the stage. Typically, three establishments discontinue business and are replaced by two. If that held true during this period, about -6500 establishments closed and +4,200 replaced them, usually with owners and employees who were part of the closed businesses. Nothing like clearing the decks and trying to start fresh during a recession. (Click image to enlarge)

Back years ago, 1,000 establishments was not a lot of establishments, but as we continue to contract, 1,000 is a much higher percentage than it used to be. Based on employment data that is more current, it looks like 2010's
County Business Patterns data, to be released around this time next year, will be a similar -2,000 decline. The print businesses that got hit the hardest were those with 250-499 employees (about $50 -$100 million in sales). Only the 1-4 employee group seemed more resilient, but that may be because so many printing establishments downsized themselves to that level. So it's not really resilience, it's that it's the smallest size of establishment you can be and still be in business. Establishments shift from size range to size range over time, so it's important to remember that businesses are not eternally pegged to be one size.
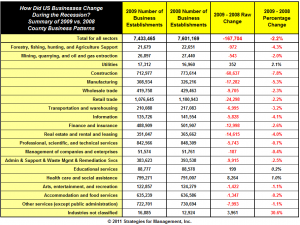
The table below shows the data for all US business establishments. Between the publication of the 2008 and 2009 data, there was a net change down of -167,704 business establishments, about -2.2% of the total. (Click image to enlarge)

Ignoring businesses that were not classified to a sector, health care and social assistance grew, and were up +8264 in establishments, for a percentage increase of +1%. Utilities were +352 establishments (+2.1%) and educational services were +199 (+0.2%). The rest of the sectors were down. The worst in terms of number of establishments were construction (-60,636, -7.8%), retail trade (-24,298 -2.2%), manufacturing (-17,282, -5.3%), real estate and rental and leasing (-14,615, -4%), and finance and insurance (-12,998, -2.6%). The table below show data for these and other industries.
County Business Patterns have data for many employee size ranges of establishments; because of space limitations, we cannot include all of them here. Establishments with 50 or more employees are only 5% or all businesses. These larger businesses declined disproportionally to their number: they represented 15% of the decline in the number of establishments. The data show that among businesses with 50 or more employees, that construction lost -18.8% of those establishments, followed by a -11.9% of administration and support and waste management and remediation services businesses, and -11.2% of manufacturing businesses. On average, the number of business establishments with 50 or more employees fell by -6.4%, when the overall total of all establishments fell by -2.2%. The number of health care and social assistance establishments with 50 or more employees grew by 2.1%
Our analysis of microbusinesses, proprietorships, and other non-employee businesses will be provided soon after the data are released.
In the meantime, Friday, July 29 is a critical day for economic data, with the release of Q2-2011 GDP and revisions going back five years. We'll report on that next week.
 Back years ago, 1,000 establishments was not a lot of establishments, but as we continue to contract, 1,000 is a much higher percentage than it used to be. Based on employment data that is more current, it looks like 2010's County Business Patterns data, to be released around this time next year, will be a similar -2,000 decline. The print businesses that got hit the hardest were those with 250-499 employees (about $50 -$100 million in sales). Only the 1-4 employee group seemed more resilient, but that may be because so many printing establishments downsized themselves to that level. So it's not really resilience, it's that it's the smallest size of establishment you can be and still be in business. Establishments shift from size range to size range over time, so it's important to remember that businesses are not eternally pegged to be one size.
The table below shows the data for all US business establishments. Between the publication of the 2008 and 2009 data, there was a net change down of -167,704 business establishments, about -2.2% of the total. (Click image to enlarge)
 Ignoring businesses that were not classified to a sector, health care and social assistance grew, and were up +8264 in establishments, for a percentage increase of +1%. Utilities were +352 establishments (+2.1%) and educational services were +199 (+0.2%). The rest of the sectors were down. The worst in terms of number of establishments were construction (-60,636, -7.8%), retail trade (-24,298 -2.2%), manufacturing (-17,282, -5.3%), real estate and rental and leasing (-14,615, -4%), and finance and insurance (-12,998, -2.6%). The table below show data for these and other industries.
County Business Patterns have data for many employee size ranges of establishments; because of space limitations, we cannot include all of them here. Establishments with 50 or more employees are only 5% or all businesses. These larger businesses declined disproportionally to their number: they represented 15% of the decline in the number of establishments. The data show that among businesses with 50 or more employees, that construction lost -18.8% of those establishments, followed by a -11.9% of administration and support and waste management and remediation services businesses, and -11.2% of manufacturing businesses. On average, the number of business establishments with 50 or more employees fell by -6.4%, when the overall total of all establishments fell by -2.2%. The number of health care and social assistance establishments with 50 or more employees grew by 2.1%
Our analysis of microbusinesses, proprietorships, and other non-employee businesses will be provided soon after the data are released.
In the meantime, Friday, July 29 is a critical day for economic data, with the release of Q2-2011 GDP and revisions going back five years. We'll report on that next week.


