May 2011 printing shipments data were recently released by the US Department of Commerce,
May 2011 printing shipments data were recently released by the US Department of Commerce, and these are the key trends noted by the WhatTheyThink Economics & Research Center:
- US commercial printing shipments for May 2011 were $7.06 billion, +$19 million compared to 2010, +0.3%.
- On an inflation adjusted basis, shipments were down -$232 million, -3.2%.
- April current dollar shipments were revised down another -$65 million, making the comparison to 2010 -$174 million, or -2.4%.
- For January through May, shipments are +0.9% compared to 2010 in current dollars, and -1.7% in inflation adjusted dollars.
- Statistical forecasts indicate that industry shipments will be $84.5 billion for 2011 vs. $86.7 in 2010.
- The overall WTT ERC 2011 forecast, which includes inputs from our statistical models and our qualitative assessment of economic, social, and technology trends, is $85 billion at this time. A downward revision to $83.5 billion is likely as June data become available. Business appears to be weaker than anticipated. We have been wary of Q3 and Q4 outlooks because of strong adoption of tabletPCs, e-books, and the continuing increase in broadband and smartphone products; the effects of those trends seem to have started in Q2 with the extraordinary decline in shipments of April.
- Employment in the printing industry continues to contract, with -22,200 fewer workers than in June 2010. In contrast, May 2011 employment in advertising agencies is up more than +20,500 (+5.1%) versus May 2010, underscoring the shift in media spending to new formats. Advertising agency revenues will probably exceed those of the printing industry in 2011, perhaps for the first time in history, as best as we can determine. Total advertising agency employment is likely to exceed printing industry employment sometime in 2012 or 2013.
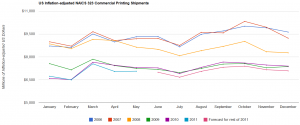
The chart below shows the monthly inflation-adjusted shipments and the statistical model forecasts for the balance of 2011. (Click on the chart to enlarge it for easier viewing).

WhatTheyThink Premium subscribers have access to these data and may download the spreadsheet workbook from our special site. Click
here. To download the workbook, click "File" then "Download as" and select the file format you prefer. The workbook also includes the latest data from Statistics Canada.
 WhatTheyThink Premium subscribers have access to these data and may download the spreadsheet workbook from our special site. Click here. To download the workbook, click "File" then "Download as" and select the file format you prefer. The workbook also includes the latest data from Statistics Canada.


