Today's GDP report for the third quarter was quite good, but must be in some kind of context. That level is only 0.1 percentage points above the historical post-WW2 GDP average, and is not the breakout quarter, usually around +6% or +7% that typically shows a definitive change in economic fortunes.
We're still -2.3% off the level of the fourth quarter of 2007, which is the quarter defined as the beginning of the recession. We have made up very little lost ground, and are about $350 billion in output to be even with that 2007 level. If the economy had maintained a sub-par +2.5% annual growth rate during this period, we would be about a $15.2 trillion economy instead of a $14.3 trillion one.
Have we at least stopped the bleeding, and stopped the economic contraction? Not in this report. It's rather “cash for clunkers” heavy that most of the non-automotive comparisons are negative on a year-to-year basis. We know that when the program expired, auto sales declined. We're still riding along a bumpy recession bottom, but the steep declines have stopped and slight improvements here and there can be seen.
I believe the most important data are the personal income data, to be fully released on Friday, October 30. Some of those data are available in this GDP report. Wages and salaries were down -0.1% on a current dollar basis, compared to the prior quarter, and benefits costs were up +0.2%, continuing a long-term pattern where workers are not seeing the full value of their increased productivity in their paychecks. Disposable personal income was down -0.2% on a current dollar basis, and down -0.9% on a real basis.
Proprietor's income on a current dollar basis is still down -6.8% on a year-to-year basis, showing that small business is feeling a significant portion of the economic decline.
We'll have more detailed and fuller context analysis in Monday's column.
Are the Leading Indicators Leading Us On?
I've been very concerned of late about the usefulness of the Leading Economic Indicators in any kind of forecasting. But before that, a little lesson about economic data reporting would be helpful.
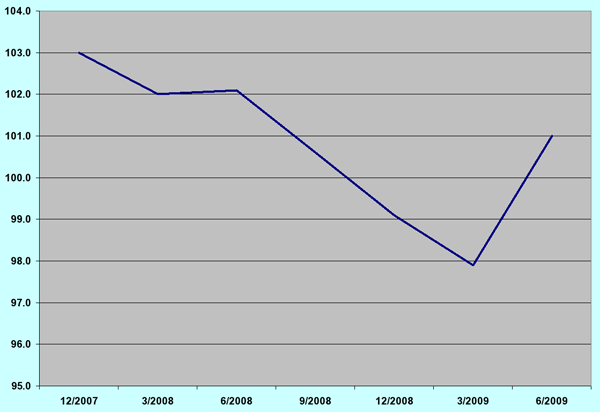
The chart below shows a clearly rebounding economy, showing that we are back on track. What's wrong with this picture?

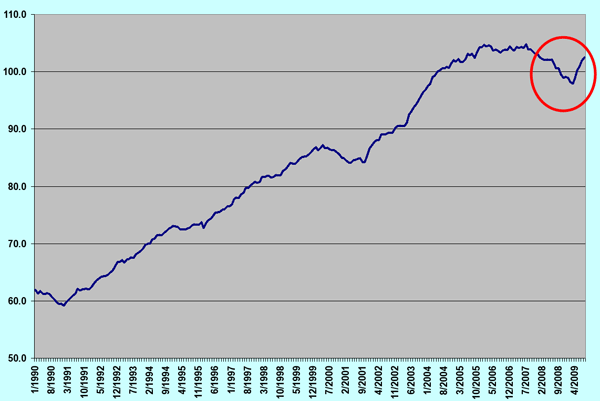
The chart is unfortunately what's wrong with a lot of business reporting. It shows only a short period of time, and one can attribute a small movement as something more significant than it actually is. Look at this chart, which puts the upturn in perspective:

The earlier chart was just a portion of the tail end of the longer-term one above, as identified by the red circle. This is usually how the press reports business news, absent of larger context.
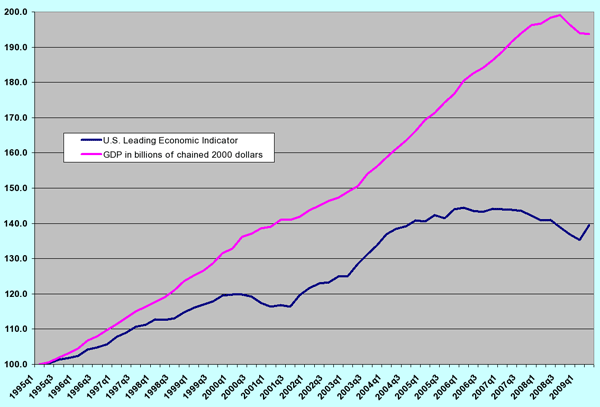
Now look at this one, which has the LEI and real GDP with a common base year of 1995:

This chart shows the leading indicators in blue and real GDP in red. The LEI missed the increase in GDP, forecast a recession when there really wasn't one, just a slowdown in growth in the 2001-2002 period.
So what is the track record? Since 1990, the r-squared of the LEI compared to GDP is in the mid-90% range, which is very impressive. But since the third quarter of 2006, it's been no help, delivering just a miniscule r-squared of 5% when used to forecast real GDP. That's is meaningless! It's only 30% in forecasting current dollar GDP. In fact, the regression formula that uses the LEI to forecast current dollar GDP now regularly undershoots the value of GDP by about 7%!
One of the problems is that 45% of the LEI's components are money supply and interest rate related. This means that the LEI would automatically start to rise and forecast an upturn with an increase in the money supply. When the money supply was only mildly out of control, and rather consistent, it was okay. But this may be the primary reason why we can't trust the LEI to tell us much anymore, and that we should be skeptical of the authority it still seems to have. The Conference Board economists eventually get the LEI correctly tweaked, but if it couldn't forecast past upturns and gave false signals before, we should be looking elsewhere for signs of true improvement.
The lesson: when the basis of your forecasting model undergoes rapid change that are unrelated to the normal course of business, your model will probably be rendered useless.
Speaking of Leading Us On...
Here's the report from the Associated Press about the impending release of U.S. home sales data:
When the Commerce Department releases figures later this morning (10 am, Eastern time), sales of new homes are expected to rocket to their sixth consecutive monthly gain. Builders are reaping the benefits of the tax credit for first-time buyers that expires at the end of next month. Economists polled by Thomson Reuters are expecting a 2.6 percent increase in sales to about 440-thousand units, up from 429-thousand in August. If they hit the number, it would be the best month for new home sales in more than a year.
Then the data were released, also reported by the Associated Press:
Sales of new homes dropped unexpectedly last month as the effects of a temporary tax credit for first-time owners started to wane. The Commerce Department said Wednesday that sales fell 3.6 percent to a seasonally adjusted annual rate of 402,000 from a downwardly revised 417,000 in August. Economists surveyed by Thomson Reuters had expected a pace of 440,000. It was the first decline since March. Sales in September were off 7.8 percent from a year ago. Despite the surprising decline, the market is up 22 percent from the bottom in January, though down more than 70 percent from the peak in July 2005.
There are two things to learn from this. First, it's usually not worth the time to read anything about data that are being released other than the date and time they will be available. Second, whether or not the data are above or below expectations is not a news story. The expectations only remind us about the difficulties of forecasting, especially of short term movements. The data are what they are, and waiting for the real thing saves lots of time and executive brainpower that can be put to better use.


