The printing industry is in a human resources crisis. With the upcoming retirement wave of Baby Boomer employees, the industry has as many as 5,000 jobs to fill annually and they are having a challenge finding qualified young people to apply. Baccalaureate programs in printing and graphic communications are also finding it difficult to attract applicants to their programs. Even within those who express interest, a large percentage are initially interested in graphic design jobs as opposed to production, workflow or scientific jobs associated with the industry.
The primary goal of this month's research study, Correlates of Job Satisfaction of Early Career Employees in Printing and Publishing Occupations (PICRM-2009-01), by Ashley Walker and Patricia Sorce, Ph.D., was to answer this question: what is the perception of recent college graduates about their future careers in the printing and publishing industries? The goal of this research were to determine which factors or constructs have the strongest correlation to overall job satisfaction among RIT School of Print Media alumni who are currently employed in the graphic arts industry. (A control group of RIT School of Design alumni were also surveyed in order to allow for comparisons between the two.)
These alumni were surveyed on the characteristics of their jobs, what they like and dislike about their jobs, and on what their employers could do to change their jobs for the better (if such changes were needed). From these data, the authors determined the factors that were correlated to job satisfaction within this sample. Based on these findings, recommendations were made as to what managers can do to increase the satisfaction of their employees in the hopes of attracting new employees and reducing turnover of the most talented.
Methodology
Procedure
The survey was administered using an online survey service. In April of 2008, an e-mail was sent to the alumni of both the School of Print Media and the School of Design inviting them to complete the survey. The alumni sampled are only those who had provided their e-mail addresses to the RIT Alumni Office and are a subset of all graduates. The sampling frame was n=1,845 for the School of Print Media and n=964 for the School of Design.
Data Analysis
The total number of respondents was 749, with 307 School of Design (response rate of 31.8%) and 442 School of Print Media respondents (response rate of 24.0%). Not all respondents answered all questions, since the survey did not require all questions to be answered. Analysis of the gathered data was conducted using SPSS software (version 16.0). Open-ended responses deemed necessary for further research were coded appropriately.
To see a full listing of survey questions and response frequencies, please view Appendix A in the original monograph.
Research Findings
The results of the survey will be presented in the following order:
- Is there a difference in satisfaction between School of Print Media (SPM) and School of Design (SD) alumni?
- Within the SPM alumni population, are there differences in overall satisfaction by demographic groups as defined by generation, gender, and salary level?
- What are the major predictors of overall job satisfaction?
- What predicts the intention to change industries?
Each question is shown below with the corresponding data analysis and discussion following.
1. Is there a difference in satisfaction between SPM and SD alumni?
To determine if School of Print Media (SPM) alumni were unique in their responses, we included a control group of RIT School of Design (SD) alumni in the research. First, we tested whether there was a difference in overall job satisfaction. There was not a statistically significant difference in overall satisfaction between the two groups, although SPM alumni had a somewhat lower average satisfaction than SD graduates (mean of 2.33 vs. 2.22, p = 0.250).*
* The question for overall satisfaction was ranked on a seven point scale where 1 = Completely Satisfied and 7 = Completely Dissatisfied. Higher numbers therefore correspond to lower satisfaction.
However, statistically significant differences in satisfaction were found between the graduates of the two programs in two job facet categories: satisfaction with continuing education/in-service programs and satisfaction with work environment or work culture (see Table 1 below). In both cases, SPM graduates had significantly lower average satisfaction scores than SD graduates.
Table 1. Categorical differences in satisfaction
click to view image full size
2. Within the SPM alumni population, are there differences in overall satisfaction by demographic groups as defined by generation, gender, or salary level?
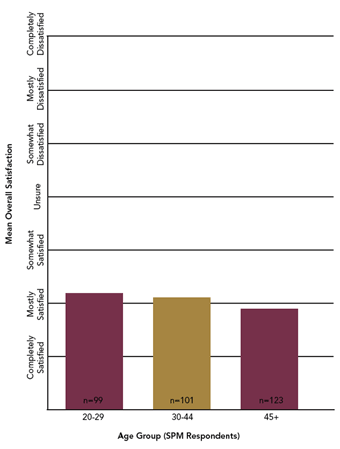
To test whether there are any generational differences in satisfaction, we grouped SPM alumni into three different age categories: 20-29 years of age, 30-44 years of age, and 45 or more years of age. Although there is a trend that shows a higher level of satisfaction for older workers, no statistically significant differences in overall satisfaction were found among these age groups (ANOVA, F = 2.675, p = 0.070, see Figure 1 below).
Figure 1. Satisfaction comparison of mean satisfaction by age group
click to view image full size
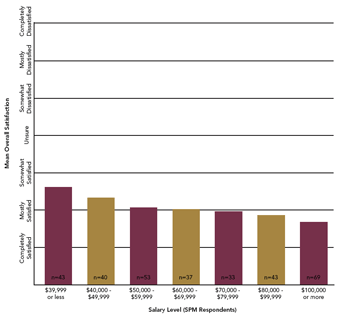
Statistically significant differences in overall job satisfaction were found between gender groups (ANOVA, F = 5.355, p = 0.021) and between salary levels (ANOVA, F = 5.015, p < 0.0001). In terms of gender, females were generally less satisfied with their jobs (2.54/7) than males (2.23/7). In terms of salary levels, those with higher salaries were more satisfied, as shown in Figure 2.
Figure 2. Satisfaction comparison of mean satisfaction by salary level*
click to view image full size
* Salary level groupings were created in order to adjust for low numbers of respondents (n) in certain responses. Original categories (as given on the survey) and number of respondents were as follows: $14,999 or less: 6, $15,000 - $19,999: 0, $20,000 - $29,999:10, $30,000 - $39,999:27, $40,000 - $49,999:40, $50,000 - $59,999:53, $60,000 - $69,999:37, $70,000 - $79,999:33, $80,000 - $89,999:28, $90,000 - $99,999:15, $100,000 or more: 69.
3. What are the predictors of overall job satisfaction?
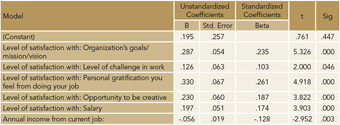
A regression analysis was conducted using the significant job facet satisfaction measures and the significant demographic item (as determined from prior regression analyses – see the complete monograph for full details) as predictors for overall satisfaction. This resulted in an r value of 0.713, an r² of 0.508, and an adjusted r² of 0.499 (ANOVA, F = 53.090, p < 0.0001). This indicates that 49.9% of the variation in overall job satisfaction can be explained by these six factors. Table 2 below shows that these six factors were all statistically significant, with all betas greater than absolute 0.1.
Table 2. Significant predictors of overall satisfaction
click to view image full size
4. What predicts the intention to change industries?
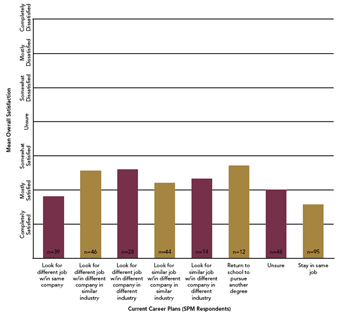
Among SPM alumni, it appears that overall job satisfaction was important in determining future career plans. The difference in overall satisfaction between career planning categories was statistically significant (ANOVA, F = 8.9, p < 0.0001). As shown below in Figure 3, those who had the lowest average satisfaction scores planned to "Return to school to pursue another degree" (mean satisfaction score of 3.08), "Look for a different job within a different company in a different industry" (mean = 2.96), and "Look for a different job within a different company in a similar industry" (mean = 2.91). This indicates that the most dissatisfied graduates are possibly looking to change their level/rank or field of work, although they may or may not also change industries as a result.
Figure 3. Comparison of mean satisfaction among future career plan responses
click to view image full size
Another potential factor in determining future career plans was the fulfillment of employer promises upon hire. As shown below in Table 3, respondents who felt that their employer had not fulfilled the promises made to them upon hire tended to plan to leave the firm, and a few may also leave the industry. This indicates that companies who do not fulfill promises to their employees are more likely to lose them.
Table 3. Comparison of employer promise fulfillment to future career plan responses
click to view image full size
Conclusions: Lessons for Employers
The results have implications for printing and publishing employers who are seeking new and possibly younger employees for their businesses. A starting point is to understand the factors that contribute to overall job satisfaction of employees. The results from this research suggest that the following are important:
- Personal gratification you feel from doing your job,
- The organization’s goals/mission/vision,
- The opportunity to be creative,
- The level of challenge in work, and
- The actual salary received.
If employees do not feel that their jobs are worthwhile, that they have the opportunity to be creative within their job, that they are being challenged by what they do, that they are being compensated accordingly for the work that they do, or that the company is going in a viable or worthwhile direction, their overall job satisfaction will suffer as a result.
How, then, can employers seek to improve job satisfaction? Some suggestions from the literature review include making sure that the person-job fit and/or person-organization fit are appropriate. Recruiting tactics could include realistic job previews, such as using co-ops or internships, to determine if potential employees will derive personal gratification from the job. Another tactic is providing more information about the values, mission, vision, and goals of the organization during the interview process. Although most companies provide some of this information on their marketing materials and/or Web site, words alone do not convey the true "personality" of a company. It is important to let the interviewee know how the company works so that they can assess for themselves whether or not they think they will fit.
Increasing the level of employee "buy-in" to the organization’s goals, mission, and vision may also be important for increasing overall job satisfaction. This could be enacted by senior executive "briefings" on the current goals, mission, and vision in the form of face-to-face meetings where employees are allowed to provide input to help create the organization’s goals, mission, or vision. This may not be feasible in very large companies, and some CEOs are using current communications technologies (such as blogs) to reach a large number of employees.
Work design is also important. Do employees have enough challenge in their jobs? Are they given the opportunity to be creative in determining how they accomplish their tasks? These are questions that should be asked when conducting annual reviews to determine if changes need to be made.
The level of satisfaction with salary and the actual salary received were also correlated to overall job satisfaction. In order to make sure that employees are being compensated appropriately for their level of experience and/or job type, employers should conduct industry benchmarking studies of pay rates at companies who have the performance level that the company wishes to aspire to. These benchmarking studies are also provided by some trade associations.
2007-2008 Research Monographs:
To read about this research in detail, download the monograph from: http://print.rit.edu/pubs/picrm200901.pdf


