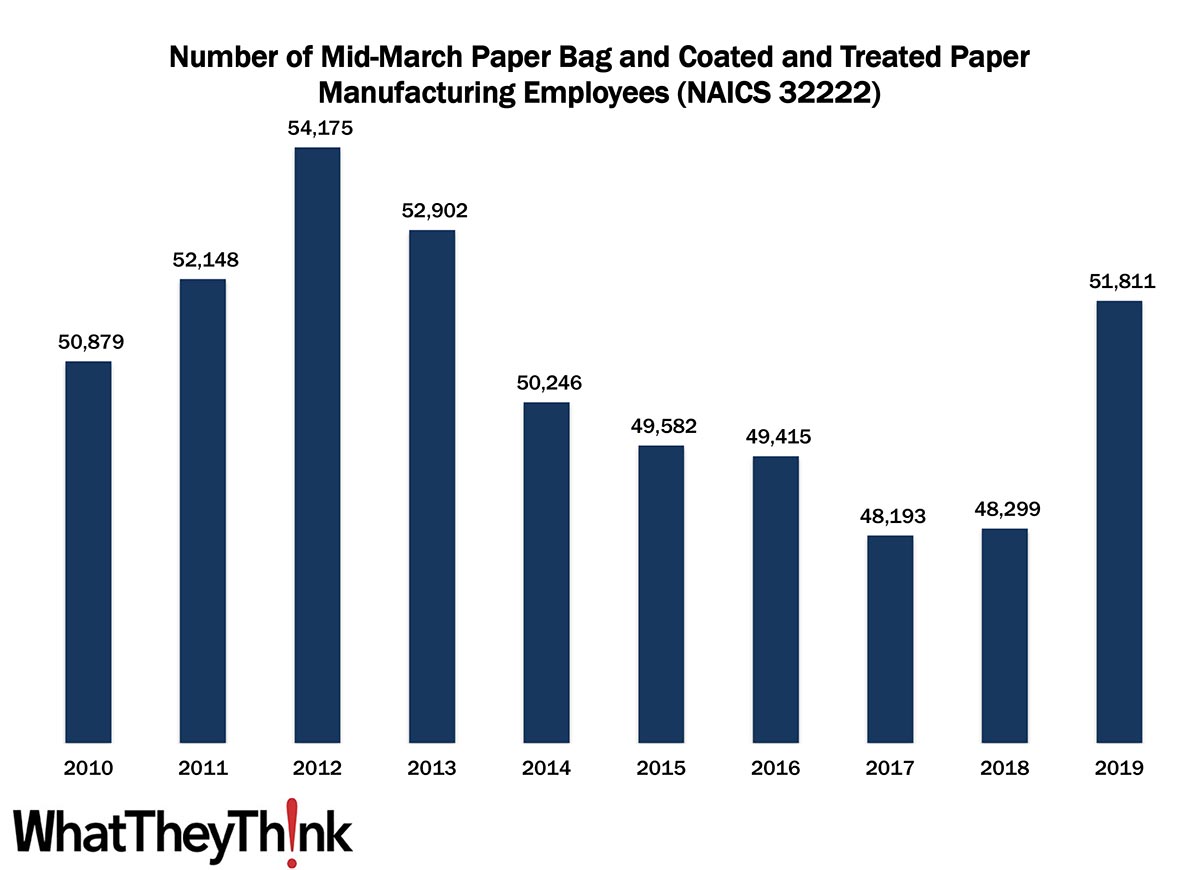
According to County Business Patterns, in 2010, there were 50,879 employees in NAICS 32222 (Paper Bag and Coated and Treated Paper Manufacturing establishments). This NAICS category peaked two years later at 54,175, declined slowly over the rest of the decade before shooting back up to 51,811 employees in 2019.
The Bureau of the Census definition for this business classification:
This industry comprises establishments primarily engaged in one or more of the following: (1) cutting and coating paper and paperboard; (2) cutting and laminating paper, paperboard, and other flexible materials (except plastics film to plastics film); (3) manufacturing bags, multiwall bags, sacks of paper, metal foil, coated paper, laminates, or coated combinations of paper and foil with plastics film; (4) manufacturing laminated aluminum and other converted metal foils from purchased foils; and (5) surface coating paper or paperboard.
As we said in our commentary on establishments, at the time, “paper vs. plastic” considerations anecdotally worked in paper bags’ favor, more and more municipalities had been banning or adding surcharges to plastic bags, and paper bags are easily recycled. At the same time, the growth and popularity of reusable bags have been making this conversation moot. (Remember, this was long pre-COVID.) Trends in retail can trickle down to affect bag demand, and there is still demand for niche/boutique bags. Digital printing can eliminate the “blank bag,” and laminates and other types of coatings—plastics, foils, embellishments, etc.—increase strength, aesthetic appeal, etc., but may adversely impact recyclability.
Interestingly, employment in this category grew even as establishments declined from 725 to 720, although that net decline number masks a lot of movement in the size classifications. This NAICS tended to lose establishments in the under-100-employee categories, but gained establishments in the 100+-employee categories, in large part the result of consolidation. But it also reflects growing demand for products produced by establishments in this category. Next year, when we get 2020 figures, it will be interesting to see what the effect on establishment and employee counts was.
The 3222 four-digit NAICS comprises a variety of different converted packaging types, and over the next several months, we will continue looking at them in turn, including:
- 32223 Stationery Product Manufacturing
- 32229 Other Converted Paper Product Manufacturing
- 322291 Sanitary Paper Product Manufacturing
- 322299 All Other Converted Paper Product Manufacturing
These counts are based on data from the Census Bureau’s County Business Patterns. Every other week, we update these data series with the latest figures. You may have noticed that the latest edition of County Business Patterns was released recently, which now includes 2019 data. Once we have finished with the Converting NAICS, we will circle back to the beginning and update establishment and other counts in the printing, publishing, and creative NAICS.
These data, and the overarching year-to-year trends, like other demographic data, can be used not only for business planning and forecasting, but also sales and marketing resource allocation.
This Macro Moment
Last week, the Bureau of Economic Analysis released its advance estimate of Q3 GDP growth:
Real gross domestic product (GDP) increased at an annual rate of 2.0 percent in the third quarter of 2021 (table 1), according to the "advance" estimate released by the Bureau of Economic Analysis. In the second quarter, real GDP increased 6.7 percent.
The report came in below expectations, for a number of reasons, namely, said Calculated Risk, “a sharp decline in Motor vehicles and parts (due to supply constraints), a decline in residential investment, a decline in government expenditures and a negative contribution from trade.” At the same time, personal consumption expenditures (PCE) increased 1.6% (annualized), a much slower rate than Q1 and Q2. There is also no denying that the “supply chain disruptions” (a new buzzphrase) also played a role. Oh, and the virus (especially the delta variant) which is still very much a factor (and was even more so in Q3).
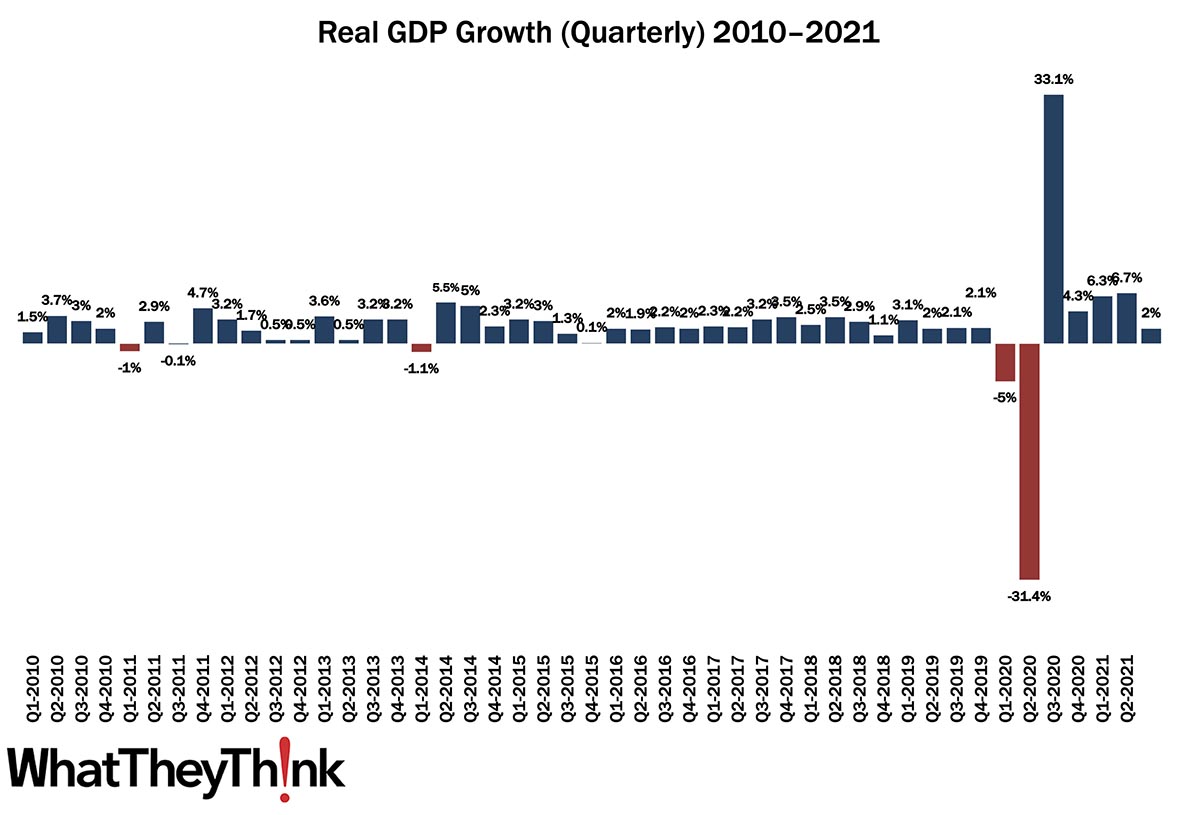
A 2% growth rate may seem dismal, but as CEPR’s Dean Baker points out, and as you can see from the chart above, that’s not far off the pre-pandemic average. The past year and a half has made us forget what used to be normal.