Now that 2014's US commercial printing shipments data have been released, we ran our forecasting models to get a peek at where the trendlines to 2020 are headed.
We use three basic statistical models, plus a regression model that uses real GDP as the independent variable.
The original data are from the US Department of Commerce industry shipments data for NAICS 323. These data do not include packaging, but do include labels, inplant and corporate printing, printing of computer service bureaus, newspapers printed by newspaper publishing organizations, and other business classifications for which printing is not their core business.
We adjust the data series to 12-month moving total of inflation-adjusted printing shipments. In this way, we are always using an annualized figure that is less prone to volatility of month-to-month variations. Remember, GDP is always reported on an annualized basis. The inflation adjustment we use is the Consumer Price Index for each month of data.
An
article from 2012 describes our skeptical approach to forecasting models. They are tools for management decisions and are intended to enhance judgment. Models cannot replace first-hand knowledge or experience. They are very valuable to the planning process when used properly.
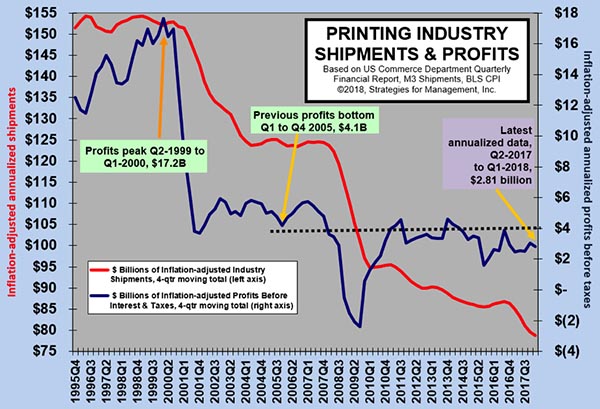
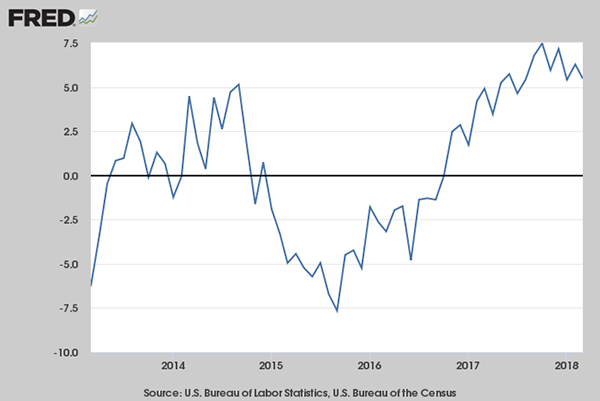
Keep this number in mind: 2014 finished the year at $77.1 billion in inflation-adjusted US dollars. In current dollars the year was flat, in inflation-adjusted dollars it was down -1.5%. The year finished well, with positive comparisons to 2013.
The relationship of commercial printing with the overall economy (real GDP) broke down in the late 1990s, and the relationship is not particularly strong today, and when it is, it's in the wrong direction. The statistical relationship still remains negative, which means that a rise in GDP results in a decrease in print.
Forecasting models are just data series and models are just equations that describe past statistical relationships. The models only consider the data in them, and cannot by their nature forecast the future, but help users understand a past that has ups and downs and directions that can be hard to discern. So the purpose of the models is to help us understand what happened in the past with some unemotional objectivity. We ran three regression models, one with real GDP starting in 1992, one with data starting in 2000, and a third starting with the data of 2005. (click chart to enlarge)
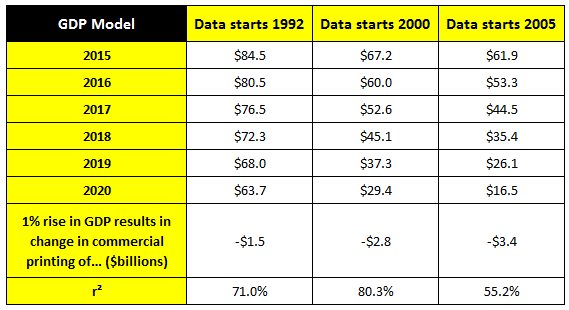
The most "accurate" model had an r-squared of 80.3% which is usually considered good for sales forecasting techniques. It also means that the model cannot explain 19.7% of the variation in the data (100%-80.3%). The data series that started with 1992 had a 71% r-squared, making it relatively borderline for this purpose, and the 2005 data series had an r-squared of 55.2% which means we should not rely on it. This does not mean that this forecast series won't turn out to be right, but that it is the least likely regression model to be right.
Like many statistical forecasts, the year that you start the data series can result in vastly different results. The differences can be seen in the forecasts for 2020. If we start the data with 1992, the forecast for 2020 is $63.7 billion, but the 2000 model has it as $29.4 billion, and the 2005 one has it as $16.5%. Also in the chart the effect of a +1% rise in GDP on printing shipments is noted. For the model, a +2.5% annual rise in real GDP was used, which is approximately where GDP has been for the last three years or so.
While the GDP models are somewhat informative, they have not been helpful in forecasting actual volume. Their main value has been in dismissing the natural assumption that the commercial printing industry moves in lockstep with the economy. It clearly does not. This means that managerial skill and entrepreneurial initiative in their geographic areas or product specializations play a more important role in the success of printing businesses because they do not have a general economic trend to ride upward.
We've developed great preference other model approaches over the year. The three are an enhanced moving average model using the technique of exponential smoothing, a curve-fitting model that uses polynomial equations, and another variant of enhanced moving average called Box-Jenkins. The results are listed below (click chart to enlarge).
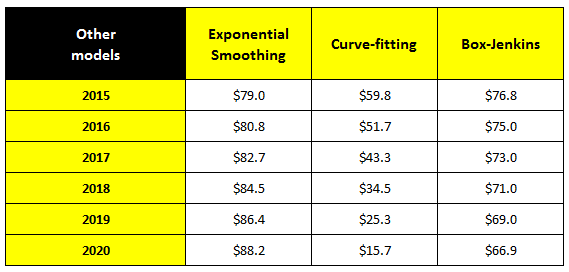
The exponential smoothing model weighs recent results more heavily than older results. It is forecasting a rise in printing shipments, the result of the most recent five months of 2014 where the commercial printing industry performed much better than expected. In some ways it is hard to rely on a forecasting method that so easily changes direction. Sometimes you need that, for this purpose, it's probably not wise.
The curve-fitting model, which we often refer to as our "aggressive" model, fits a curve rather than a straight line to the forecast, and has the industry declining by more than $60 billion in annual shipments to $16 billion by 2020 (yikes!).
The Box-Jenkins forecast, which we have come to trust in most years, has 2015 as nearly flat with 2014, and declining by a little more than $10 billion by 2020. In our opinion, it's the most believable of the models.
With all these forecasting models, what is one to believe? It's not a matter of belief, it's a matter of strategy. Each of these models produces a different business scenario, created in a systematic and objective way, that might possibly occur. These scenarios should be part of the business planning process. Everyone knows that businesses should have a pessimistic, optimistic, and most likely forecast. But the question always is how pessimistic and how optimistic? Some business executives routinely make optimistic +10% and pessimistic to be -10% or something like that, but these models clearly offer a different approach.
These models can be used to define those parameters in a systematic way. What if 2020 is $88 billion (exponential smoothing, optimistic in this case) or $16 billion (curve-fitting, pessimistic) or $67 billion (Box-Jenkins, most likely).
These are, of course, total industry forecasts. These can be very important to industry suppliers and organizations, but far less important to individual printing companies. Printing companies specialize in geographies, processes, or products, and they all interact to produce different challenges, opportunities, and outcomes. The goal of most businesses should be superior performance in some manner. We know that demand will change because of competition, and we know that product offerings will be shaped by our customers and our entrepreneurial actions.
So when people say "Dr. Joe says the market will be $X," what should the response be? First of all, Dr. Joe says nothing, the data do the talking. Second, my role is to interpret and explain in the process of offering an opinion. It's not whether or the forecasts are right or wrong, but how the forecasts are used. If the forecasts lead to a robust strategic planning process appropriate for that business, then their purpose has been fulfilled.
As far as track record goes, looking back in recent years, and in the article cited above, once the figures are adjusted for inflation (that article was from 2012 and used the value of dollars at the end of 2011), these forecasts have been very good. Except, of course, for the end of 2014, where we finally had a pleasant surprise of a strong fourth quarter. I always want to be wrong as underestimating the forecast. The penalties for underforecasting a little are far less than overforecasting. Underforecasting means that a business had more sales with expanding margins. Overforecasting means that companies have declining margins and run up against their fixed costs more quickly.
So what is it that Dr. Joe actually says?
- Forecasting can be an intensely political process filled with intimidation by top executives and bias in sunny interpretation of trends. Using statistical methods as part of forecasting processes means that a systematic, objective, and disciplined method is part of the planning process. As seen above, some of the optimistic, most likely, and pessimistic scenarios can be defined more easily, and expose some scenarios that would not otherwise be considered. Forecasting software is relatively easy to run; interpreting it may require some help, but it is worthwhile.
- All businesses should adjust their financials for inflation. A 2% annual inflation rate means that the difference between the first year in a 10-year history will be 22% off, with compounding, the most recent year. So if a business is 25% bigger than it was 10 years ago, executives should not be patting themselves on the back for a 25% increase, but wondering why after 10 years their business is only 3% (25%-22%) bigger than it was. Use inflation adjustment to see your real trends.
- The curve forecast, which we described above as "aggressive," indicates a $16 billion printing industry in 2020. That forecast is likely to be very wrong. But in considering these kinds of forecasts, we often find creative ideas that help us understand the way our industry works and the way the industry might be. That forecasting method helped me understand our industry structure and how it was changing in the 1990s, and still to this day is the forecast I don't use for industry sizing but is the one I use to think about the nature of our business.
- I have consistently found that the Box-Jenkins models give me the best and most realistic forecasts. That can be temporary; no forecast model can be right all the time because people and trends are always being created in a very dynamic market. But it's a relatively basic moving average technique; some more sophisticated models are not worth the effort.
- Revise your forecasts often. We run our models at least twice a year. We found that running the models monthly was too frequent. Just because software makes it quick and easy does not mean you should do it.
- Experience and hard facts are the most important parts of a forecasting process. Keep your hopes separate from realities. Know what the hard realities are in a truthful way. Then you can put what you hope for your business in proper perspective, translating what might happen from luck to what can happen with clarity about needed resources and capabilities. It's hard to stay objective, especially if compensation schemes are tied with forecasting.
- Make sure you keep goals and forecasts separate; they have quite different purposes. Too many top executives confuse them.
My forecast for 2015 is a slight decline in current dollars, and a -2% real decline overall. This means a $76.5 billion forecast for the year. My 2020 forecast is $62 billion in real terms. I have been forecasting more pessimistically for the "out years" but am not now. On the positive side, there could be significant cost reductions and production flexibility coming from some of the developments in commercial production level ink jet investments. They may not affect our business in a substantial positive way until 2018, so it literally remains to be seen and believed. But I can turn on a dime if I see another digital media jolt, like social media was, or an economic downdraft from geopolitical events or monetary collapse.
But if I didn't say that, I wouldn't be known as "Dr. Doom," would I?
* * *
An important consideration in all of these statistical manipulations is that data are always subject to revision, and the data used here are not exempt. New GDP data go through three revisions, and historical data for the last three to five years are revised again. In mid-May, we will get revisions to printing data for the last three years of data, in which we expect some slight revisions to make 2014 higher. We will run these models again at that time. But any business decision that hinges on slight changes to forecasting models is usually a business that is likely in trouble.
# # #