How did the biggest metropolitan areas fare in the recovery? Some did better than others.
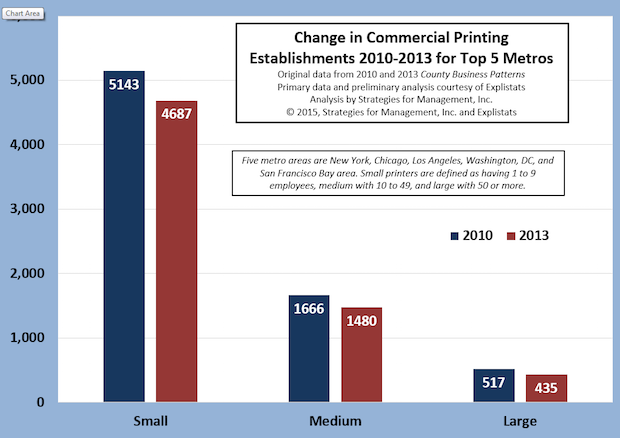
With the assistance of economic statistics firm Explistats, we have examined data from 2010 (collected less than a year since the official start of the recovery) and compared them with 2013 (the latest data available). We have selected the metro areas of New York, Los Angeles, Chicago, Washington, DC, and the San Francisco Bay area for the analysis.
The chart shows the change in establishments for these areas.
The data originate from the Census Department report County Business Patterns. That data series is compiled using employer Social Security tax filings as its main base. Data are released every year, and the most recent data are from 2013. The BLS uses the week that includes March 12 as its basis for reporting.
The table shows the number of establishments and percentage changes for three different employee size ranges for 2010 and 2013. The total for these five areas as well as the rest of the US is also included.
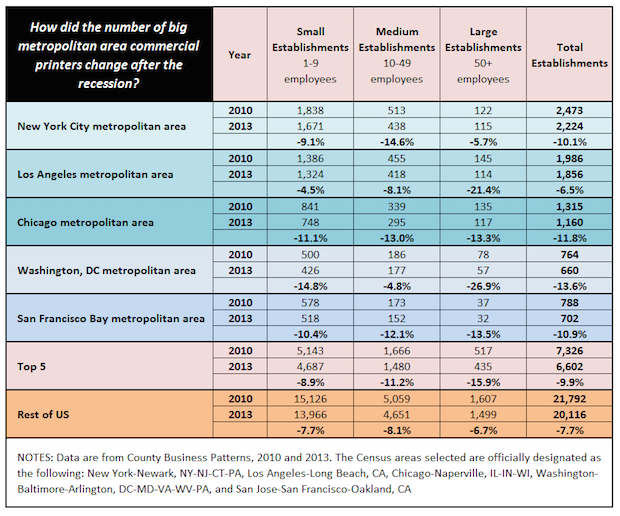
In New York City’s metro area, medium-size printers (10-49 employees) changed the most, declining from 513 to 438, a -14.6% drop. Many of these would have shifted into the small employee range, while others would have closed or consolidated. That consolidation might be the reason large printers (50+ employees) declined only -5.7%. In other metros, that was the smallest decline in large establishments. For the five metro areas overall, large printers fell by -15.9%, by -82 establishments, and only -7 of that was in the New York area.
The Los Angeles area had a steep decline in large establishments, but the smallest decline in the total number of printers, only -6.5%.
The Chicago area had a -11.8% decline in establishments, -155, and that decline was almost evenly dispersed across plant sizes.
The Washington, DC area had a different experience, with medium-size printers declining little (-4.8%). with steeper declines in small (-14.8%) and large (-26.9%) shops.
The relatively strong San Francisco Bay area economy did not help printers much, since the technologies like digital media are being developed and in high use there. The area lost -86 printing establishments in the period studied.
Overall, the metro areas did not fare as well as those located outside these areas. The number of establishments in the five metro areas declined by -9.9% while the rest of the country declined -7.7%.
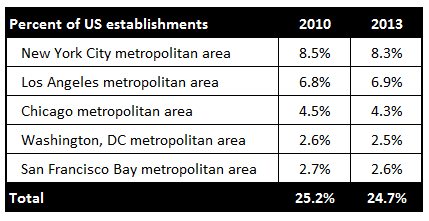
Overall, the metro areas represent about one quarter of the US establishments.
There was a time when being geographically close to customers was critical, with the exception of printers that produced big national publications in Midwest plants. They overcame geographic issues with branch offices close to their publisher clients (and big overnight shipping bills for proofs). Since the advent of digital proofing and various surrogates, and e-commerce, geography is less of an issue than it used to be. The high operating costs in many cities have pushed printers to seek more favorable locations. Nonetheless, there are still substantial sales opportunities that require physical presence for certain sales and delivery-related functions. While media may have changed, there has also been a change in print production processes. These evolutions from desktop publishing and digital prepress reduced the necessity of in-person sales and support interactions. So while personal interactions might not be critical or as frequent anymore, they are still important for many aspects of the print sale and client retention. It may no longer be a 10, but it’s probably an 8.5.
Next week: With the help of our friends at Explistats, we will show how the top US states have changed since the recovery, and we will discuss where they now stand.
Geographic data are essential for sales and logistics decisions. Some of those decisions are strategic, and others are more tactical, of course.
Geographical concentration tends to shift slowly over time. From a vendor perspective, sales coverage has usually been based on sales call models that assumed a certain number of sales calls per day and a presumed number of sales calls for current customers and prospects. That sales call frequency would be determined by the volume of purchases and potential purchases at that account. The other aspect of sales coverage has always been geography. There are always small or distant cities that do not have enough potential according to certain measures to warrant direct sales coverage. For these, dealers and distributors have been the traditional approach as those firms have wide product offerings that make such sales coverage worthwhile.
Digital media have changed the nature of sales coverage. No longer do prospects hunt for information, call an 800 number, and request the mailing of a brochure or a sales visit. With a few keystrokes and mouse clicks in Google or Bing they can usually get the information they need. Therefore, traditional sales workload models in the design of sales territories need to take into account the changes in information flow that digital media have caused. These kinds of geographic and demographic data still have an important use in the design of sales and logistics planning. It is likely, however, that the rush toward marketing automation techniques has created a knowledge vacuum in the practical nature of feet on the ground sales processes.
There are nearly 400 metropolitan areas in the US, defined as having populations of more than 50,000 and economic connections with bordering areas. Each of them have printing businesses, and all of them serve a unique portions of those markets.
Where we have found great value in these data are in the changes over time, and developing an appreciation for the unique aspects of each geographic area. A statistical table makes all of the establishments look the same. But each area has a mix of business dynamics and industrial history that shape the nature of print demand. Through the use of historical data combined with the latest economic releases for states, counties, and metropolitan areas, we can now offer detailed perspectives about the regions that sales and marketing management are most concerned about. These include the estimation of market potential for production materials and capital investment patterns. Many sales territories have been assigned because “they always have been that way.” This means that established areas may have too much coverage and growing areas may have too little. Because we can combine history with new data (from just a few months ago) and identify trends in them, this kind of misallocation of sales and support coverage is less likely to occur.