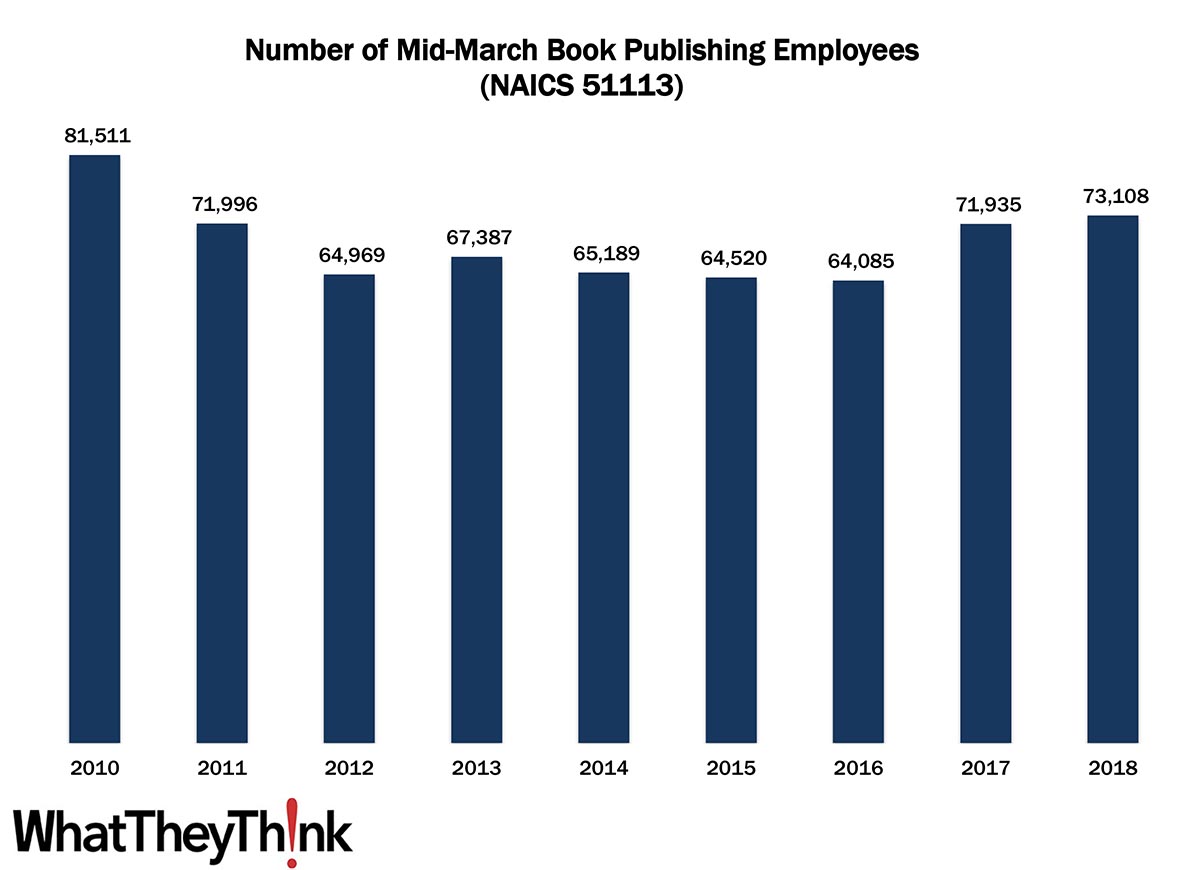
In 2010, there were 81,511 employees in NAICS 51113 (Book Publishing). The numbers declined during the Great Recession, but rebounded slightly in 2013, before starting a slow decline, and then a large increase in 2017 and 2018, ending up with 73,108 employees in 2018. Interestingly, when we looked at establishments, there was no corresponding increase in establishments. There has been a lot of consolidation in book publishing, so it was not unusual to see the number of establishments shrink. The rise in employment could represent the continued health of the book publishing market, and print book sales were on the rise (According to the Association of American Publishers, book publishers’ revenue increased by $143.2 million—+6.2%—in the first quarter of 2018 compared to Q1 2017.) Although ebooks had their moment of glory early in the decade, their sales had been on the decline by decade’s end, although audiobooks remained a hot commodity.
These counts are based on data from the Census Bureau’s County Business Patterns. Every other week, we update these data series with the latest figures. These counts are broken down by printing business classification (based on NAICS, the North American Industrial Classification System). We will continue to look at employment in the publishing categories:
- 51114 Directory and Mailing List Publishers
- 51119 Other Publishers
- 511191 Greeting Card Publishers
- 511199 All Other Publishers
For some of these categories, we will also supplement County Business Patterns data with Nonemployer Statistics, which counts freelancers.
These data, and the overarching year-to-year trends, like other demographic data, can be used not only for business planning and forecasting, but also sales and marketing resource allocation.
This Macro Moment
According to the Wall Street Journal, we are in the midst of an unprecedented economic rebound.
New businesses are popping up at the fastest pace on record. The rate at which workers quit their jobs—a proxy for confidence in the labor market—matches the highest going back at least to 2000. American household debt-service burdens, as a share of after-tax income, are near their lowest levels since 1980, when records began. The Dow Jones Industrial Average is up nearly 18% from its pre-pandemic peak in February 2020. Home prices nationwide are nearly 14% higher since that time.
Of course, as we have been seeing in the printing industry, “The speed of the rebound is also triggering turmoil. The shortages of goods, raw materials and labor that typically emerge toward the end of an expansion are cropping up much sooner.” We like to think of it as “good problems to have”—we’ll take it over last year at this time—and while the spike in inflation is likely temporary, there are some fears that it could be permanent once the reopening is complete. Still, analysts are expecting GDP growth to snap back to the path it had been on before the pandemic. It’s nice to have good news for a change.


