Data Analysis
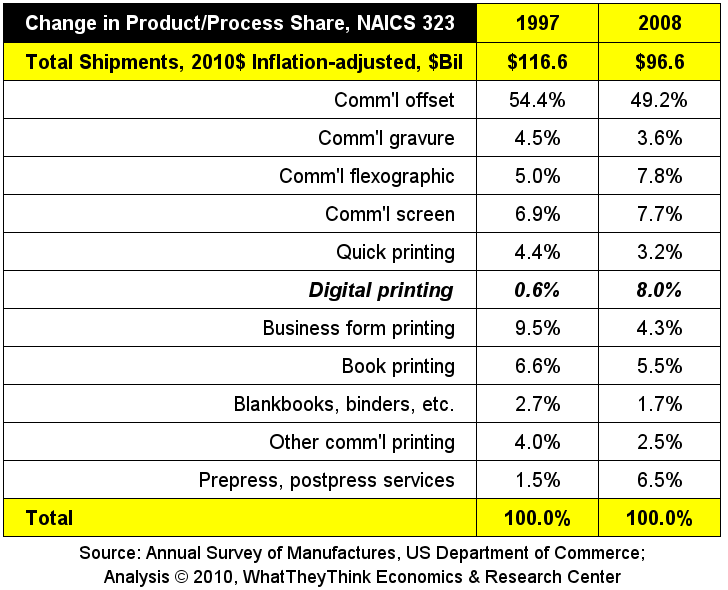
Change in Commerical Printing Segments 1997-2008
Published: July 19, 2010
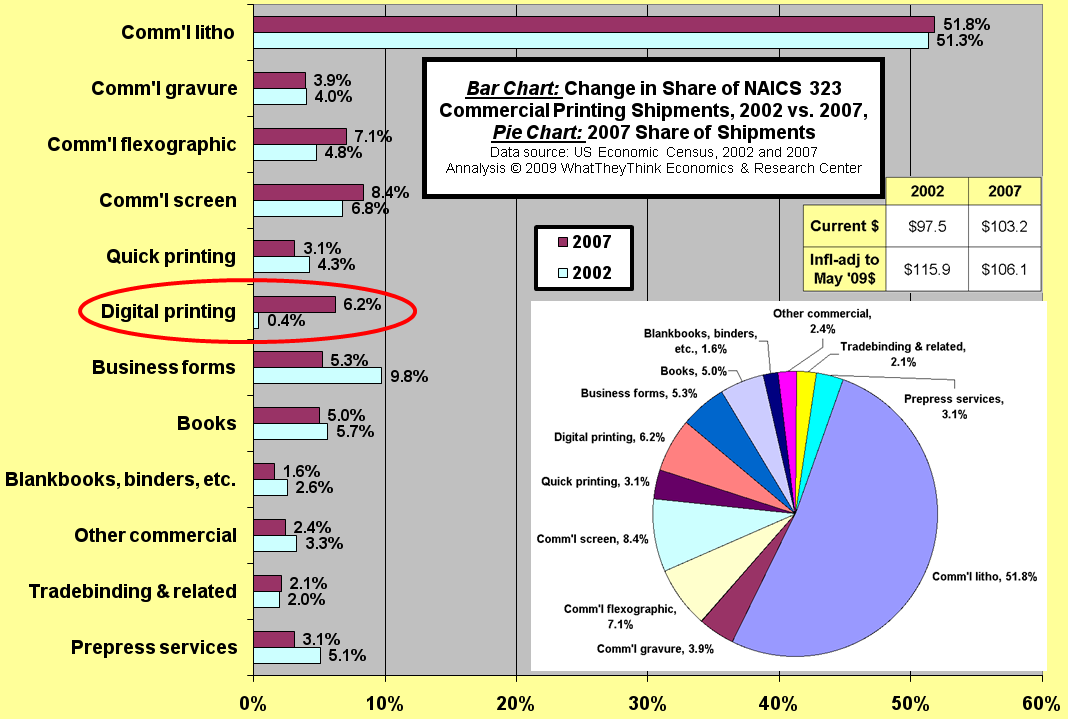
Dr. Joe discusses how commercial printing segments have changed their share of industry shipments from 1997 through 2008, and why digital printing's share might be even larger than the data indicate. Full Analysis
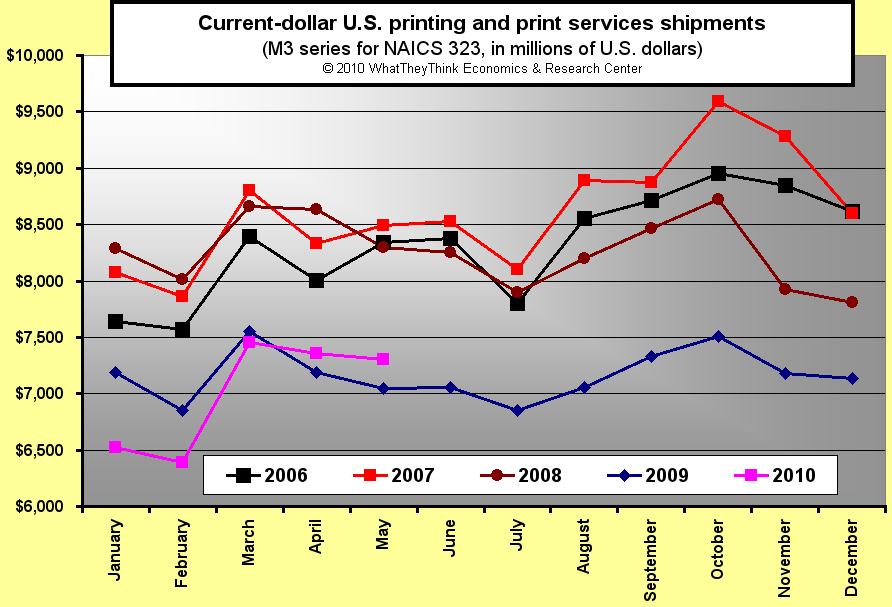
May U.S. Commercial Printing Shipments Up +3.6%
Published: July 6, 2010
May's shipments were up compared to 2009, and April's were revised significantly upward. This is the first time since early 2008 that the industry produced two consecutive months with shipment increases. For complete details see this month's printing shipments report. Full Analysis
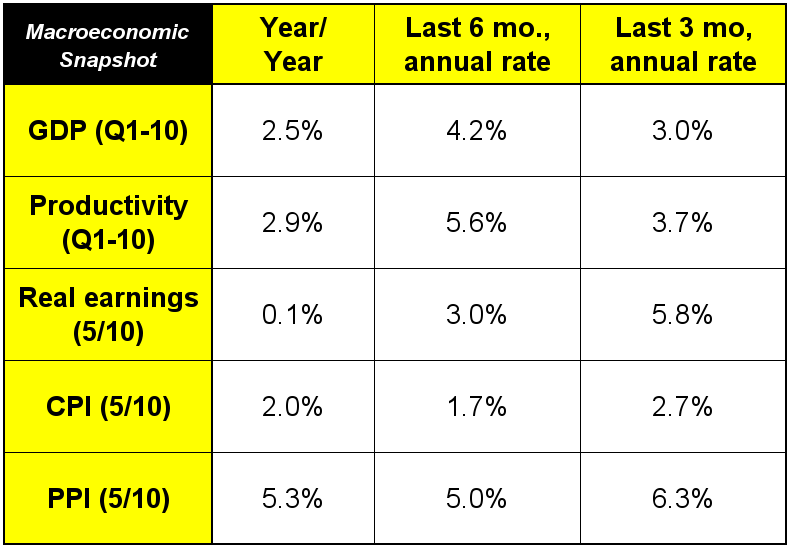
Dr. Joe reviews the latest economic data
Published: June 21, 2010
Dr. Joe reviews the latest economic data and explains where we're headed for the third and fourth quarters and why. Full Analysis
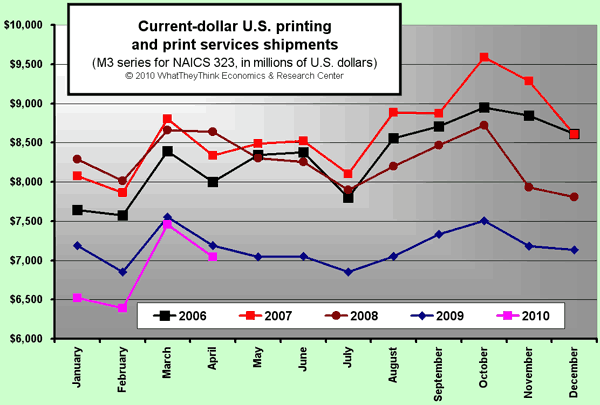
April 2010 commercial printing shipments
Published: June 7, 2010
April 2010 commercial printing shipments were $7.05 billion, down -1.9% compared to 2009. Adjusting for inflation, shipments were down -4.1%. For the first four months of 2010, shipments were down -4.7% on a current dollar basis. Full Analysis
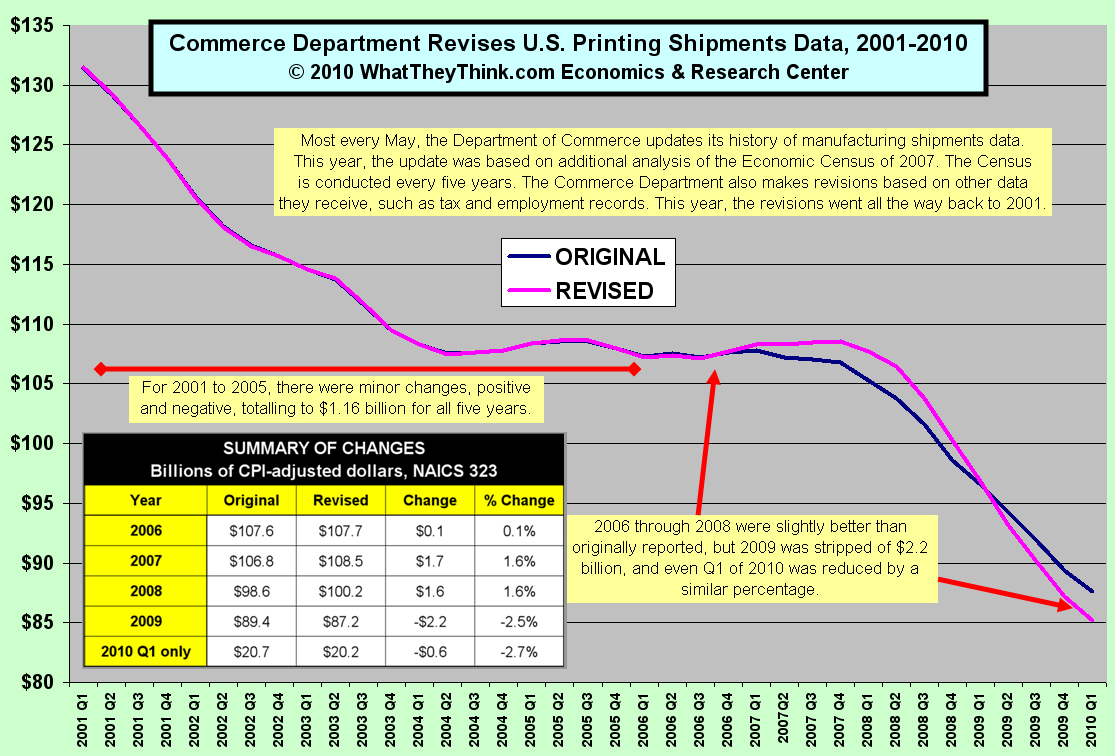
Commerce Department Revises Printing Shipments Data
Published: May 17, 2010
The Department of Commerce revised almost 10 years of printing industry shipments data last week. The WhatTheyThink economic data elves dug into the data and explain what those revisions mean, what years were revised up, and which ones were revised down. Full Analysis
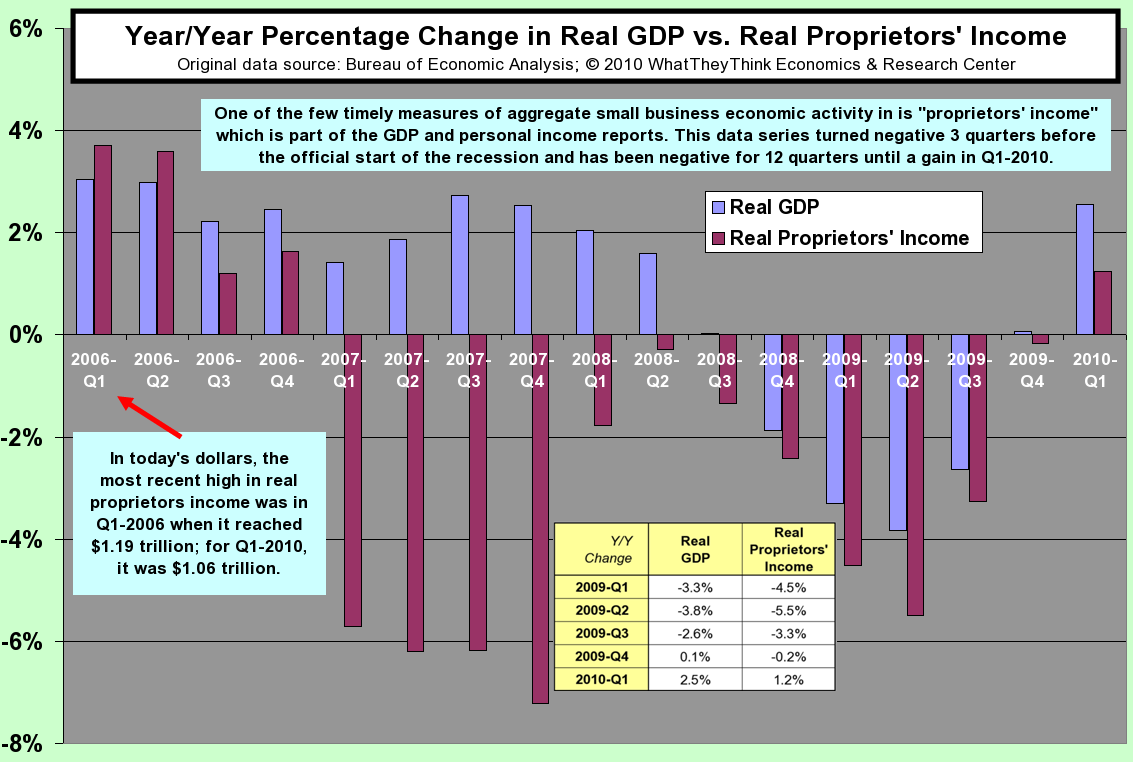
Year/Year Changes in Real GDP vs. Real Proprietors Income
Published: May 3, 2010
The first quarter GDP showed that the economy is growing, but that was compared to the fourth quarter. How is GDP changing on a year-to-year comparison? The GDP data are about the whole economy, but how is small business doing? Dr. Joe explains how a rarely reported part of the quarterly GDP data helps us judge the health of small businesses. Full Analysis
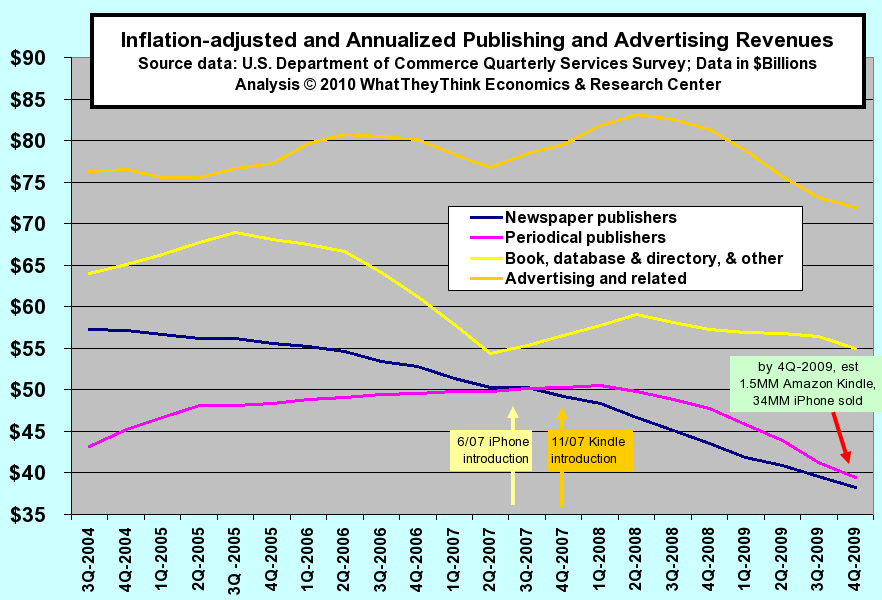
Inflation-adjusted and Annualized Publishing and Advertising Revenues
Published: April 19, 2010
The trends in industry revenues of advertising and publishing sectors each tell an interesting story. They get more interesting once iPhones, Kindles, and iPads are added to the mix. Dr. Joe explains it all, but may have more questions than answers, which might spell opportunities for print businesses. Full Analysis
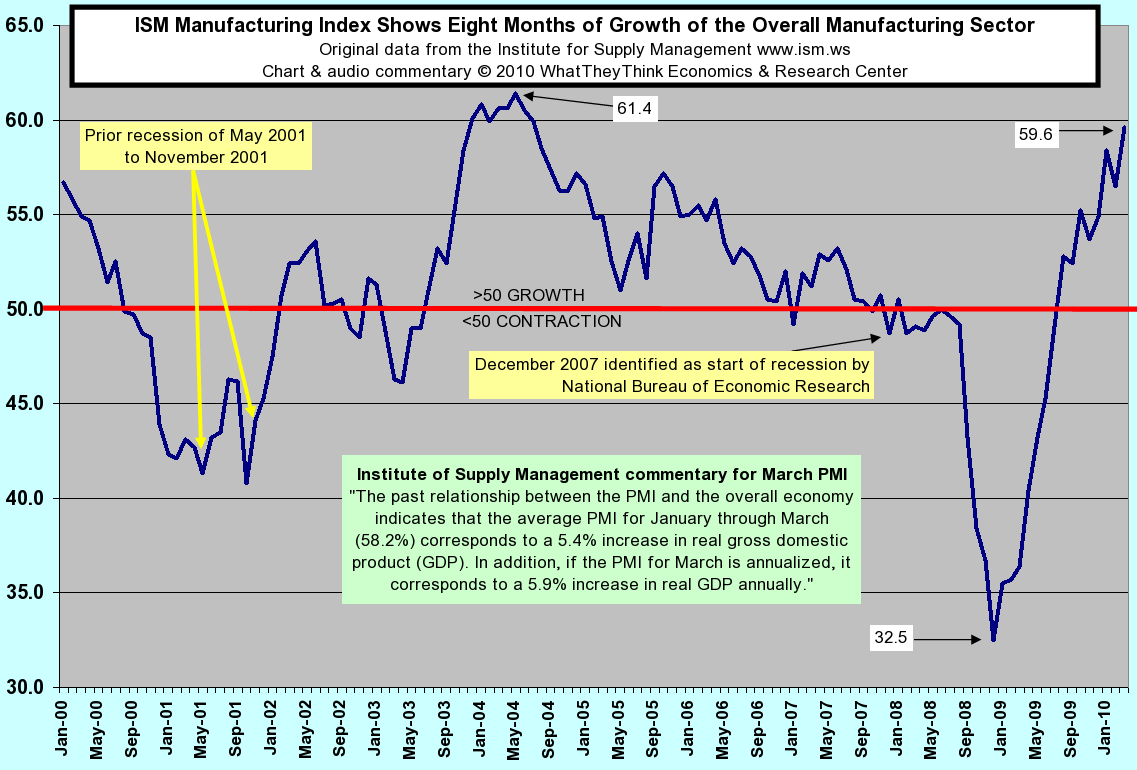
ISM Manufacturing Index Shows Eight Months of Growth
Published: April 5, 2010
The ISM Manufacturing Index is one of the most watched economic indicators. It's up for 8 consecutive months, and the latest release was one of the strongest of this decade. Dr. Joe gives some background and explains what this latest reading means. Full Analysis
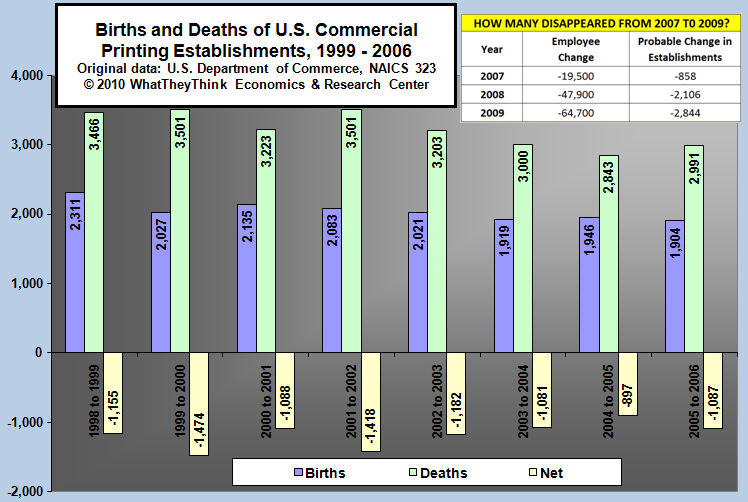
As The Industry Churns
Published: March 15, 2010
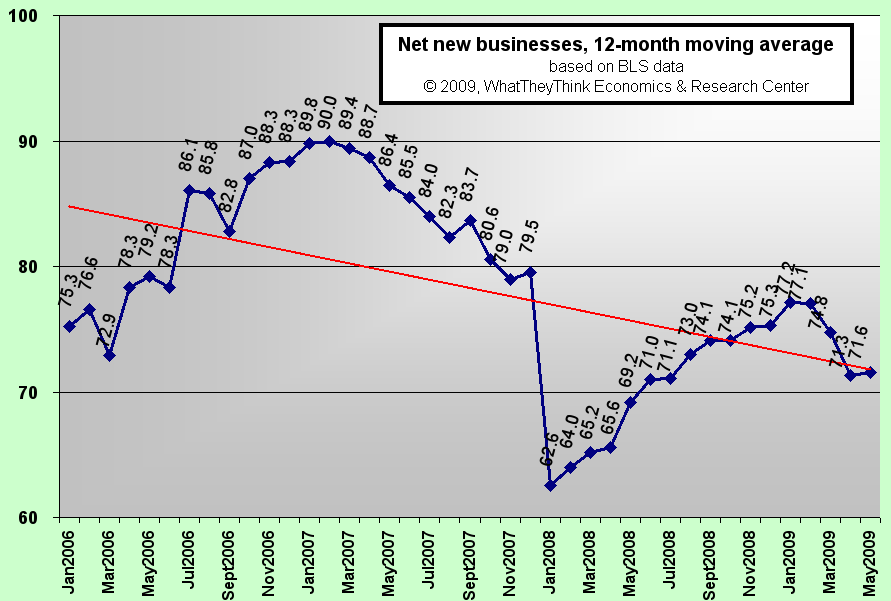
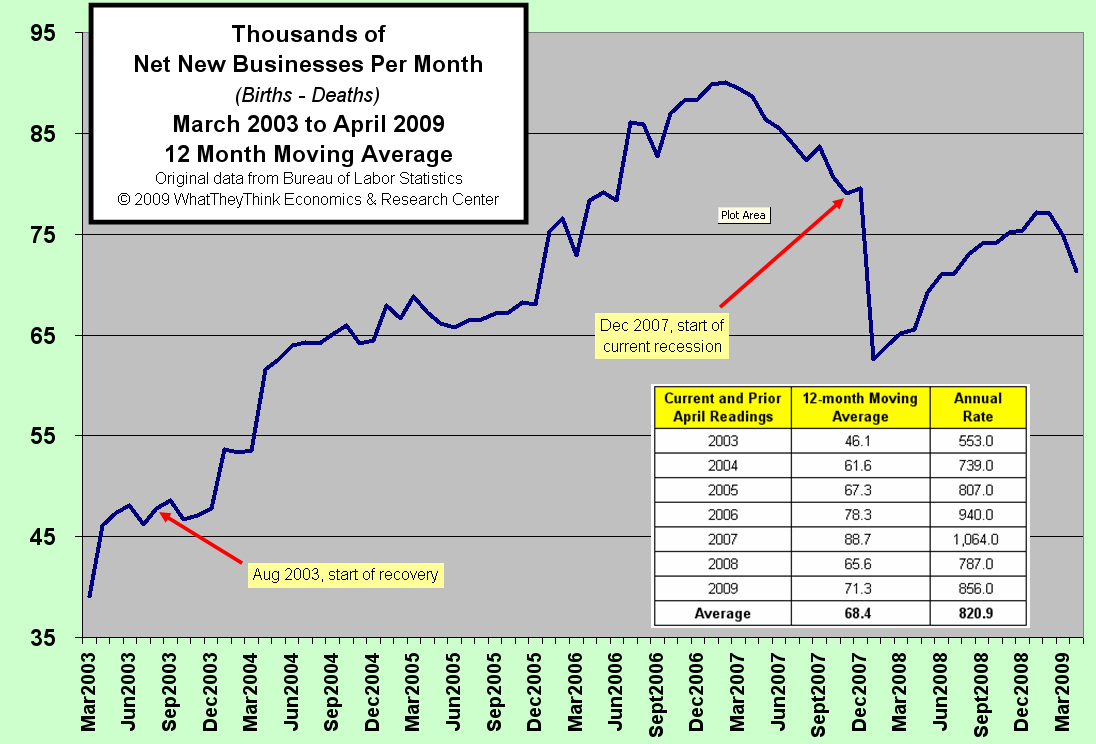
The Census Bureau publishes printing industry births and deaths data, but the data take years to be published. The latest data are from 2006, but Dr. Joe estimates what's happened since,especially 2008 and 2009. Full Analysis
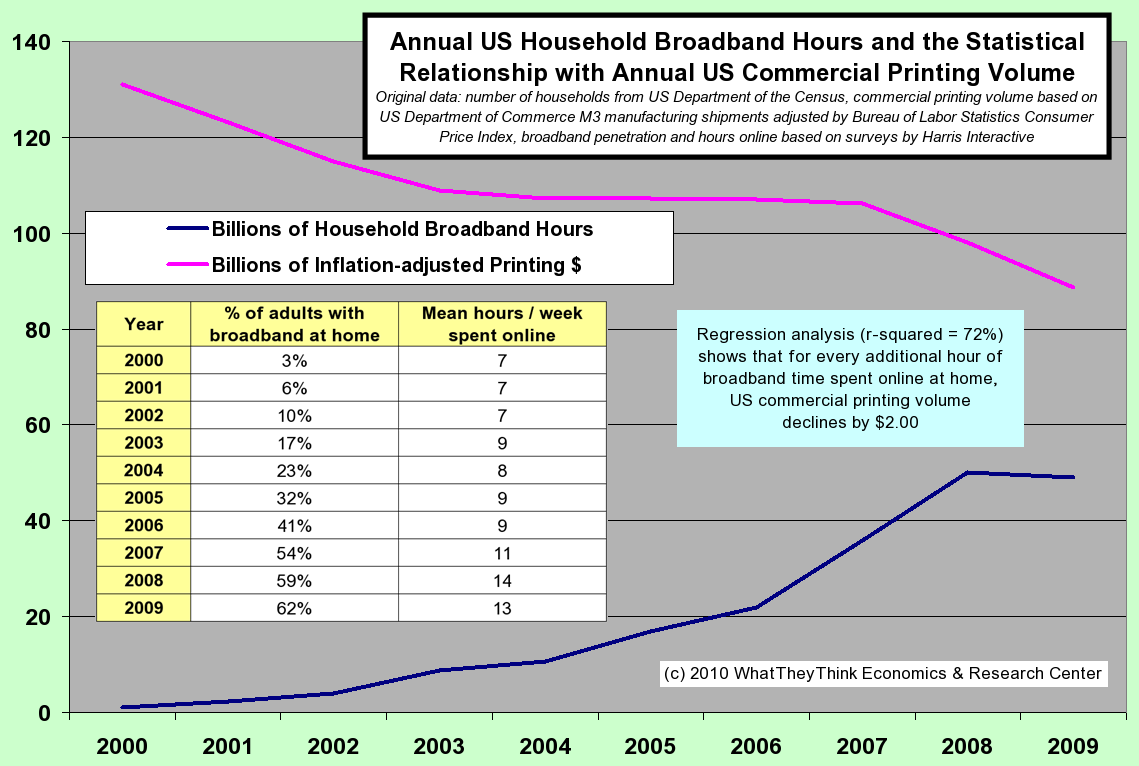
Broadband hours and the statistical relationship with printing volumes
Published: February 15, 2010
Broadband use by adults has been increasing and the number of households with broadband service has almost doubled since 2005. What's the relationship with commercial printing volume? Last year, there were about 48 billion hours of broadband use by households, and every additional hour of use decreases commercial print volume by about $2. Full Analysis
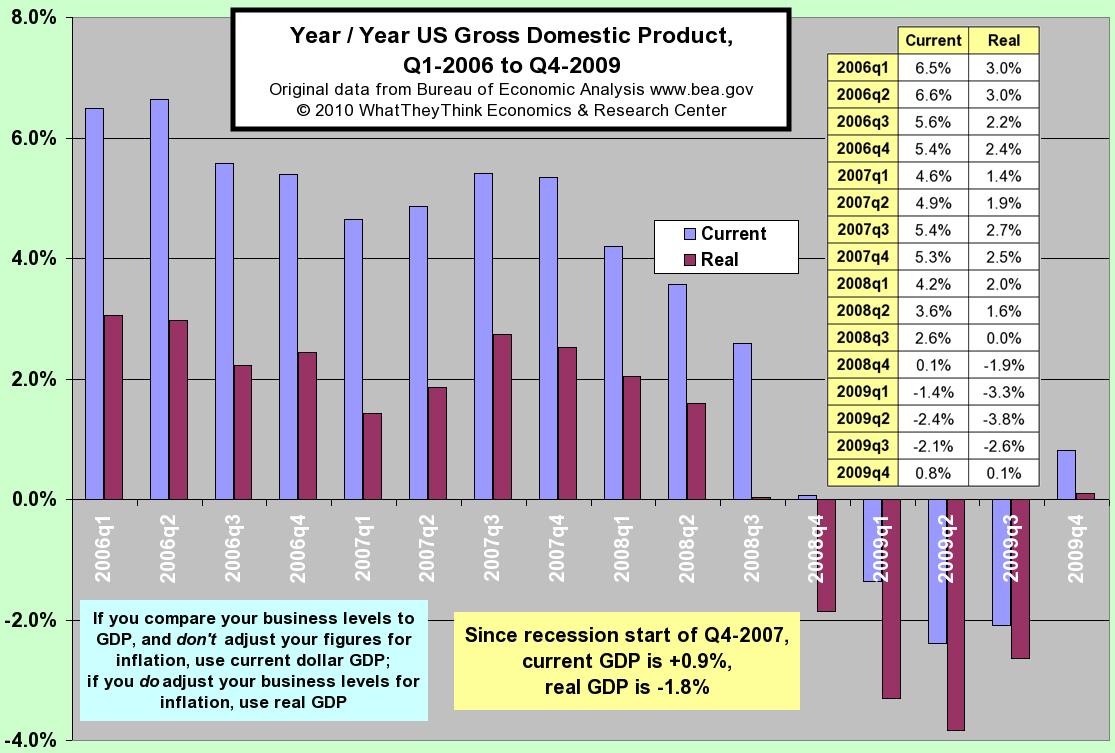
Year/Year US Gross Domestic Product
Published: February 1, 2010
Why was Q4-09 GDP +5.7% met with a stock market decline and more handwringing about the economy? Dr. Joe looks at the yearly change in GDP, and explains it all. Full Analysis
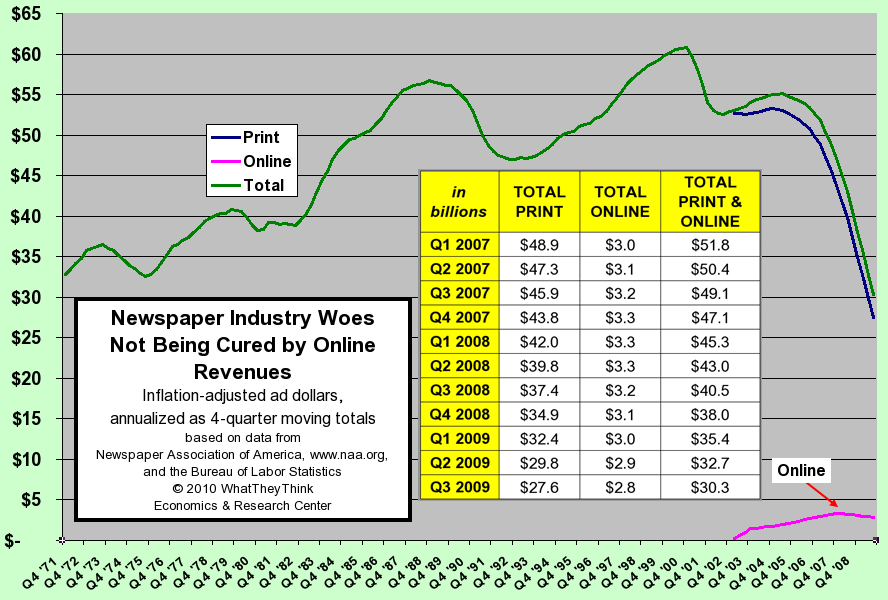
Newspaper Industry Woes Not Being Cured By Online Revenues
Published: January 25, 2010
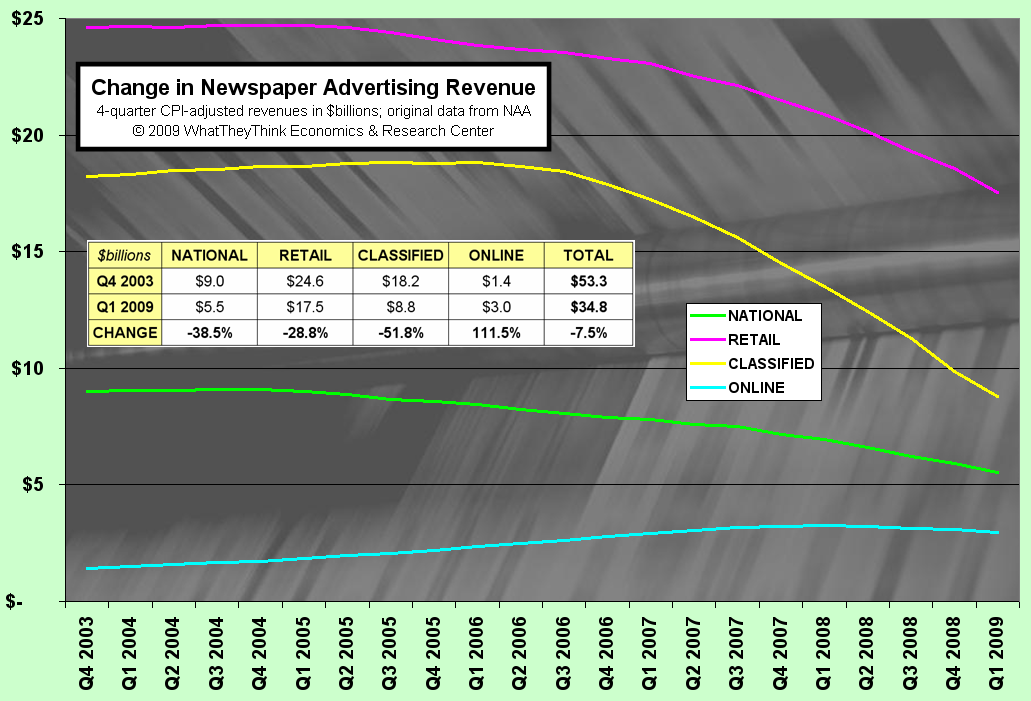
Newspapers were supposed to survive the new media age because of their highly educated, high income audience, and then when that didn't work, their superior content would make news websites into Internet advertising magnets. Now, even online advertising is shrinking for newspapers. What's next? Full Analysis
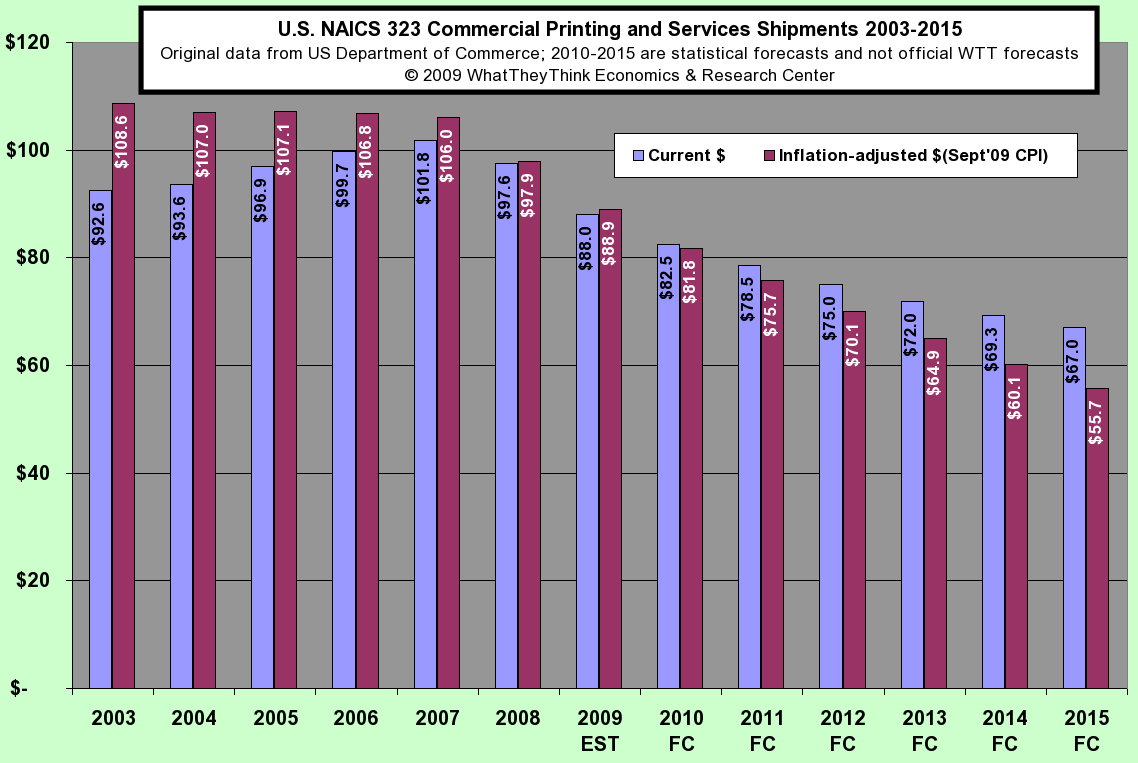
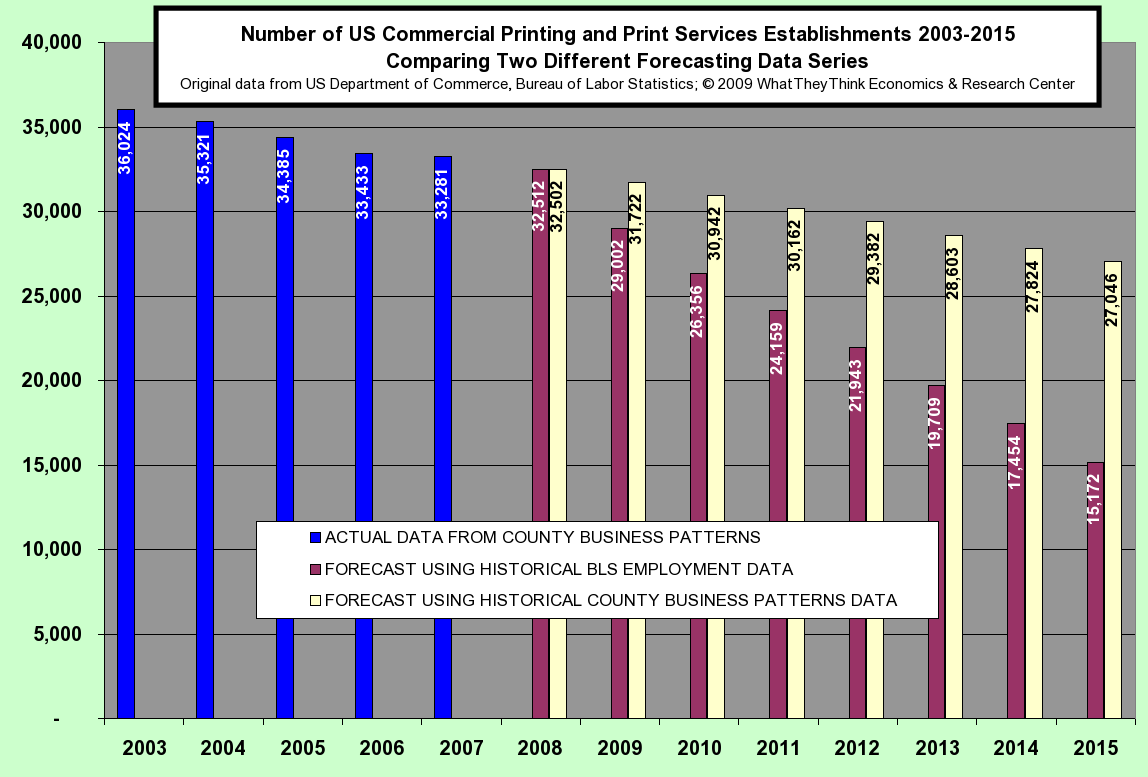
Number of US Commercial Printing and Print Services Establishments 2003-2015
Published: December 7, 2009
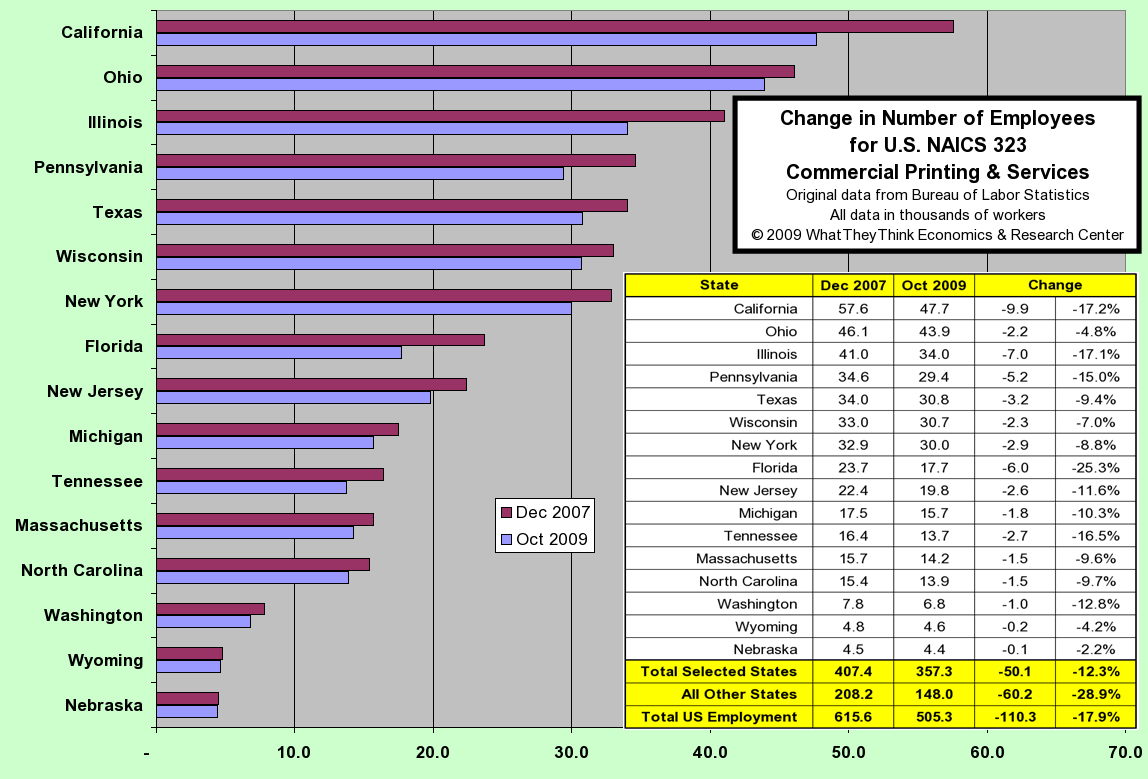
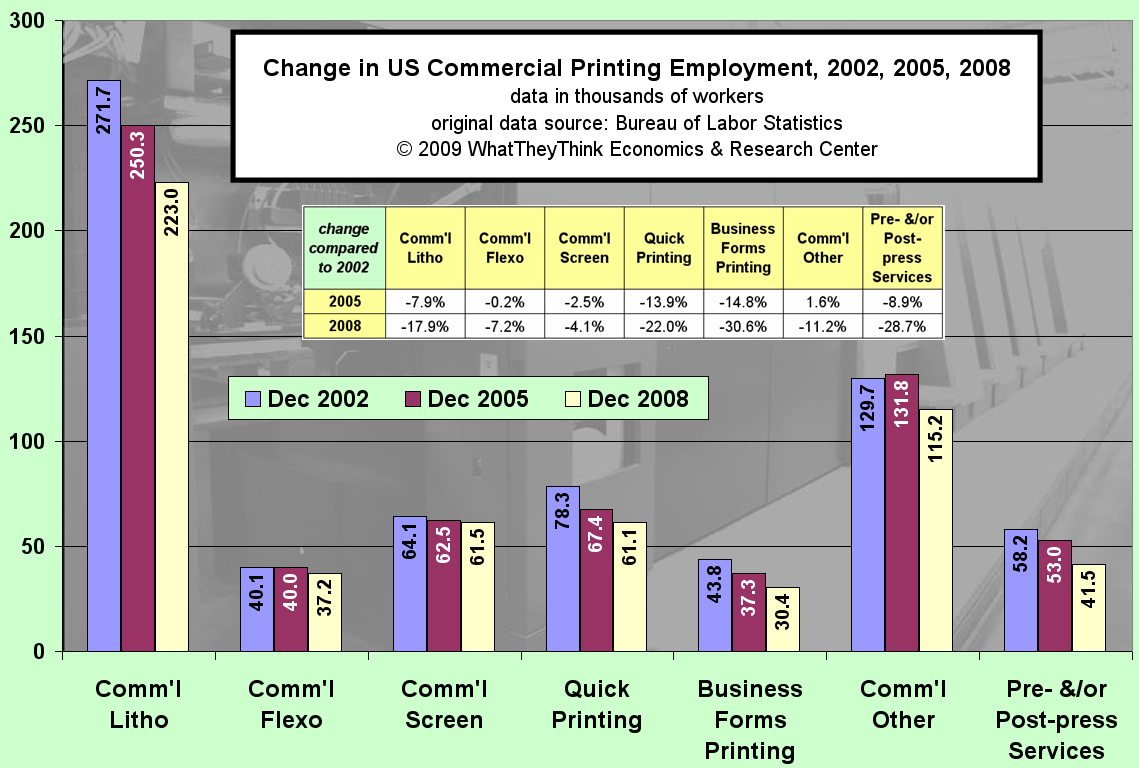
Change In Number Of Employees For Commerical Printing & Services
Published: November 30, 2009
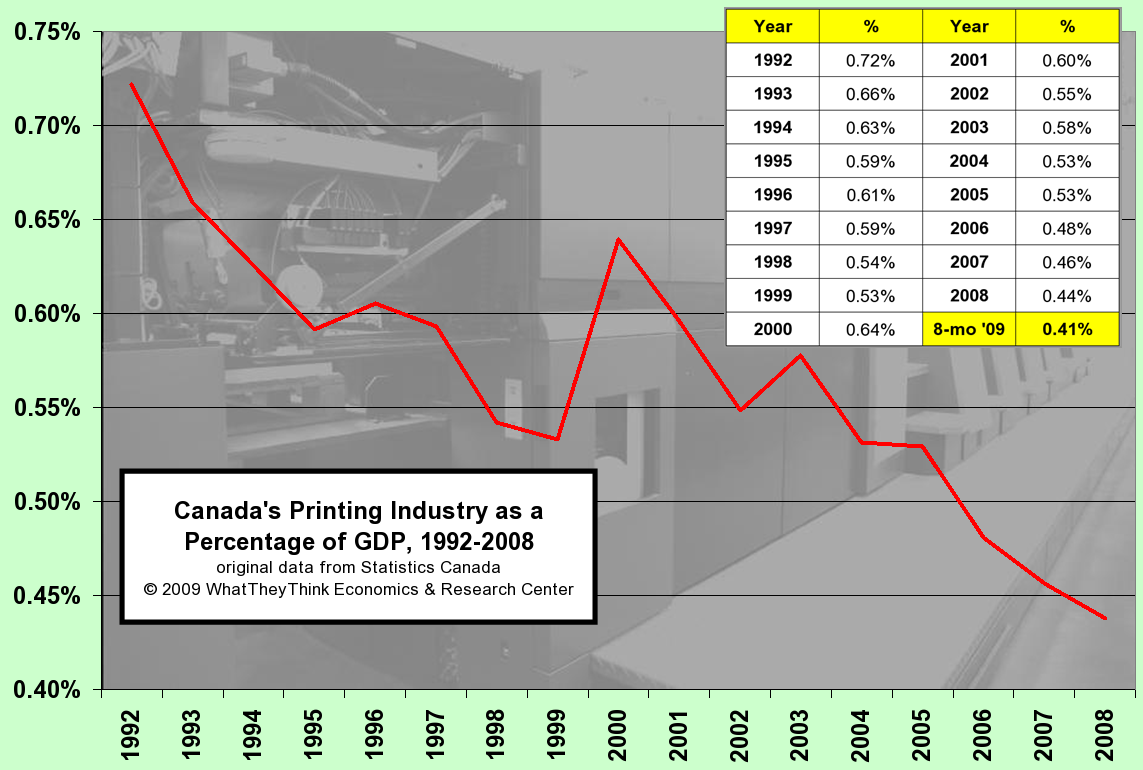
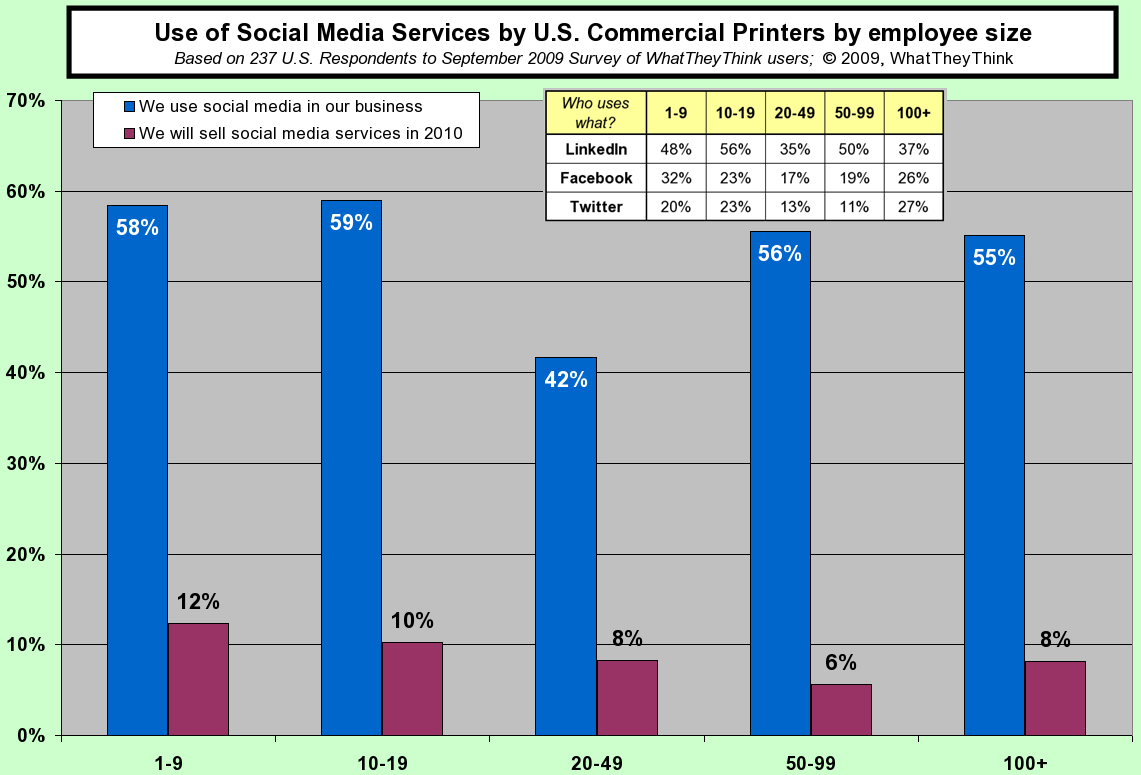
Use of Social Media Services by Commercial Printers by employee size
Published: November 2, 2009
Use of Social Media Services by Commercial Printers by employee size Full Analysis
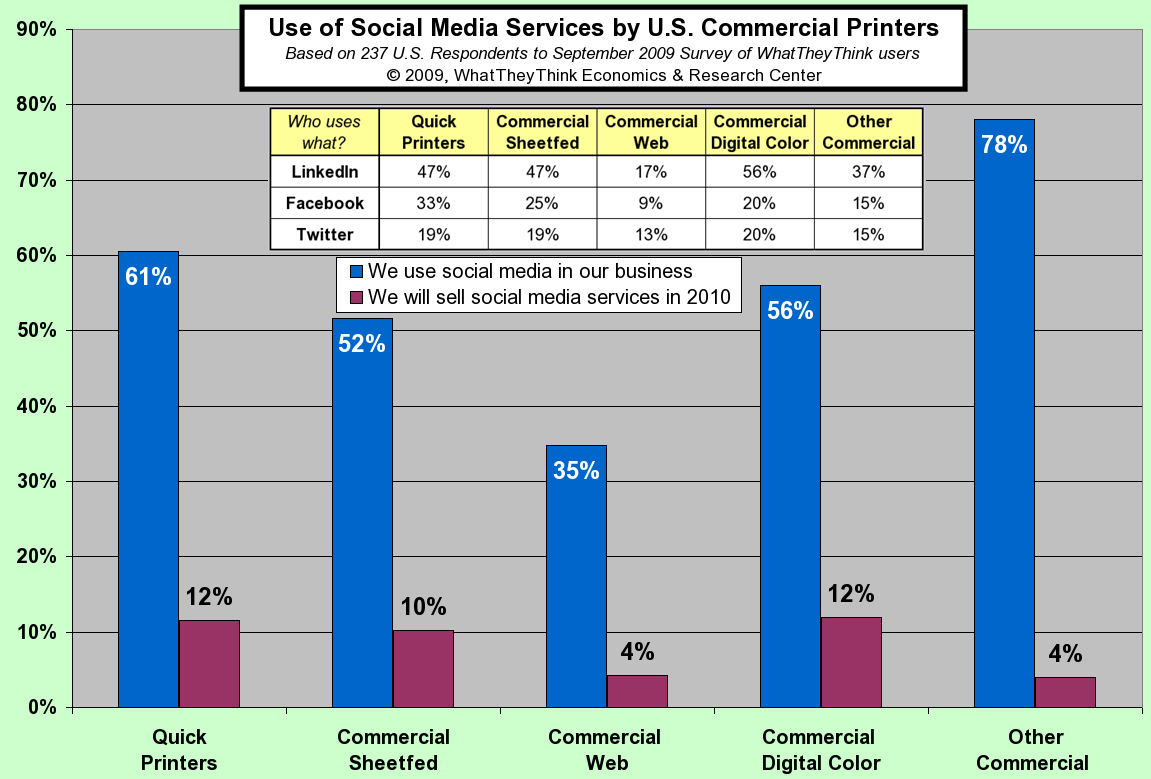
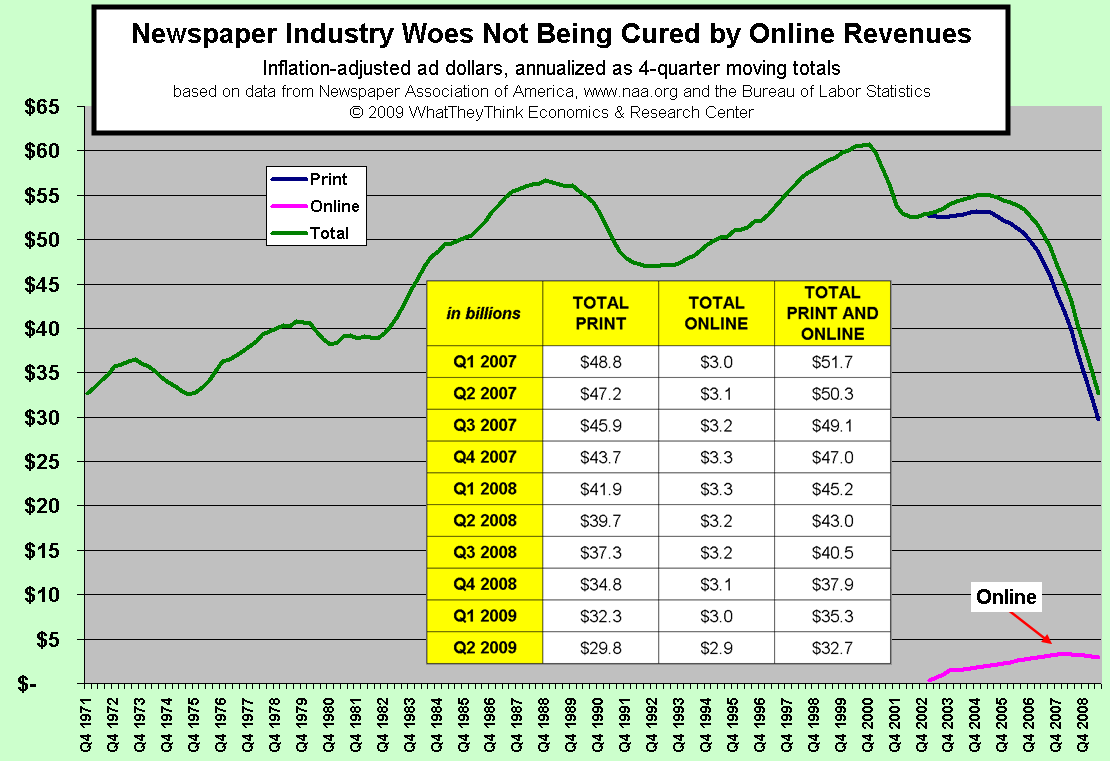
Newspaper Industry Woes Not Being Cured by Online Revenues
Published: October 12, 2009
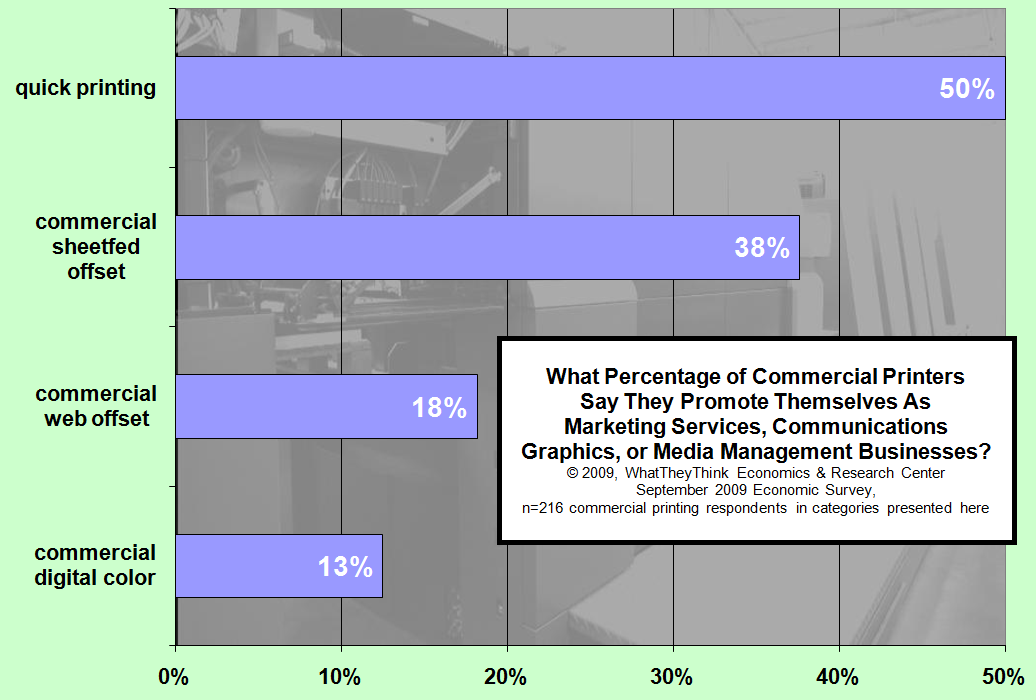
Percentage of Printers That Promote Themselves as Marketing Services, Communications Graphics or Media Management Businesses
Published: October 5, 2009

Effects of a 2-percentage point difference in mailing list decay rates
Published: September 28, 2009
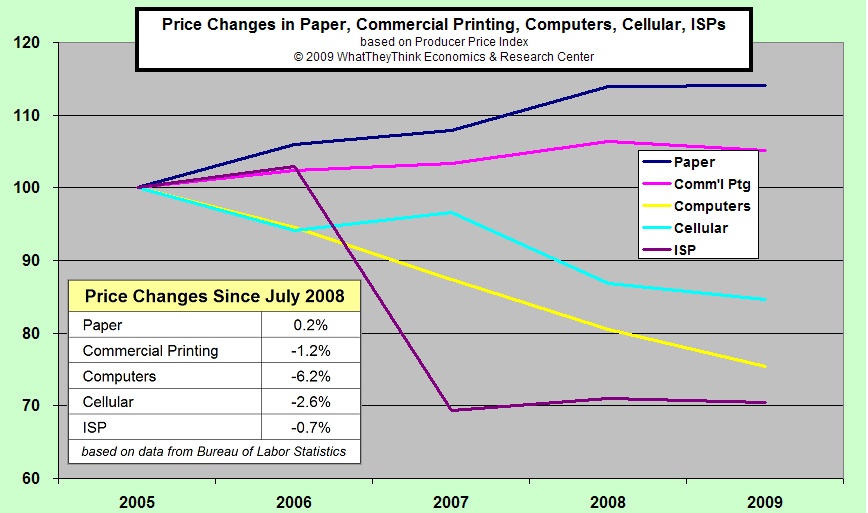
Price Changes in Paper, Commerical Printing, Computers, Cellular, ISPs
Published: September 21, 2009
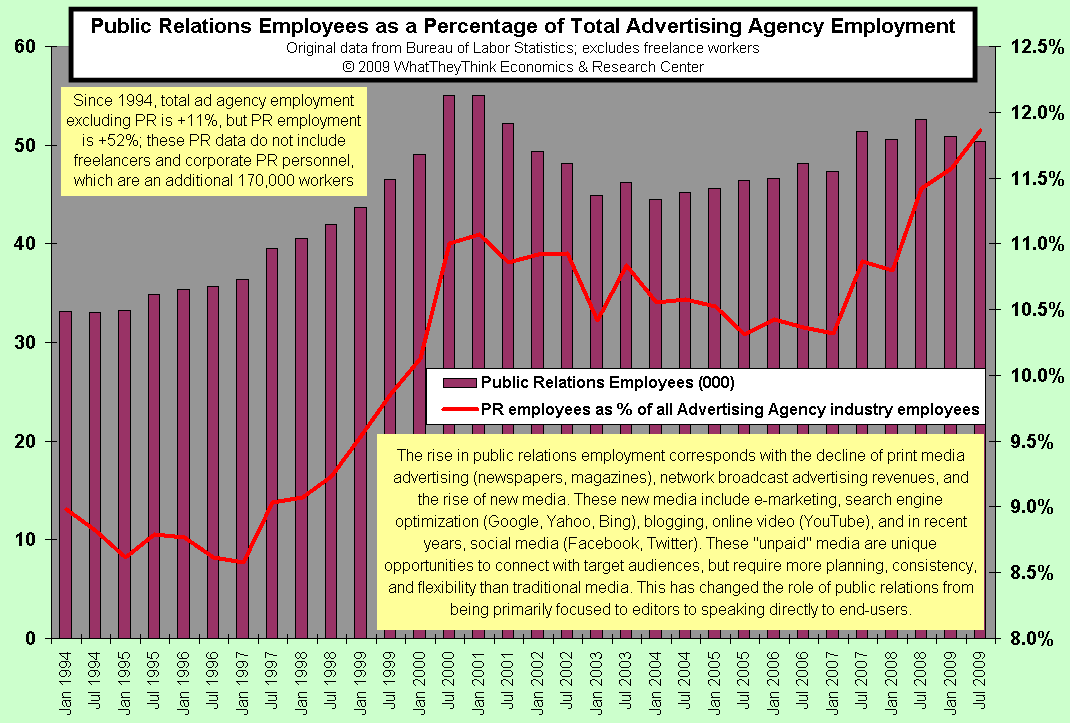
Public Relations Employees as a Percentage of Total Advertising Agency Employment
Published: September 14, 2009
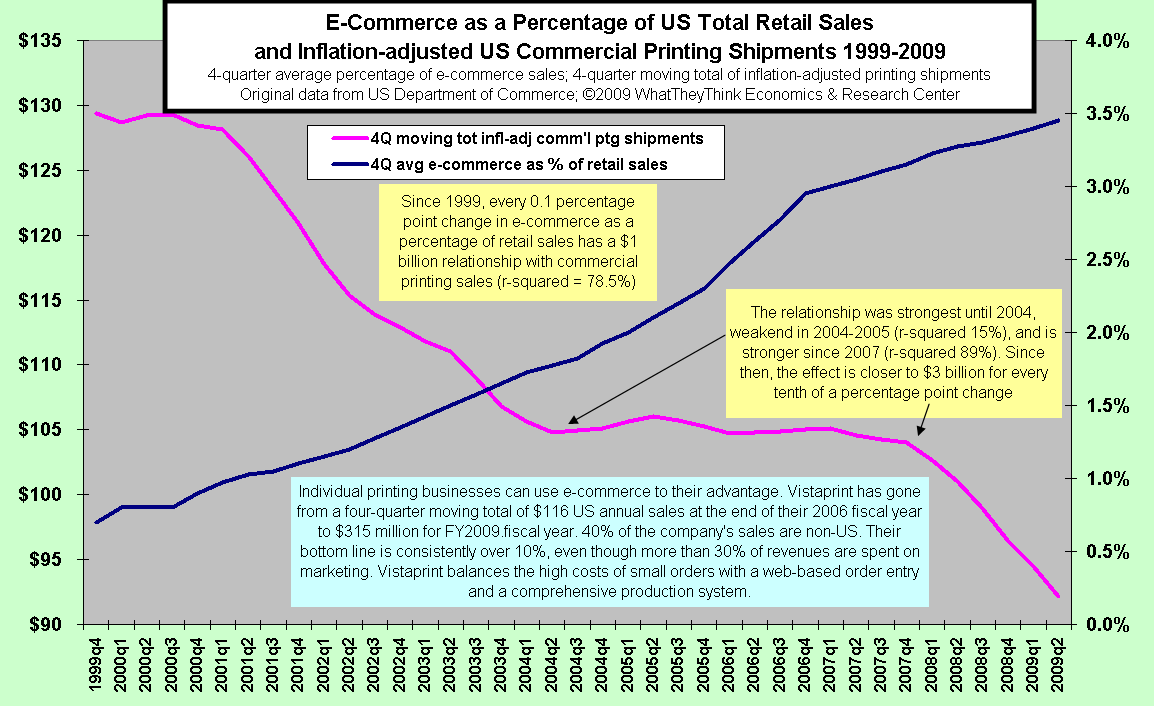
E-Commerce as a Percentage of US Total Retail Sales and Inflation-adjusted US Commercial Printing Shipments
Published: September 7, 2009
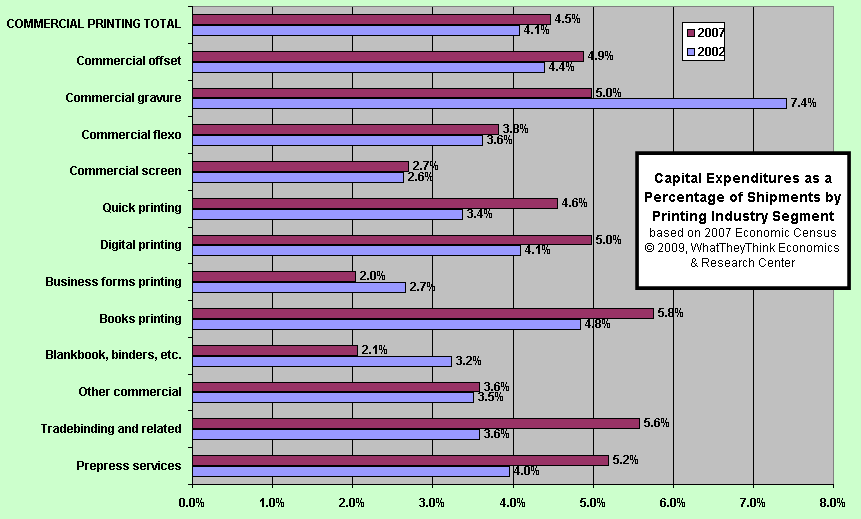
Capital Expenditures as a Percentage of Shipments by Printing Industry Segment
Published: August 31, 2009
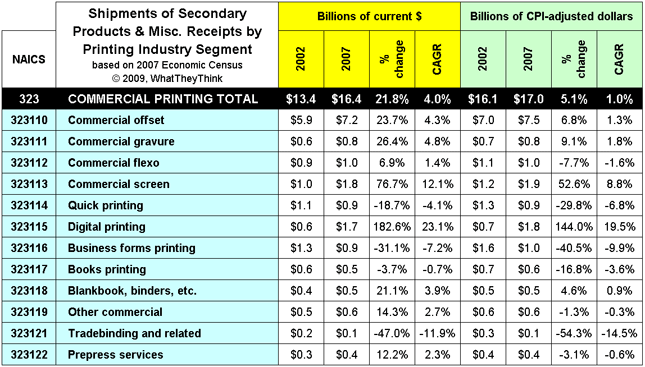
Shipments of Secondary Products & Misc. Receipts by Printing Industry
Published: August 17, 2009
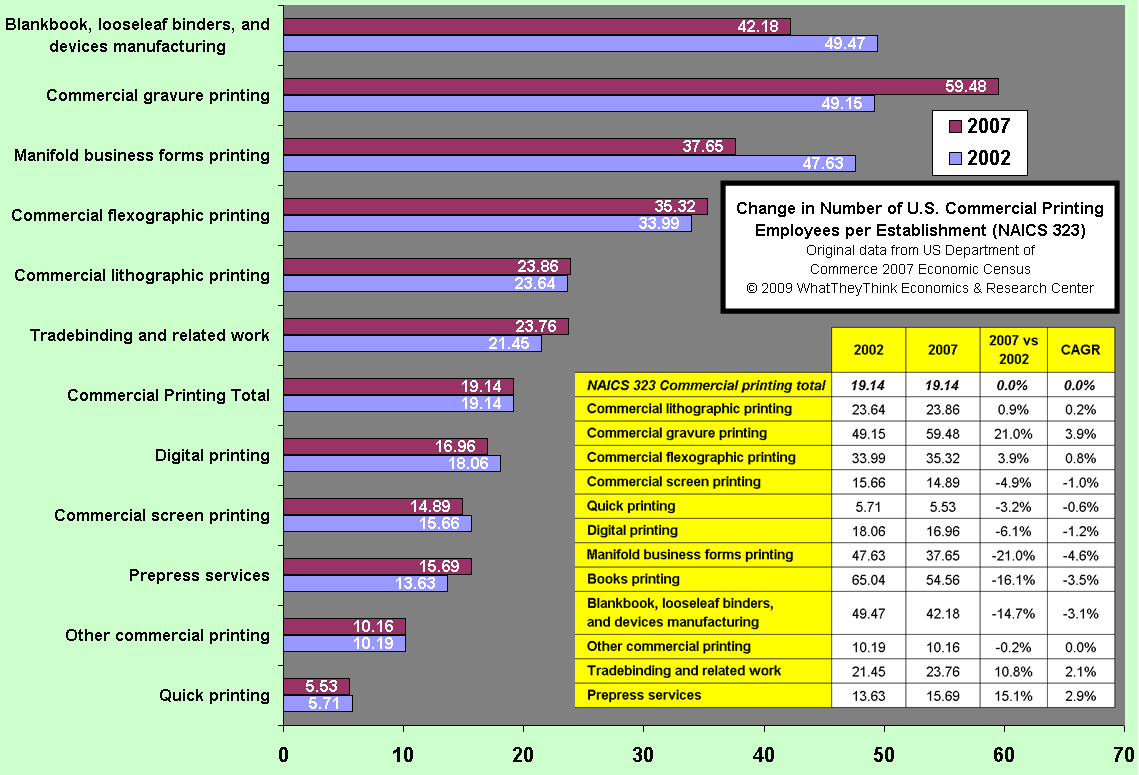
Change in Number of U.S. Commercial Printing Employees Per Establishment
Published: August 10, 2009
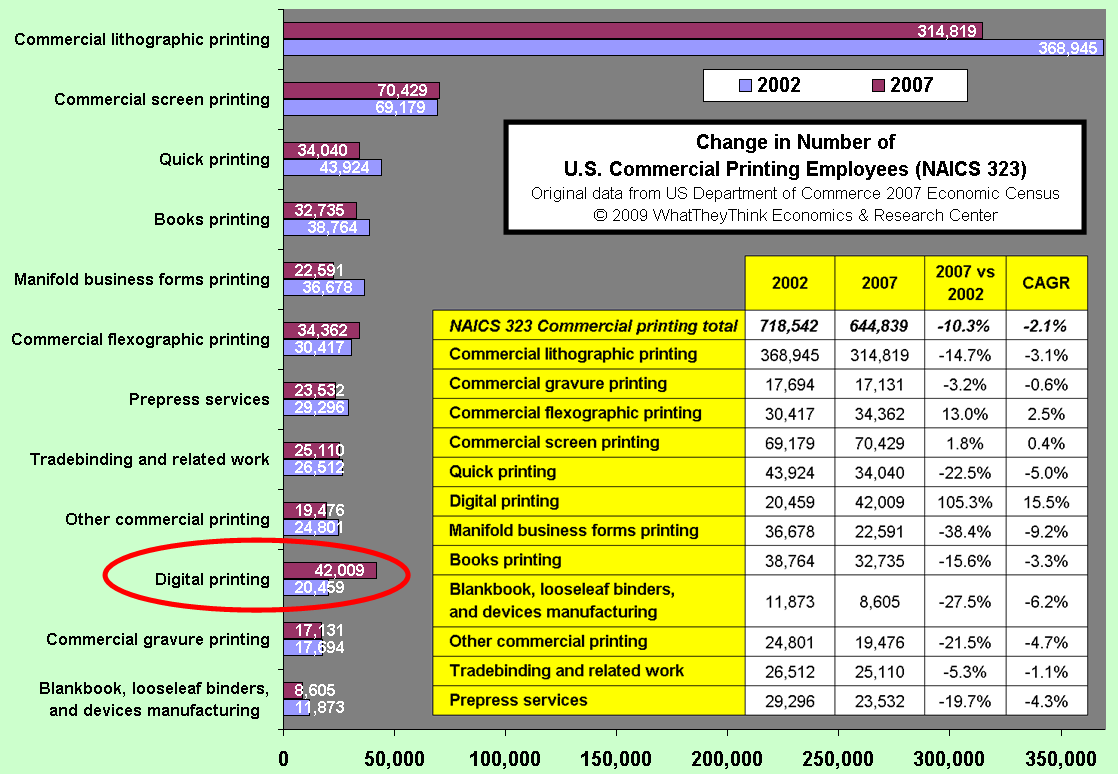
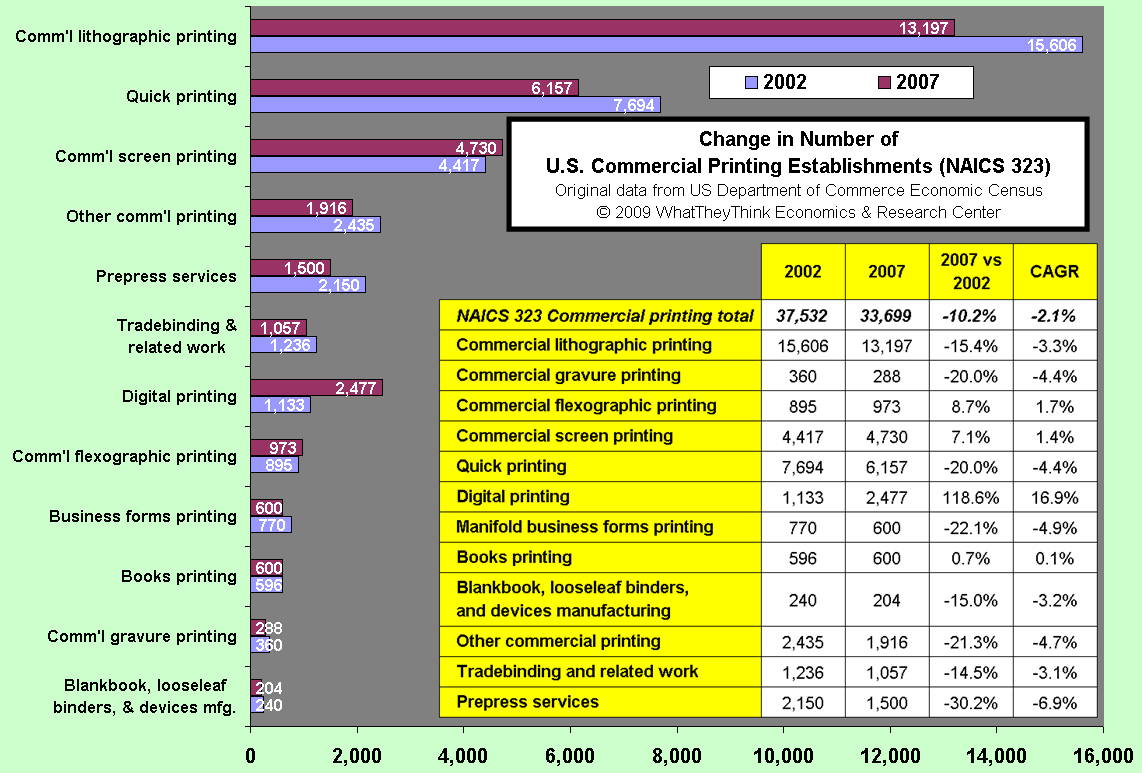
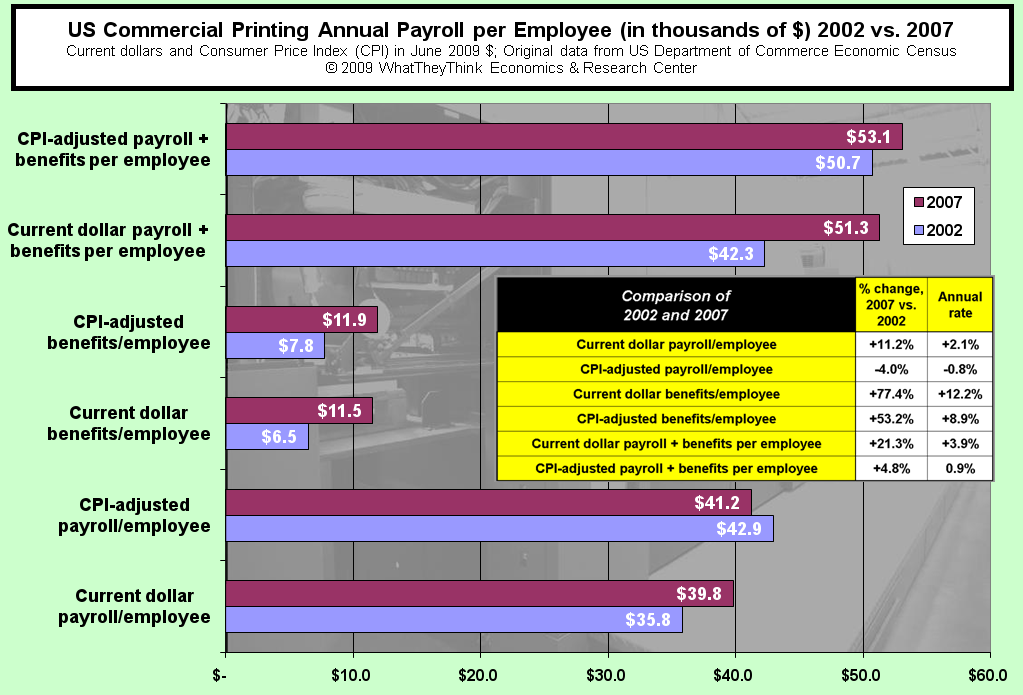

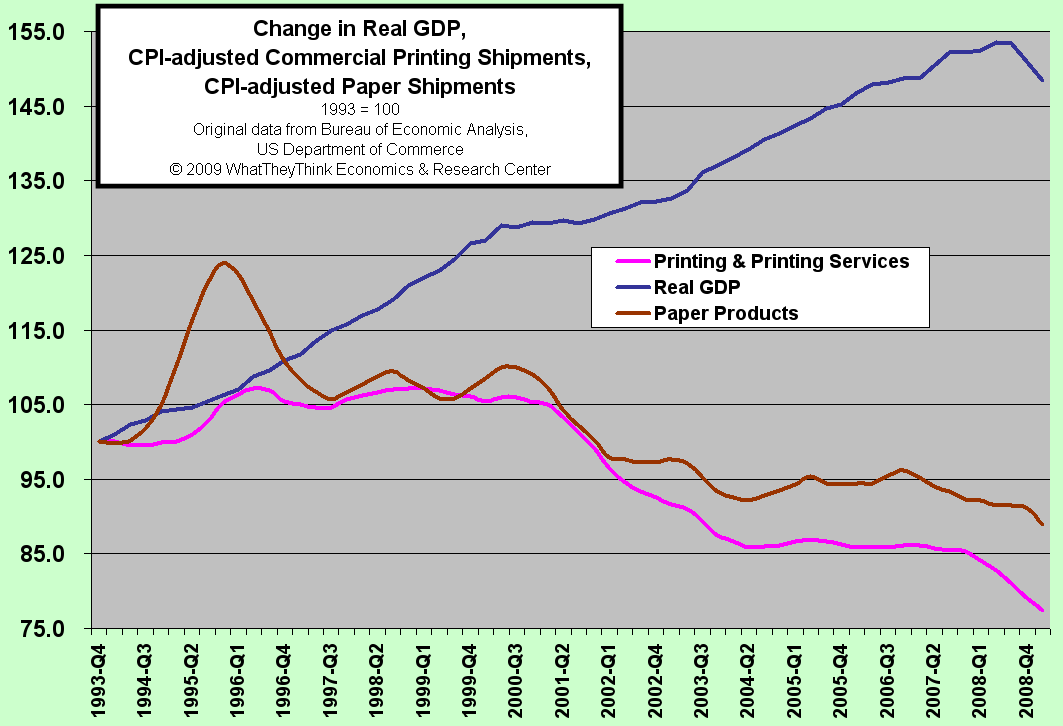
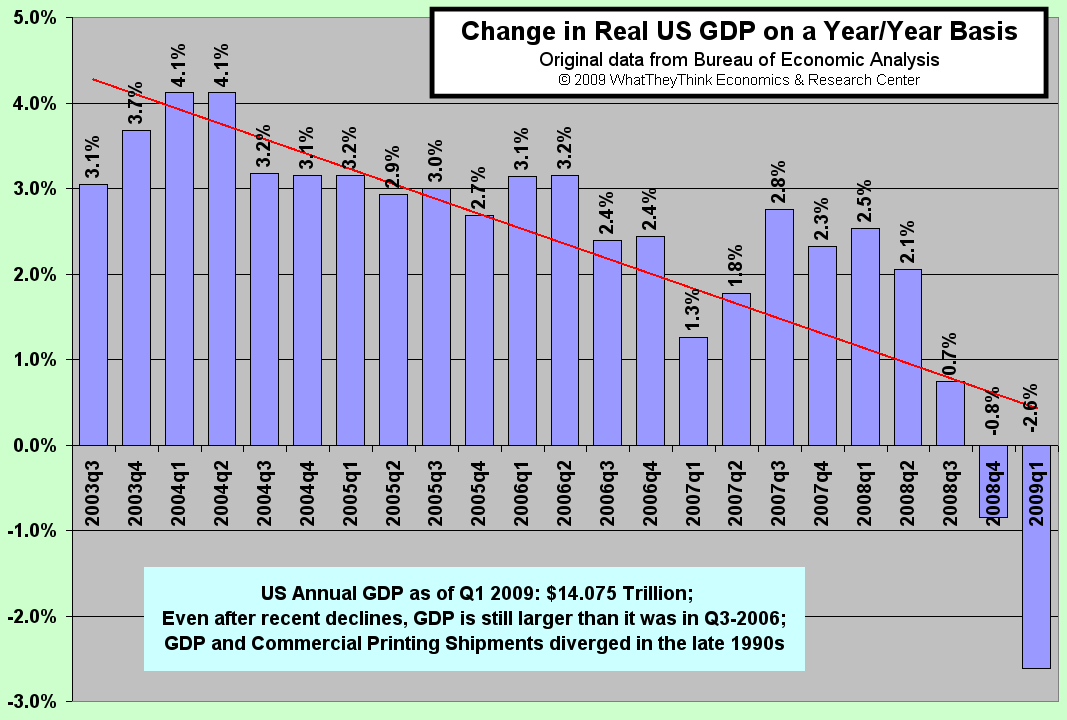
Change in Real GDP, CPI-adjusted Print Shipments & Paper Shipments
Published: June 1, 2009
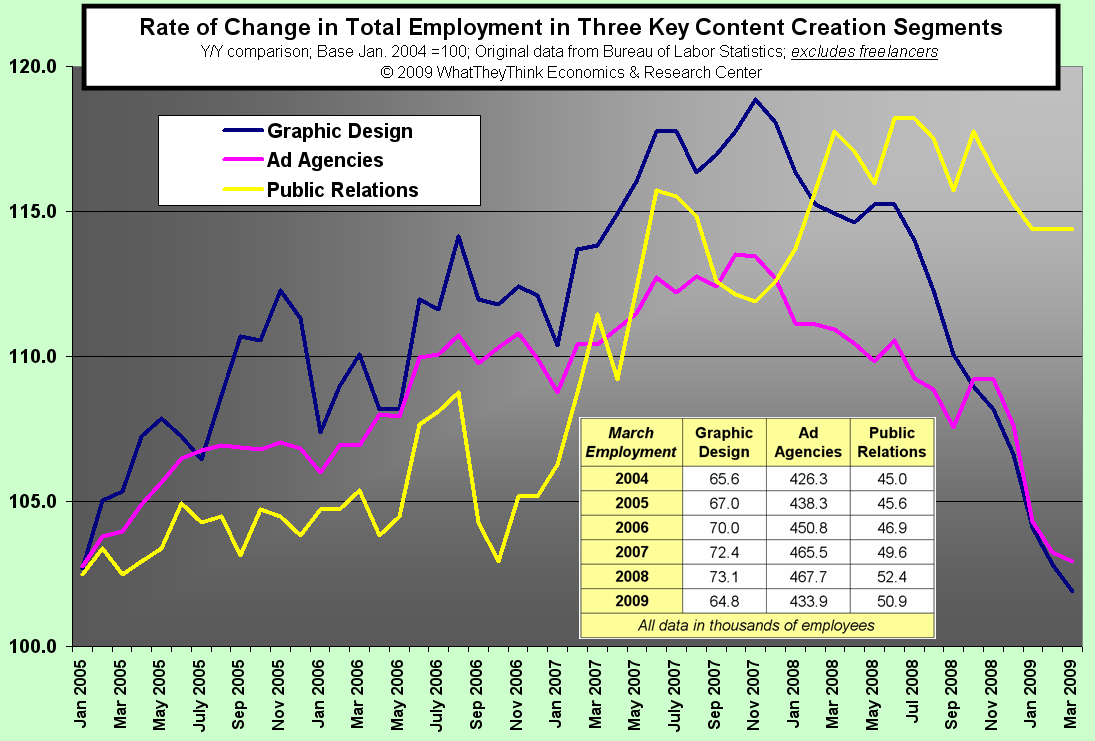
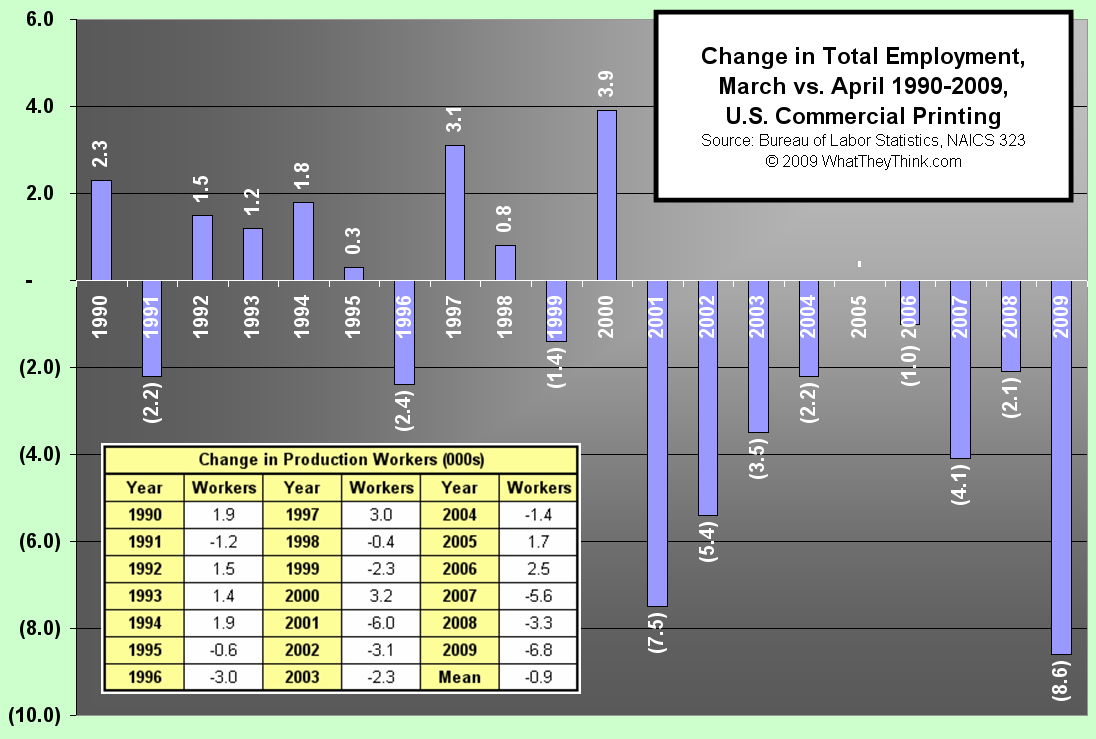
Change in Total Employment, March vs. April 1990-2009, US Commercial Printing
Published: May 18, 2009
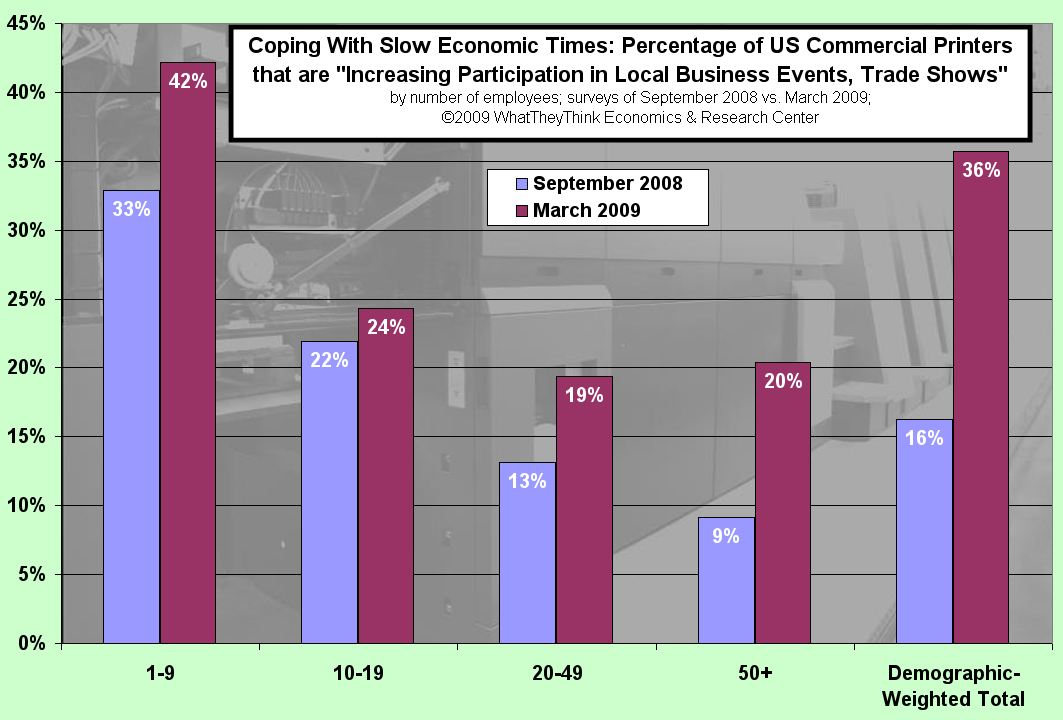
Percentage of Printers Increasing Participation in Local Business Events, Trade Shows
Published: April 27, 2009
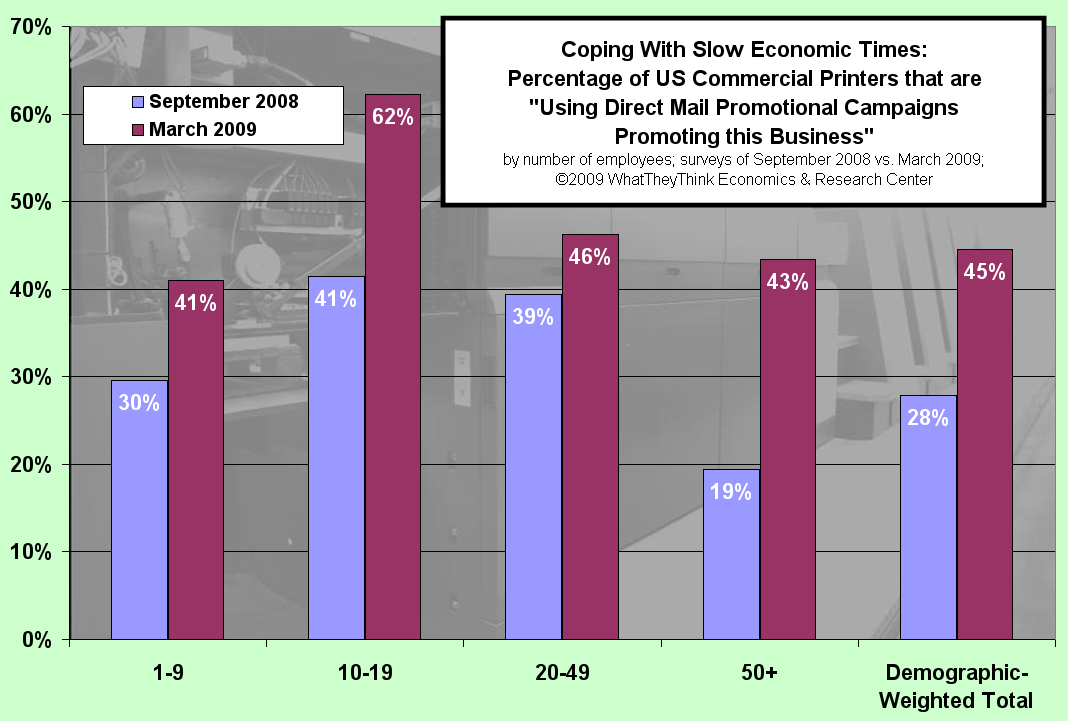
Percentage of Printers Using Direct Mail Promotional Campaigns to Promote Business
Published: April 20, 2009
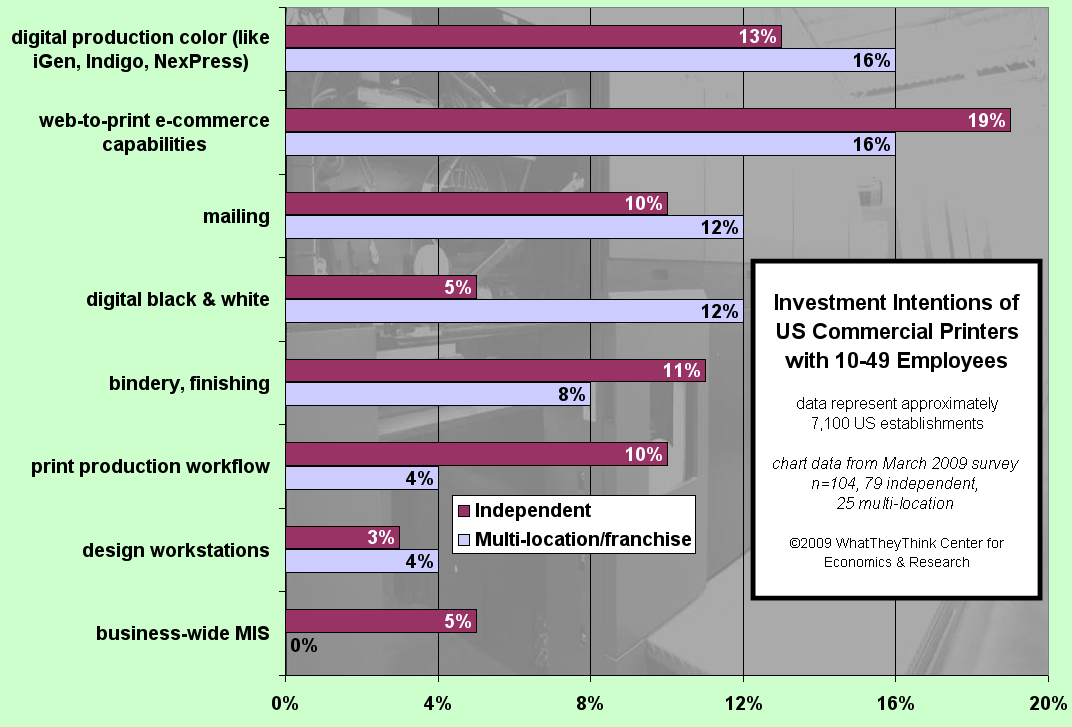
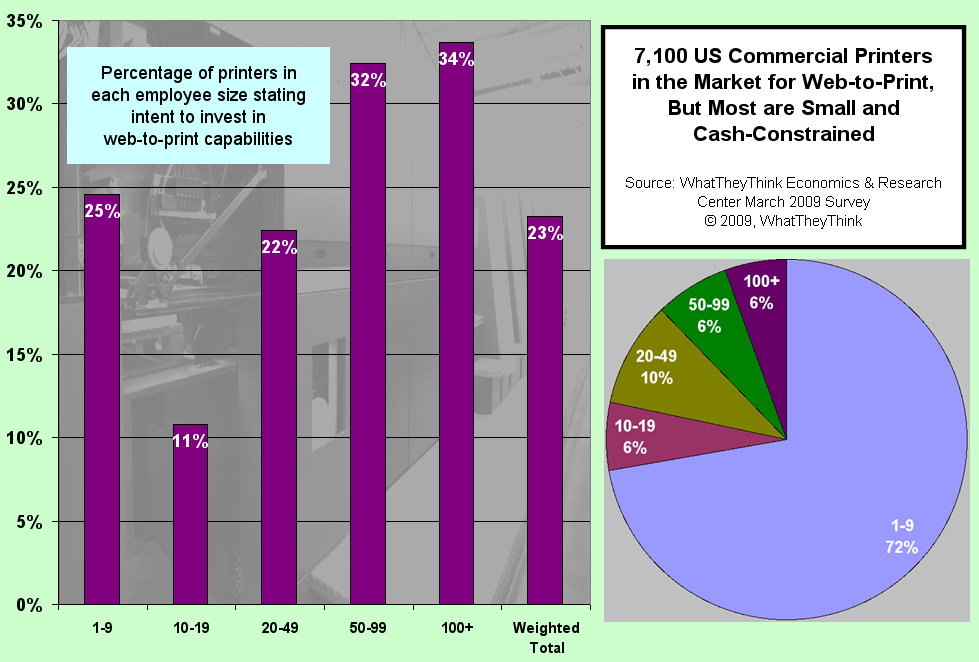
Investment Intentions of Commercial Printers with 10-49 Employees
Published: April 13, 2009
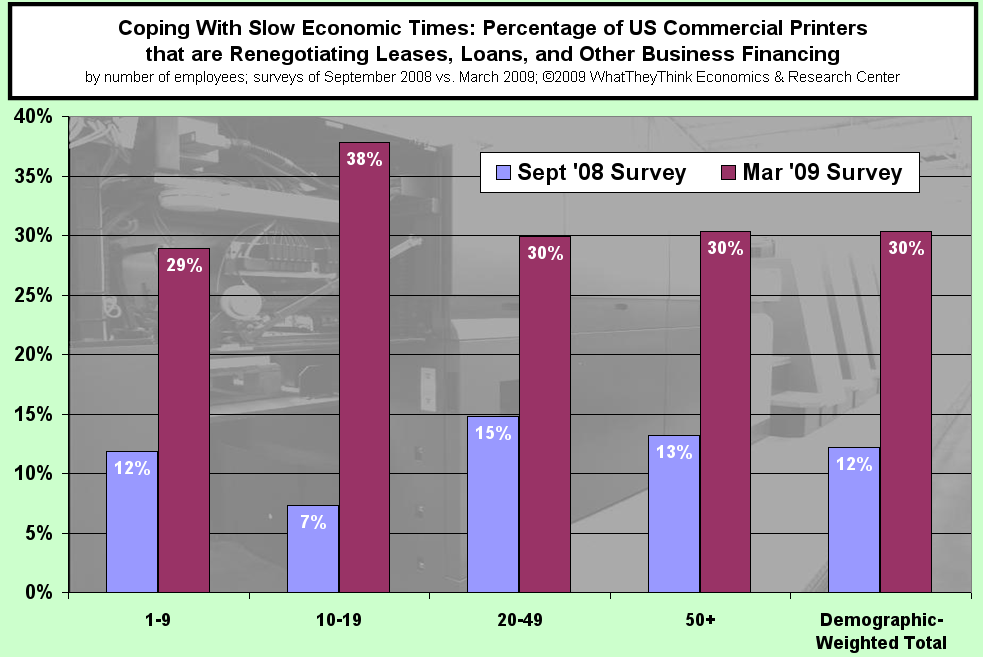
Percentage of US Commercial Printers Renegotiating Leases, Loans and other Financing
Published: March 30, 2009
This is the Last Page
- Questions to ask about inkjet for corrugated packaging
- Can Chinese OEMs challenge Western manufacturers?
- The #1 Question When Selling Inkjet
- Integrator perspective on Konica Minolta printheads
- Surfing the Waves of Inkjet
- Kyocera Nixka talks inkjet integration trends
- B2B Customer Tours
- Keeping Inkjet Tickled Pink
© 2024 WhatTheyThink. All Rights Reserved.


