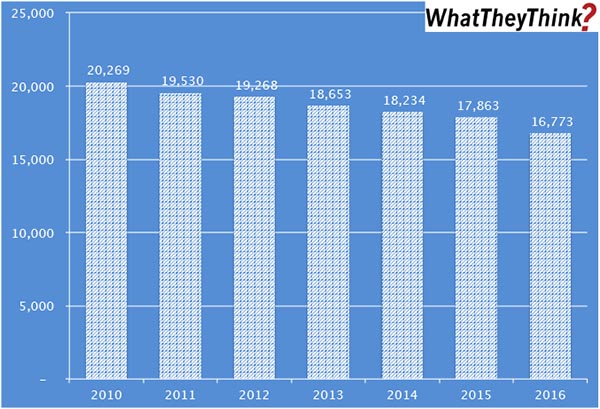
In 2010, there were more than 20,000 1–9-employee U.S. printing establishments; by 2016, they had declined -17%. This is a little bit higher than overall establishment declines we had seen in this period, representing a bit more “volatility” at the smaller end of the establishment spectrum.
The data in this chart is gleaned from our new Commercial Printing Establishments tracker, which complements and supplements our regular tracking of printing industry shipments and other industry data. Based on data from the Census Bureau’s County Business Patterns, we present—in spreadsheet form—U.S. commercial printing establishments from 2010 to 2016, including establishment counts for six commercial printing business classifications (based on NAICS, the North American Industrial Classification System):
- 323 (Printing and Related Support Activities)
- 32311 (Printing)
- 323111 (Commercial Printing, except Screen and Books)
- 323113 (Commercial Screen Printing)
- 323117 (Books Printing)
- 32312 (Support Activities for Printing—aka prepress and postpress services)
We further break these counts down by establishment size:
- 1–4 employees
- 5–9 employees
- 10–19 employees
- 20–49 employees
- 50–99 employees
- 100–249 employees
- 250–499 employees
- 500–999 employees
- 1000 employees
These data, and the overarching year-to-year trends, like other demographic data, can be used not only for business planning and forecasting, but also sales and marketing resource allocation.
Every other week, we will be breaking these establishment data down in different ways. Over time, we will be adding additional data from the County Business Patterns, such as number of employees, payroll, and similar information for additional business classification of relevance to the graphic communications industry.


