The latest edition of County Business Patterns was recently released, which includes 2020 data. (CBP 2020 data reflects the number of establishments as of March—so these counts are pre-COVID.)
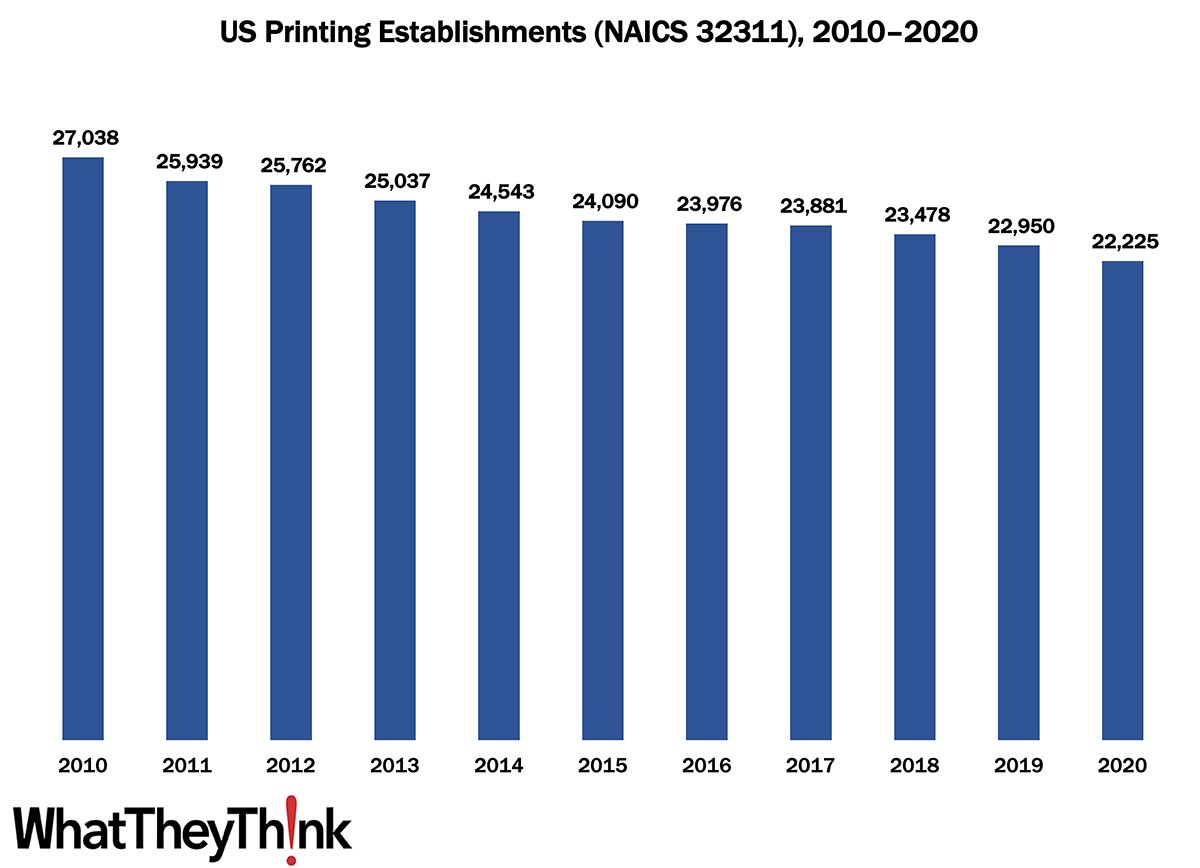
As 2020 began, there were 22,225 establishments in NAICS 32311 (Printing). This represents a decline of 18% since 2010. The biggest declines were in the early years of the decade, thanks to the Great Recession—from 2010 to 2011, establishments declined by 4%; from 2014 to 2015, the decline was only 2%. Consolidation picked up toward the end of the decade, with establishments declining 5% from 2018 to 2020.
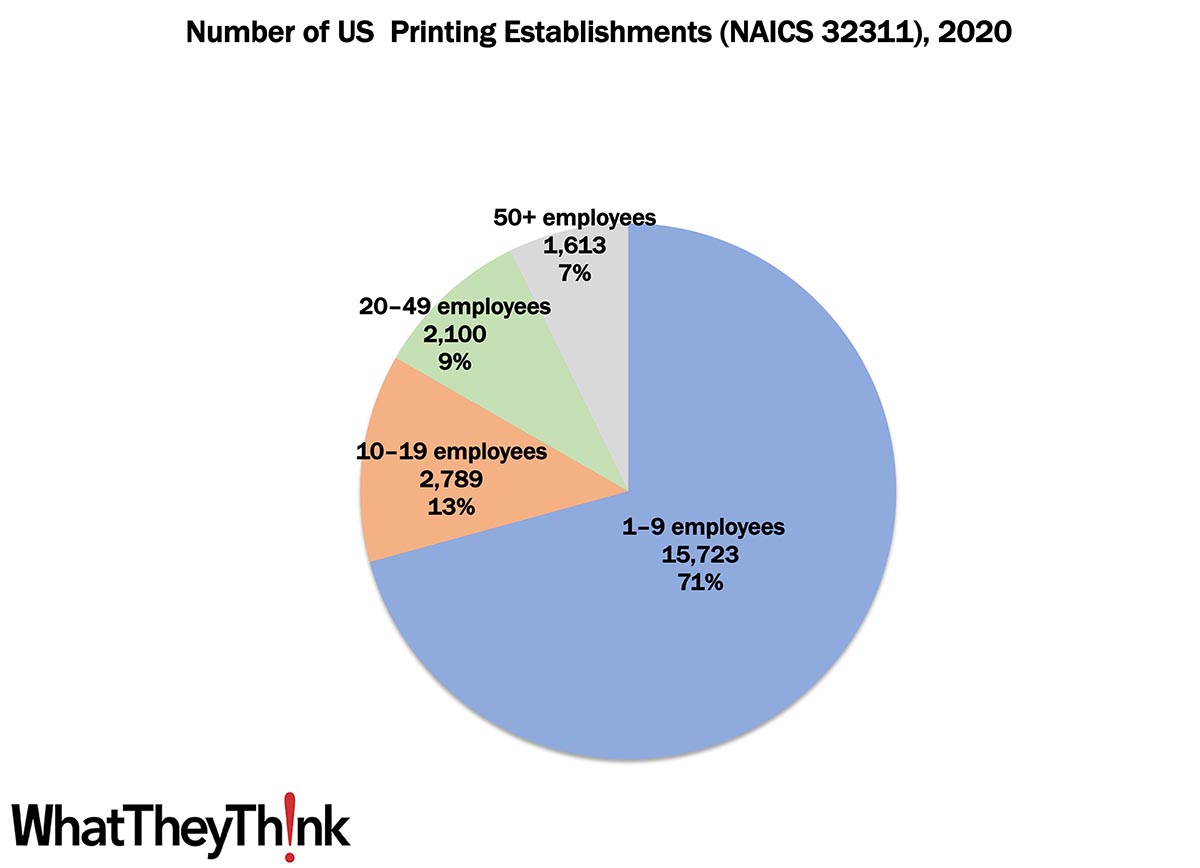
Small shops (1 to 9 employees) still comprise the bulk of the industry, accounting for 71% of all establishments. The largest shops account for only 7% of industry establishments with mid-size shops accounting for about one-fourth of establishments. These percentages have not varied substantially since at least as far back as 2010.
These counts are based on data from the Census Bureau’s County Business Patterns. Throughout this year, we will be updating these data series with the latest CBP figures. County Business Patterns includes other data, such as number of employees, payroll, etc. These counts are broken down by commercial printing business classification (based on NAICS, the North American Industrial Classification System):
- 323111 (Commercial Printing, except Screen and Books)
- 323113 (Commercial Screen Printing)
- 323117 (Books Printing)
- 32312 (Support Activities for Printing—aka prepress and postpress services)
These data, and the overarching year-to-year trends, like other demographic data, can be used not only for business planning and forecasting, but also sales and marketing resource allocation.
This Macro Moment…
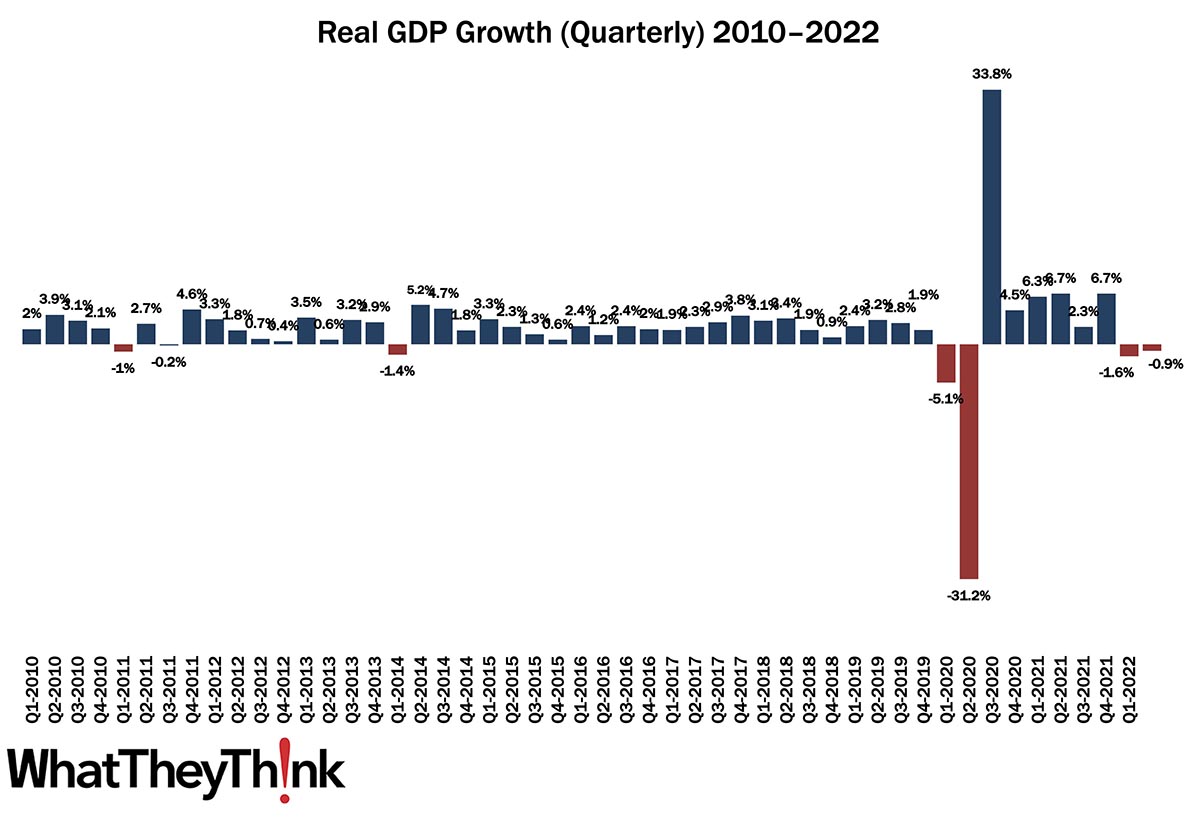
The Bureau of Economic Analysis (BEA) released its advance estimate of Q2 2022 GDP yesterday. Ruh roh:
Real gross domestic product (GDP) decreased at an annual rate of 0.9 percent in the second quarter of 2022 (table 1), according to the "advance" estimate released by the Bureau of Economic Analysis. In the first quarter, real GDP decreased 1.6 percent.
Q1 was revised from -1.4% to -1.6%.
The decrease in real GDP reflected decreases in private inventory investment, residential fixed investment, federal government spending, state and local government spending, and nonresidential fixed investment that were partly offset by increases in exports and personal consumption expenditures (PCE). Imports, which are a subtraction in the calculation of GDP, increased
So, the $24.9 trillion question is, does this indicate that we are in, or near to, a recession? Despite the Fed’s best efforts to trigger one, the consensus is that we are not, as other economic indicators, such as employment and consumer spending (up 1.0% annualized rate) are both pretty positive, with inflation being the predominant problem (yes, there are others, but inflation is the biggie). According to Calculated Risk, “residential investment as a percent of GDP is useful in predicting a Fed induced recession. RI as a percent of GDP usually turns down well in advance of a recession. This will be something to watch.” In Q2, RI decreased at a 14.0% annual rate, while it had been by about the same amount in Q1. So, as they say, this is a data point to watch.