During the 1999 TrendWatch breakfast event at Graph Expo, I took a lot of heat for saying, "We will call 1998 'the good old days.'" When I saw April 2011's commercial printing shipments data, that's what immediately came to mind. I miss 1998. But we may start thinking about 2008 in the same way.
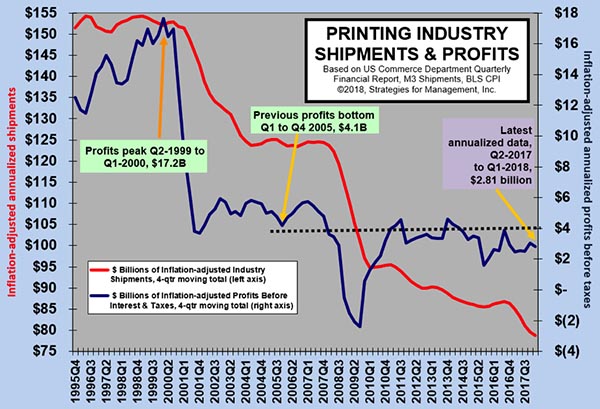
The chart below tells the story. Once you adjust for inflation, April was the worst printing month in the last 18 years, and that's only because the Department of Commerce data series we use doesn't go back any further. From 2004 through 2008, current dollar shipments were rising, and on an inflation-adjusted basis, they were at least roughly flat. Since then, however, it's been quite a different story.
For more details about April's shipments, be sure to read the press release about our monthly shipments report; WhatTheyThink premium subscribers can access the podcast and slides of our discussion, which is also available from the WhatTheyThink Marketplace.
Unfortunately, the concerns expressed in April's webinar (listen again or download slides) are coming through now. On Friday, the NASDAQ dropped below its start-of-the-recession level back in December 2007, finishing the day at 2643.73, almost twenty points below the 2661.61 level it achieved on December 31, 2007. There have been several data points (notably the Institute for Supply Management indices) released in our recovery indicators that show we are in the midst of yet another economic slowdown, or at least continued sluggishness.
One of the explanations for the NASDAQ pullback might be that the second round of "quantitative easing," referred to as "QE2," is coming to an end. This deliberate effort to inflate stock prices and create consumer confidence in the value of their savings, flooding the market with dollars by buying Treasury and other securities, had worked in that regard. Now that QE2 is over, stock prices would understandably retreat if those measures were the only force propping them up. But perhaps the market is forgetting that QE2 is not really stopping. Ben Bernanke has stated publicly that any of the securities that mature while the Fed is holding them will be replaced with other securities. So it's not that QE2 is really ending; it's just staying put.
Therefore, one could propose that the NASDAQ is declining because investors were only riding the rise in liquidity, and not the absolute amount of that liquidity. The rise is over, they may believe, so it's time to find something else. The old saw, "sell in May and go away," looks like it was the right advice in 2011 for many investors.
The stimulation of the money supply has created significant worries about inflation and other factors in the economy, worldwide. In past columns and in webinars, I have been asked the question about whether or not we should worry about China holding such a great amount of Treasury securities. I have always said that it was a misplaced worry, and that the folks who should be worrying are the Chinese. Well, perhaps they are now. Their holding of short-term Treasury obligations has fallen from around $45 billion in October to about $5.5 billion in March. The biggest holder of Treasury securities overall is the Federal Reserve, but China still holds about $1 trillion overall in Treasury securities of other durations.
One of the reasons China holds US securities is to purchase commodities, since the greenback is a worldwide currency for such transactions. No matter how much we beat up the U.S., dollar, it's still the most accepted, most easily exchangeable currency. If this were not the case, it would be falling further: the Euro, for example, has its own problems. The debts and economies of Greece, Portugal, Spain, Italy, and Ireland are all playing into concerns about the value and future of the Euro. Otherwise, the Euro might be in prime position to displace the dollar in a more significant way. Instead, it seems that the world's central bankers might as well be in a scheme of competitive devaluations.
The actions of the central banks are designed to prevent a deflationary downdraft that would send more mortgages and loans underwater, where the balance still owed on the loans is greater than the assets that support them. Those assets are goods that were already produced a while ago. By trying to stop housing prices from going down, money is being directed to activities that do not create new goods or raise incomes. The best way to increase the value of these assets is to create the economic activities that increase incomes. Instead, business and personal investment is undermined because of the certainty, not the uncertainty, that these activities will not be worthwhile. This is why there has been such great interest in the price of gold, which should be an embarrassment to central bankers. Gold produces nothing; it pays no dividend. The interest in it is almost solely because of inflation fears and the undermining of the value of savings and investments, and especially those investments will not have immediate payoffs.
The certainty of the situation is as follows. If you have an investment in a plant that will take five years to be cash positive, the combination of taxes and inflation can raise the bar for taking that risk, so much so that it becomes unwise. For example, assume that an entrepreneur wants to invest $1 million today, in a plant that will produce a net post-tax amount of $100,000 in its first profitable year five years from now, and then $100,000 every year thereafter. (The numbers presented are very rough and not exact for ease of readability.) At 5% inflation per year, to yield the equivalent of $100,000 in today's dollars, the has to produce $125,000 in Year Five. Assume that the total tax rate between Federal and state is 50% (40% Federal, 10% state). So now you need $250,000 to net out at $100,000 in today's dollars. In essence, that $1 million investment has to start returning 25% five years from now to provide $100,000 in today's dollars. Unless it's really compelling, and has a chance of greater returns, it will not get funded.
What if the inflation rate is 2% and the total personal tax is 30% (25% Federal, 5% state)? That would be a $110,000 return, and about $155,000 total to provide $100,000 in today's dollars. The bar is considerably lower in the mind of the entrepreneur. It is these basic (oversimplified in this case) net present value calculations that are resulting in this economic sluggishness. The $155,000 payback is easier to achieve than a $250,000 one. There are many reasons why corporations are holding onto cash, and this simple analysis may explain a lot of it.
Add in the costs of borrowing, and it gets worse, even when rates are low. Why would banks lend when they know the rates that they will charge cannot overcome the risks of future inflation, even when the Fed will give them money so cheaply? They'd rather play short-term arbitrage and carry trades that seem to have less business risk than funding business investment projects that will not have returns for years out unless they are with the best capitalized and clients with the most proven track records.
For the Fed, the question is whether they will be able to unwind QE2 in a manageable way. I believe that there will be no serious rewinding, and that the Fed will just allow its holdings to mature, and not replace them. I also believe that there will be a QE3, whether or not it is referred to in that way. The fact that they will keep pumping liquidity into the markets out of fear of asset-price declines will only continue the concerns about inflation and distort the assessments of future business investment risks.
Because expansionary investments have unacceptable risk profiles, keep looking for the continuing focus on business efficiency, usually found in streamlining processes and reducing overall employee headcounts, as well as mergers and acquisitions with those same aims. Those are not the optimal long-term uses of capital, but business owners are acting in a way that these options are their best, if not their only, choices.
Continue reading your article
with a WhatTheyThink membership.