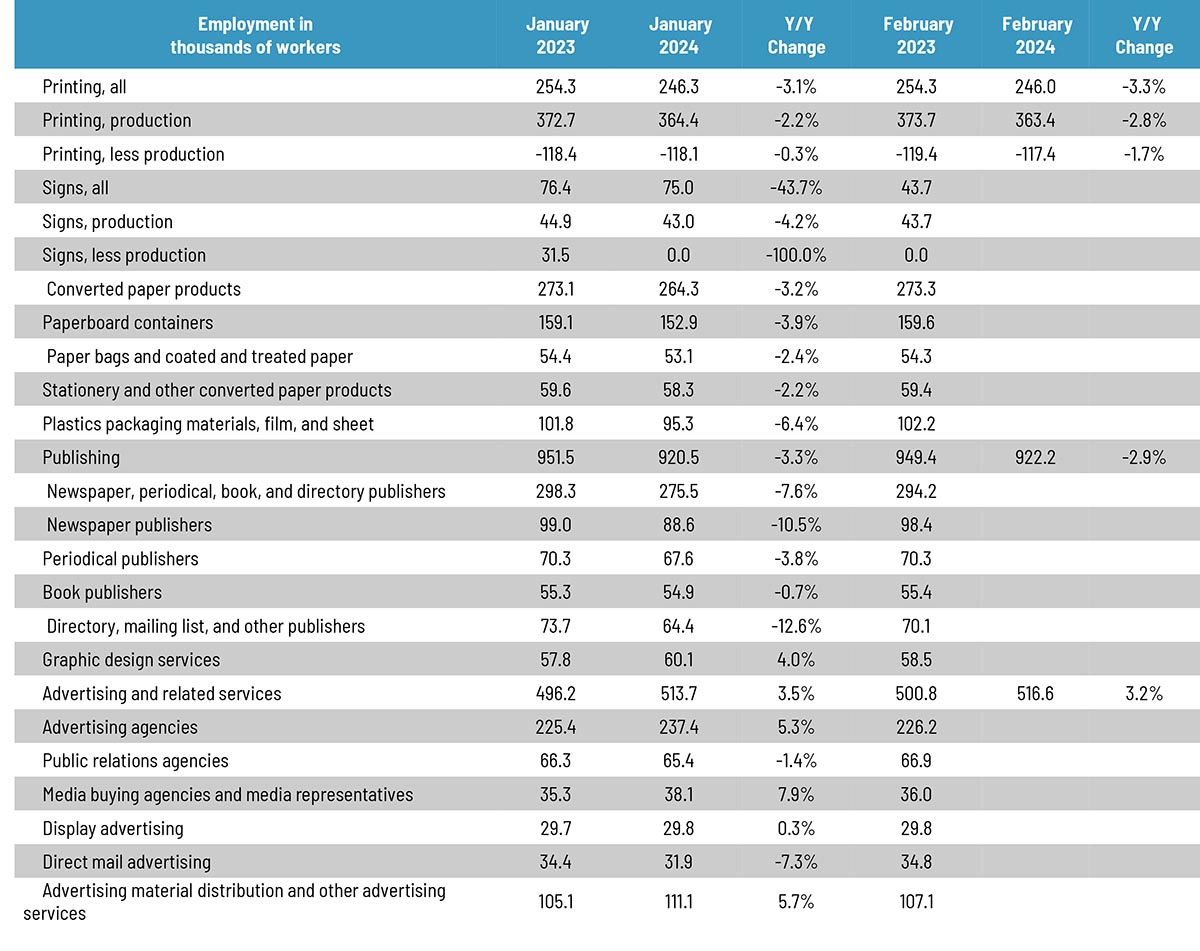
The printing employment situation had been pretty flat throughout last summer, had started picking up in the fall, but has remained on the whole flat over the course of the winter. Overall printing employment in February 2024 was little changed from January, with production employment down -1.0%, while non-production employment was down -0.6%, with net employment down -0.1%.
In terms of publishing, overall publishing employment was up 0.3% from January to February, while advertising and related services was up 0.6%.
Last year, we started adding a number of other business categories to our employment table, the reporting of which, as you may recall from our tracking of the publishing and creative markets, lags a month.
Overall employment in the signage industry was down -0.1% from December to January, with sign production employment down -0.7% and non-production up -0.6%.
Converted paper products employment was down -1.5% from December to January, with paperboard container employment down -1.7% and paper bags and coated and treated paper employment down -0.4%.
Looking at some specific publishing and creative segments, from December to January, periodical publishing employment was down -1.3%, while newspaper publishing employment was down -1.3%, and book publishing was unchanged. Graphic design employment was down -1.5% from December to January, ad agency employment was down -0.9%, and PR agencies were down -1.7%. Direct mail advertising employment was down -2.7%.
So newspapers and direct mail saw the biggest declines in employment as we entered the new year.
As for February employment in general, the BLS reported on March 8 that total nonfarm payroll employment increased by 275,000 in February, and the unemployment rate ticked up to 3.9%. Job gains occurred in health care, government, food services and drinking places—we’ll drink to that—social assistance, and transportation and warehousing.
Meanwhile, The change in total nonfarm payroll employment for December was revised down by 43,000 (from +333,000 to +290,000) and for January was revised down by 124,000 (from +353,000 to +229,000). Ergo, employment in November and December combined was 126,000 higher than previously reported.
The U-6 rate (the so-called “real” unemployment rate which includes not just those currently unemployed but also those who are underemployed, marginally attached to the workforce, and have given up looking for work) ticked up from 7.2% to 7.3%.
The labor force participation rate has been unchanged at 62.5% for the past two months and the employment-to-population ratio ticked down from 60.2% to 60.1%. The labor force participation rate for 24–54-year-olds ticked up from 83.3% to 83.5%.
This employment report was above economists’ expectations, and was a pretty good report, despite the downward revisions to December and January.


