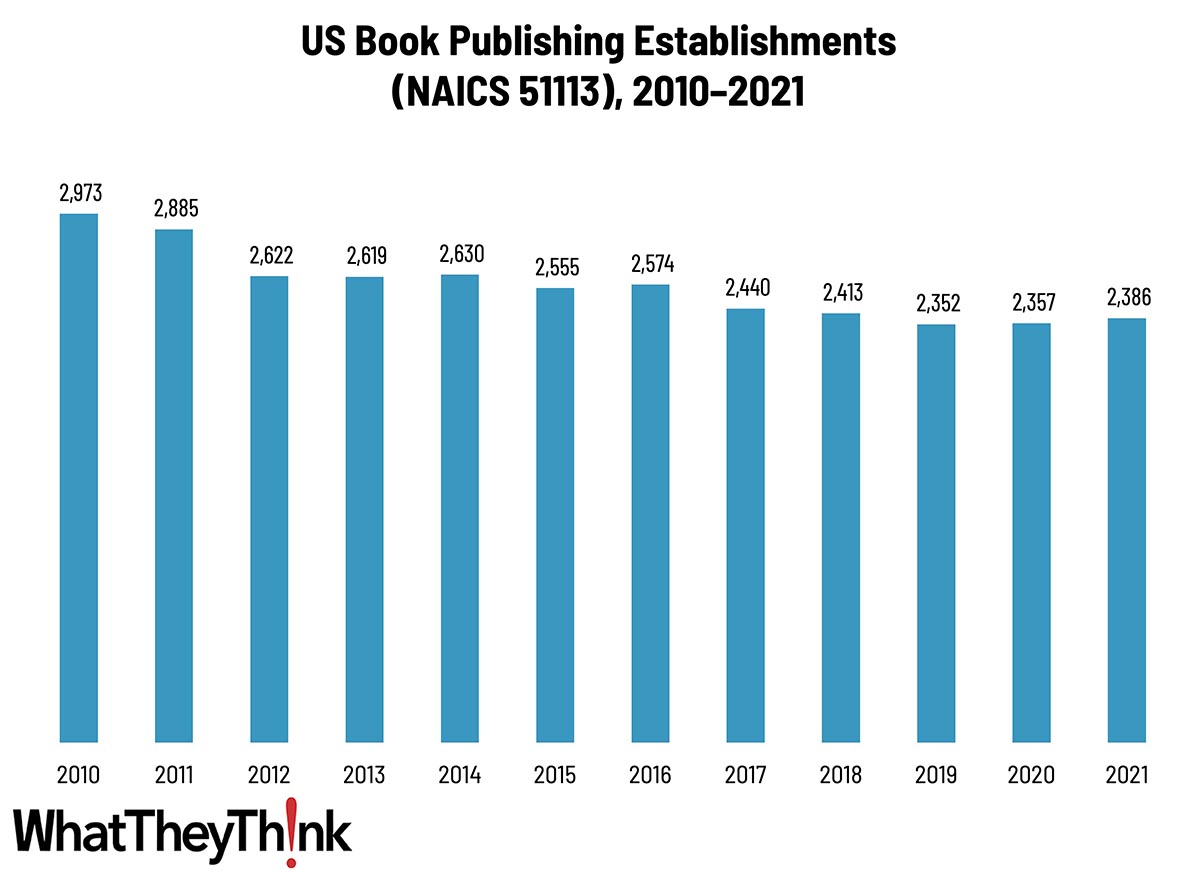
Our Friday data slice’n’dice look at the latest edition of County Business Patterns has been detailing the publishing industries. As 2021 began, there were 2,386 establishments in NAICS 51113 (Book Publishing), a decrease of 20% since 2010, but a slight increase from 2020.
The Bureau of the Census definition for this business classification:
This industry comprises establishments known as book publishers. Establishments in this industry carry out design, editing, and marketing activities necessary for producing and distributing books. These establishments may publish books in print, electronic, or audio form.
We’ll look at Non-Employer Statistics* at another time, but it’s worth noting that at least as recently as 2016 there were an estimated 7,977 small or self-publishers in this category. Technology enablers such as electronic publishing, on-demand book production, and e-commerce through companies like Amazon (Createspace) have led to a growing specialty publishing market. When you factor in the ease of creating and publishing ebooks (which are often given away or sold for only a token amount as more of a self/business promotion strategy or tie-in to a speaking gig), some, perhaps many, “book publishers” may not classify themselves as such.
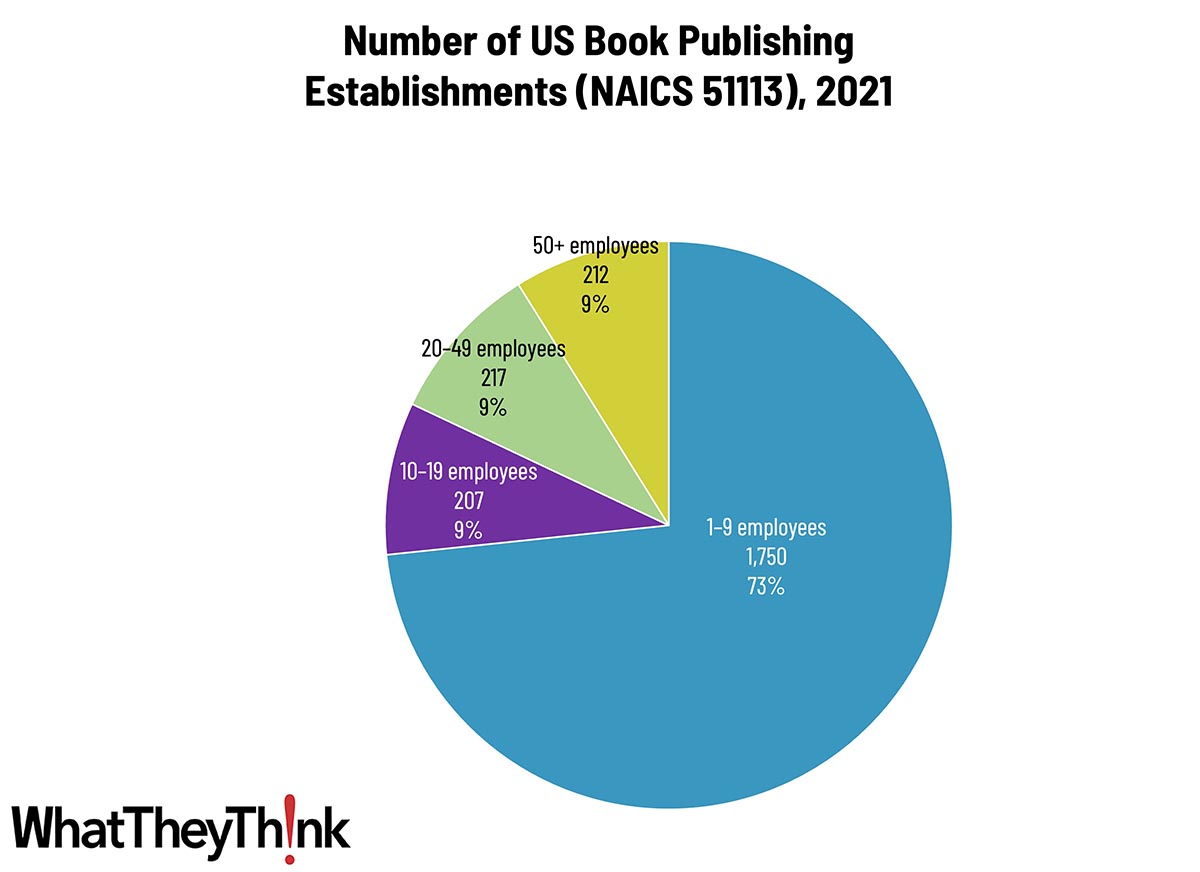
Book publishing establishments are concentrated at the lower end of the employee-count spectrum. Small publishers (1 to 9 employees) comprise the bulk of the establishments, accounting for 73% of all establishments, with the other three size classifications just about equal.
These counts are based on data from the Census Bureau’s County Business Patterns. Throughout this year, we will be updating these data series with the latest CBP figures. County Business Patterns includes other data, such as number of employees, payroll, etc. These counts are broken down by commercial printing business classification (based on NAICS, the North American Industrial Classification System). Up next:
- 51114 Directory and Mailing List Publishers
- 51119 Other Publishers
- 511191 Greeting Card Publishers
- 511199 All Other Publishers
These data, and the overarching year-to-year trends, like other demographic data, can be used not only for business planning and forecasting, but also sales and marketing resource allocation.
This Macro Moment…
Last week, the BEA released its advance estimate of fourth quarter GDP growth:
Real gross domestic product (GDP) increased at an annual rate of 3.3 percent in the fourth quarter of 2023 (table 1), according to the "advance" estimate released by the Bureau of Economic Analysis. In the third quarter, real GDP increased 4.9 percent.
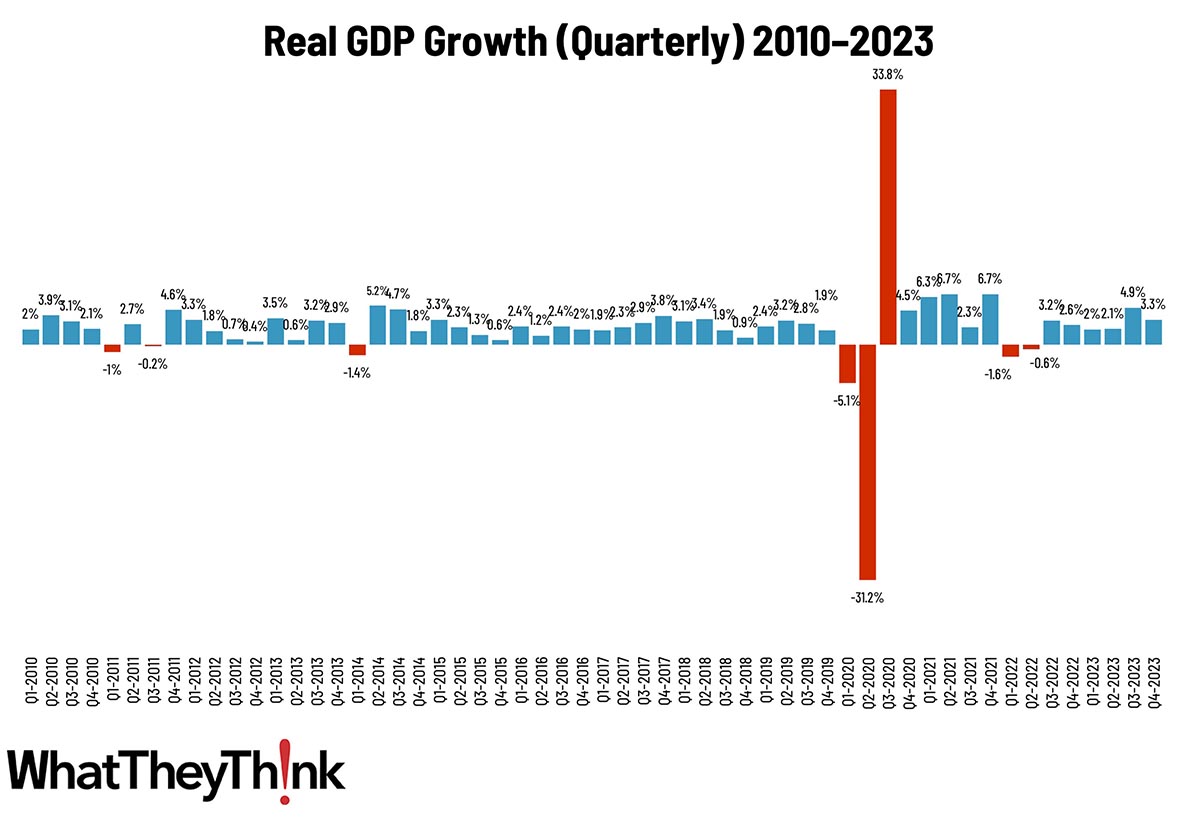
Source: Bureau of Economic Analysis
The increase in real GDP reflected increases in consumer spending, exports, state and local government spending, nonresidential fixed investment, federal government spending, private inventory investment, and residential fixed investment. Imports, which are a subtraction in the calculation of GDP, increased.
The increase in consumer spending reflected increases in both services and goods. Within services, the leading contributors were food services and accommodations as well as health care. Within goods, the leading contributors to the increase were other nondurable goods (led by pharmaceutical products) and recreational goods and vehicles (led by computer software). Within exports, both goods (led by petroleum) and services (led by financial services) increased. The increase in state and local government spending primarily reflected increases in compensation of state and local government employees and investment in structures. The increase in nonresidential fixed investment reflected increases in intellectual property products, structures, and equipment. Within federal government spending, the increase was led by nondefense spending. The increase in inventory investment was led by wholesale trade industries. Within residential fixed investment, the increase reflected an increase in new residential structures that was partly offset by a decrease in brokers' commissions. Within imports, the increase primarily reflected an increase in services (led by travel).
On an annual basis, real GDP increased 2.5% in 2023 over 2022, compared with an increase of 1.9% from 2021 to 2022.
This was a very good GDP report and was above economists’ expectations.
* “Non-Employer Statistics” is where the Census Bureau tracks freelancers, sole proprietorships, and other small businesses or individuals. For our purposes, these include graphic designers, small agencies, and small or self-publishers.


