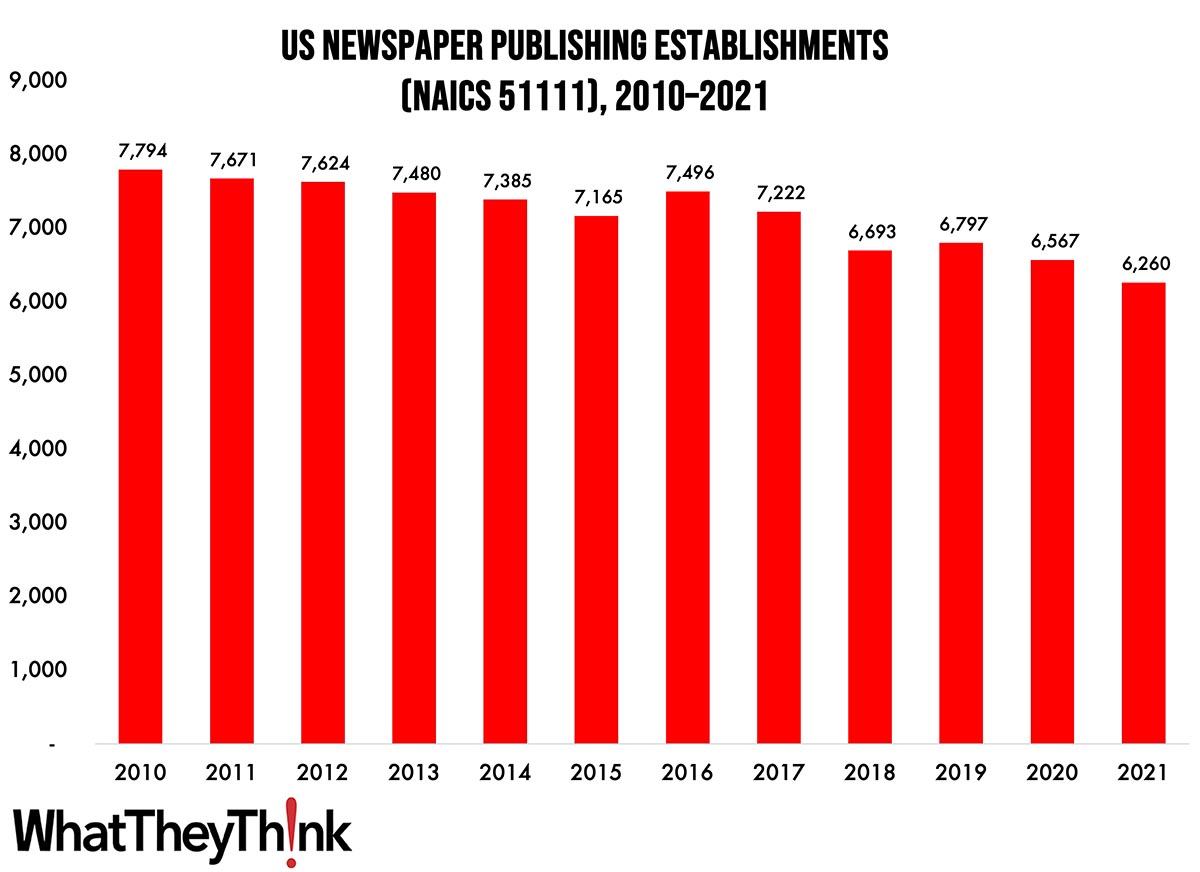
Our Friday data slice’n’dice look at the latest edition of County Business Patterns turns to the publishing industries. As 2021 began, there were 6,260 establishments in NAICS 51111 (Newspaper Publishers). This represents a decrease of 20% since 2010—and a decrease of 5% since the start of the pandemic.
The U.S. Census Bureau officially designates NAICS 51111 as:
This industry comprises establishments known as newspaper publishers. Establishments in this industry carry out operations necessary for producing and distributing newspapers, including gathering news; writing news columns, feature stories, and editorials; and selling and preparing advertisements. These establishments may publish newspapers in print or electronic form.
It’s tempting to blame the Internet (or the pandemic) on the decline of newspaper circulation, but that really only hastened a trend that started with the advent of television (and the nightly news) and then kicked into high with the advent of 24-hour cable news. At the same time, there has been tremendous consolidation among newspaper publishers, with one company owning many local papers, and even centralizing editorial and production facilities. The hardest hit have been small, local papers, which has serious consequences for local journalism.
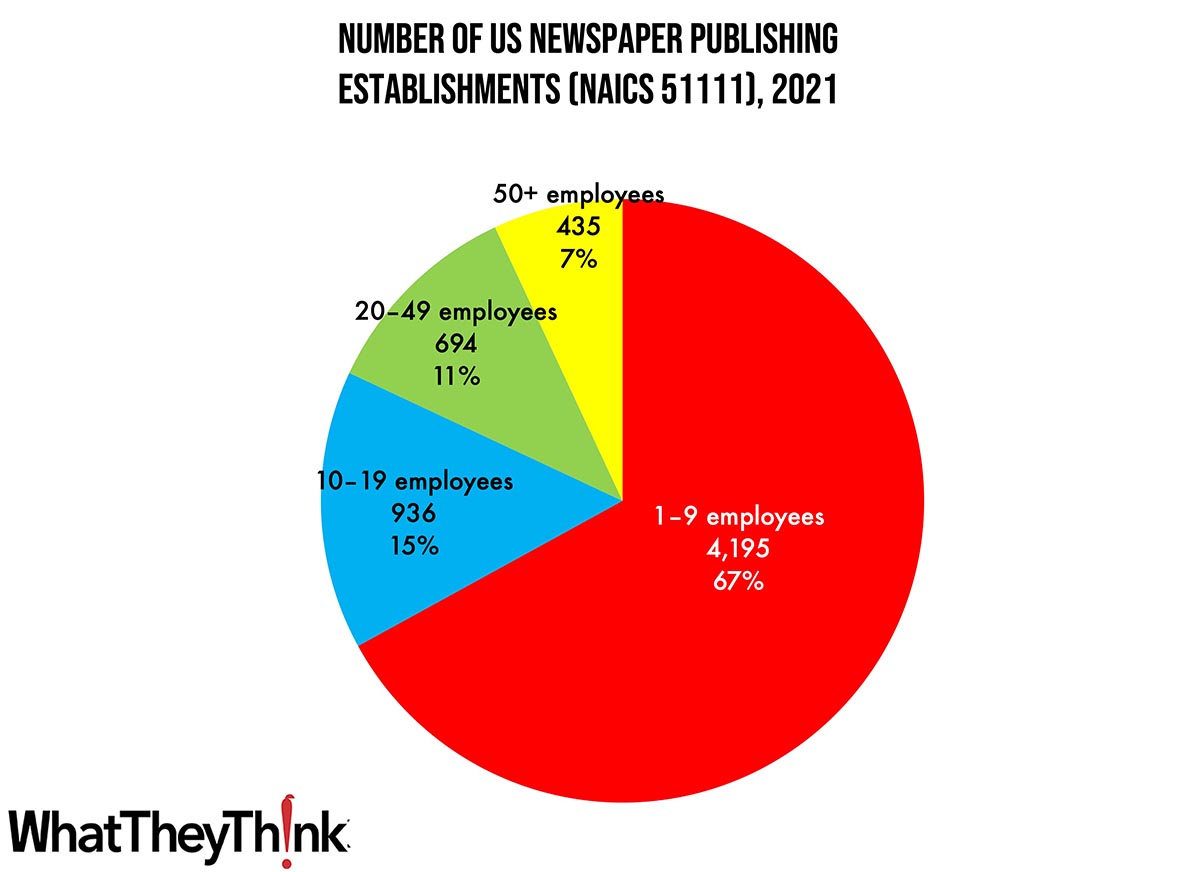
As we saw in the printing categories, publishing establishments are concentrated at the lower end of the employee-count spectrum. Small publishers (1 to 9 employees) comprise the bulk of the establishments, accounting for 67% of all establishments, with large publishers accounting for 7% and mid-size newspaper publishers accounting for 26%.
These counts are based on data from the Census Bureau’s County Business Patterns. Throughout this year, we will be updating these data series with the latest CBP figures. County Business Patterns includes other data, such as number of employees, payroll, etc. These counts are broken down by commercial printing business classification (based on NAICS, the North American Industrial Classification System). Up next:
- 51112 Periodical Publishers
- 51113 Book Publishers
- 51114 Directory and Mailing List Publishers
- 51119 Other Publishers
- 511191 Greeting Card Publishers
- 511199 All Other Publishers
These data, and the overarching year-to-year trends, like other demographic data, can be used not only for business planning and forecasting, but also sales and marketing resource allocation.
This Macro Moment…
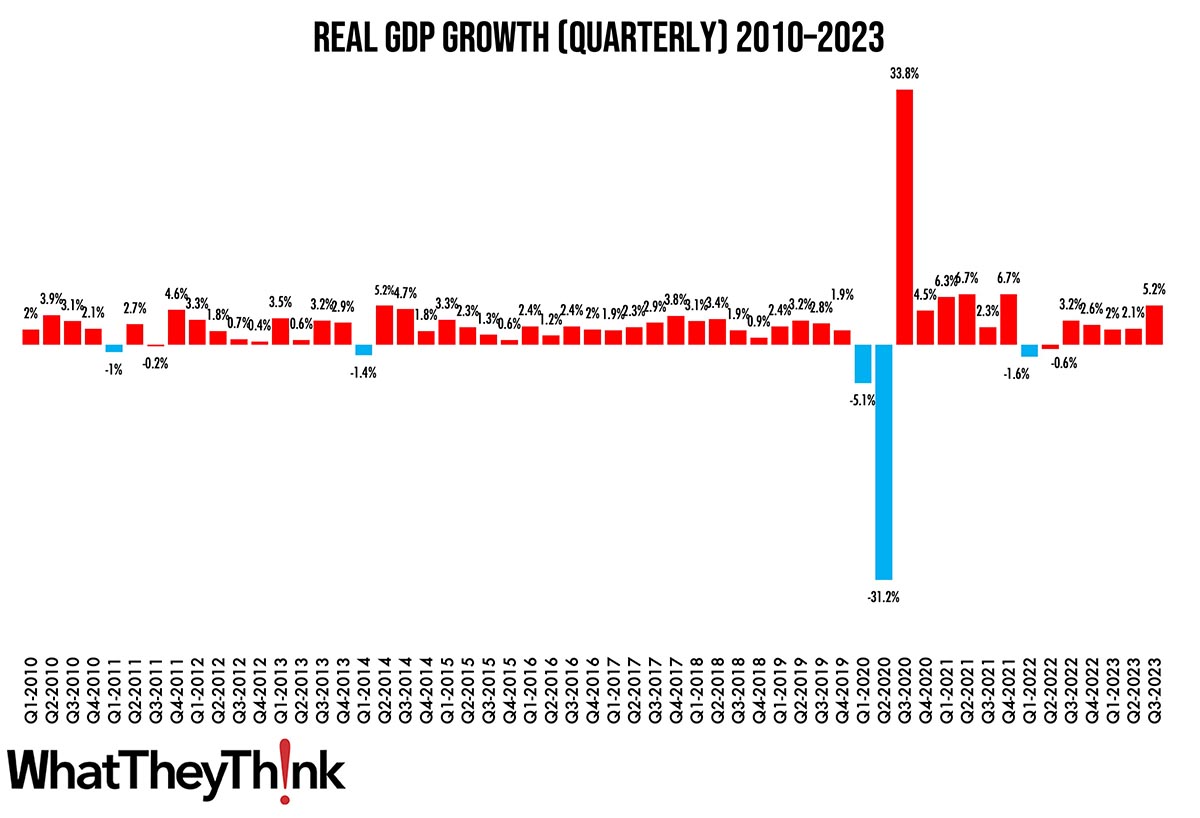
Last week, the BEA revised its estimate of third quarter GDP growth and—whoa, nelly—it was revised up to 5.2%.
Real gross domestic product (GDP) increased at an annual rate of 5.2 percent in the third quarter of 2023 (table 1), according to the "second" estimate released by the Bureau of Economic Analysis. In the second quarter, real GDP increased 2.1 percent.
The GDP estimate released today is based on more complete source data than were available for the "advance" estimate issued last month. In the advance estimate, the increase in real GDP was 4.9 percent. The update primarily reflected upward revisions to nonresidential fixed investment and state and local government spending that were partly offset by a downward revision to consumer spending. Imports, which are a subtraction in the calculation of GDP, were revised down.
Source: Bureau of Economic Analysis
Granted, we’re not ones to jump on the “OMG, the economy is doing so terribly!” bandwagon (by most metrics, it is not), but obviously Q3 is going to be an outlier. Indeed, Calculated Risk rounds up the most recent estimates of Q4 GDP growth, and most econ-watchers don’t expect that level of growth to last:
- Bank of America: +1.0%
- Goldman: +1.5%
- Altanta Fed GDPNow: +1.2%
Think of it as a “reversion to the mean,” as they say in statistics.


