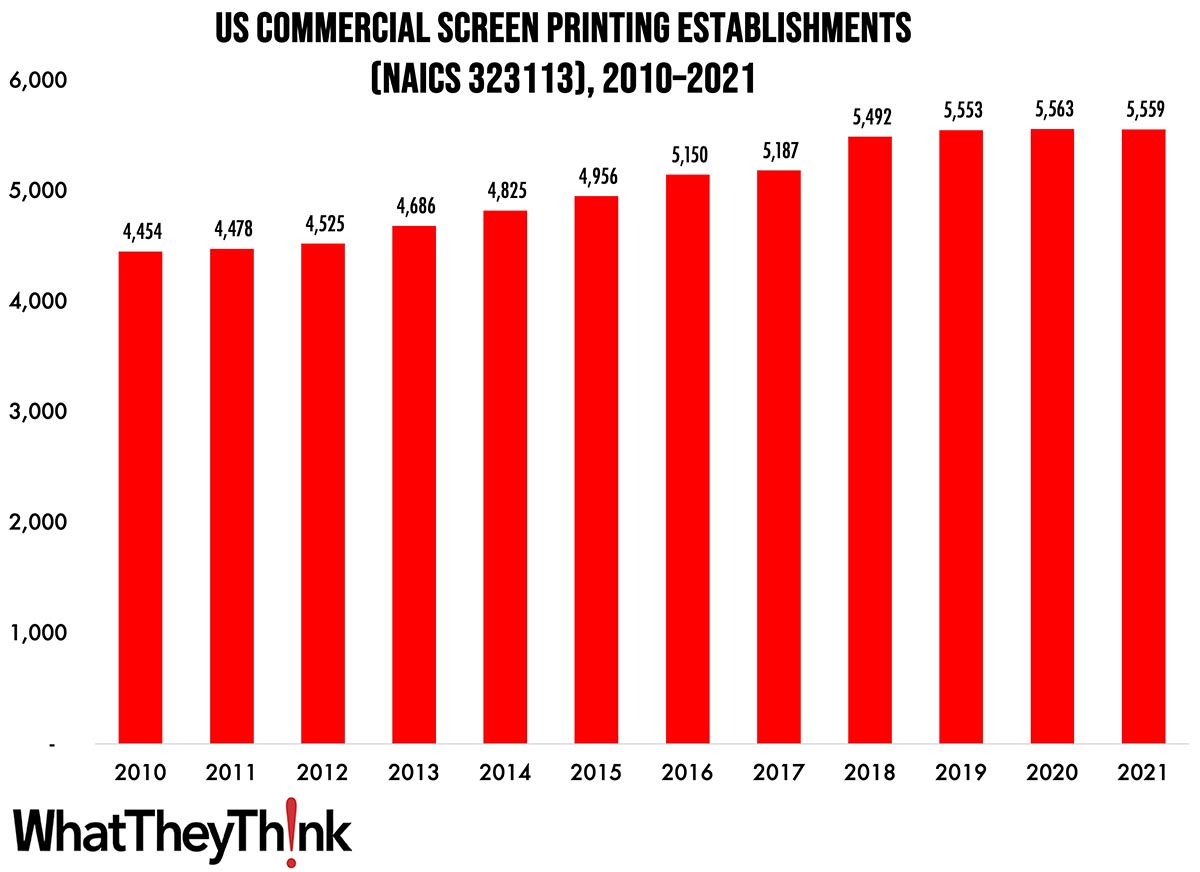
The latest edition of County Business Patterns was recently released, which includes 2021 data—meaning it reflects the businesses that were lost due to COVID.
As 2021 began, there were 5,559 establishments in NAICS 323113 (Commercial Screen Printing). This represents an increase of 25% since 2010, the only commercial printing category that has seen a steady (or any) growth in establishments, although there was a slight decrease (-0.1%) from 2020 to 2021. The growth in this category is thanks to the rise of specialty printing. Screen is commonly used to print on textiles (T-shirts being the emblematic example), and these kinds of promotional items really started to take off in the past decade. Couple this with the rise of short-run and digital technologies that can complement screen, and as demand for specialty items has increased, establishments have grown to take advantage of this hot print application area. It’s very common to find hybrid screen/digital shops, and even hybrid screen/digital workflows for the same products—kind of like the “digital printing on offset shells” approach that used to be very popular (and still exists to a large extent) among commercial printers. And let’s also not forget the growth of industrial printing, in which screen and pad printing also play a very large role.
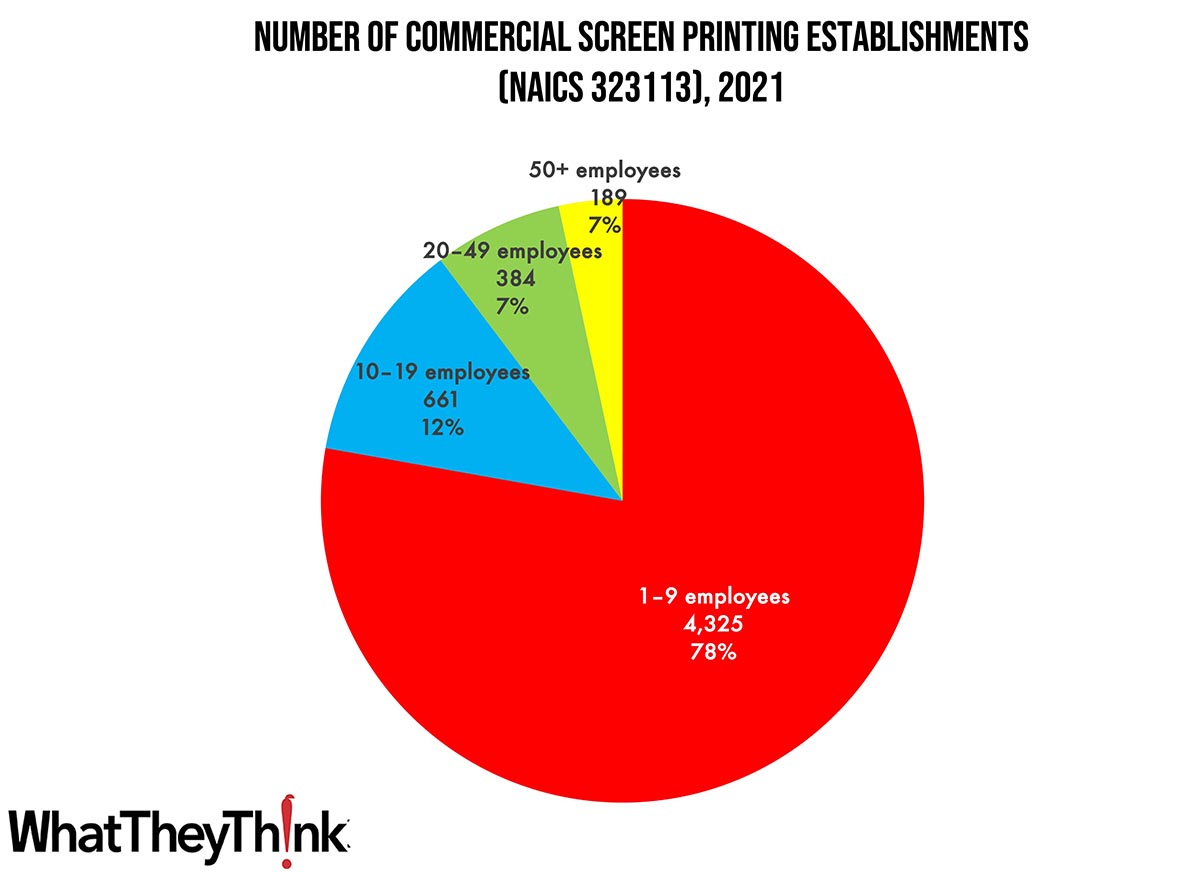
Small shops (1 to 9 employees) still comprise the bulk of the screen printing industry, accounting for 78% of all establishments. The largest shops account for only 7% of industry establishments with mid-size shops accounting for about one-fifth of establishments. These percentages have not varied substantially since at least as far back as 2010.
These counts are based on data from the Census Bureau’s County Business Patterns. Throughout this year, we will be updating these data series with the latest CBP figures. County Business Patterns includes other data, such as number of employees, payroll, etc. These counts are broken down by commercial printing business classification (based on NAICS, the North American Industrial Classification System):
- 323117 (Books Printing)
- 32312 (Support Activities for Printing—aka prepress and postpress services)
These data, and the overarching year-to-year trends, like other demographic data, can be used not only for business planning and forecasting, but also sales and marketing resource allocation.
This Macro Moment…
The Bureau of Economic Analysis yesterday released its third estimate of Q2 GDP and while the number itself was unchanged at 2.1%, there were some changes under the hood.
Real gross domestic product (GDP) increased at an annual rate of 2.1 percent in the second quarter of 2023, according to the “third” estimate released by the Bureau of Economic Analysis. In the first quarter, real GDP increased 2.2 percent (revised).
The GDP estimate released today is based on more complete source data than were available for the "second" estimate issued last month. In the second estimate, the increase in GDP was also 2.1 percent. The update primarily reflected a downward revision to consumer spending that was partly offset by upward revisions to nonresidential fixed investment, exports, and inventory investment. Imports, which are a subtraction in the calculation of GDP, were revised down (refer to “Updates to GDP”).
The increase in real GDP reflected increases in nonresidential fixed investment, consumer spending, and state and local government spending that were partly offset by a decrease in exports. Imports decreased.
By the way, it is looking like a government shutdown is likely, and Calculated Risk rounds up some of the likely economic impacts. They cite Goldman Sachs:
We have estimated a shutdown would subtract 0.2pp from Q4 GDP growth for each week it lasts ... We expect all data releases from federal agencies to be postponed until after the government reopens, except for releases from the Federal Reserve, which does not rely on congressional funding.
We did take note of “We expect all data releases from federal agencies to be postponed”—that includes shipments and all the other industry data that we glean from the Bureau of the Census, the Bureau of Labor Statistics, and other government sources.
CR also identifies some other negative forces on Q4 GDP:
This is one of the “Four Horseman of the Q4 GDP Drag” (don’t call it an “apocalypse”, it probably won't be that bad)
1) UAW Strike
2) Likely Government Shutdown
3) Student Loan Payments Resume
4) Higher energy prices (oil up 14% YoY)
And for housing, 7.5% 30-year fixed mortgage rates.
Some things to bear in mind as we head into the fall.


