The latest edition of County Business Patterns was recently released, which includes 2021 data—meaning it reflects the businesses that were lost due to COVID.
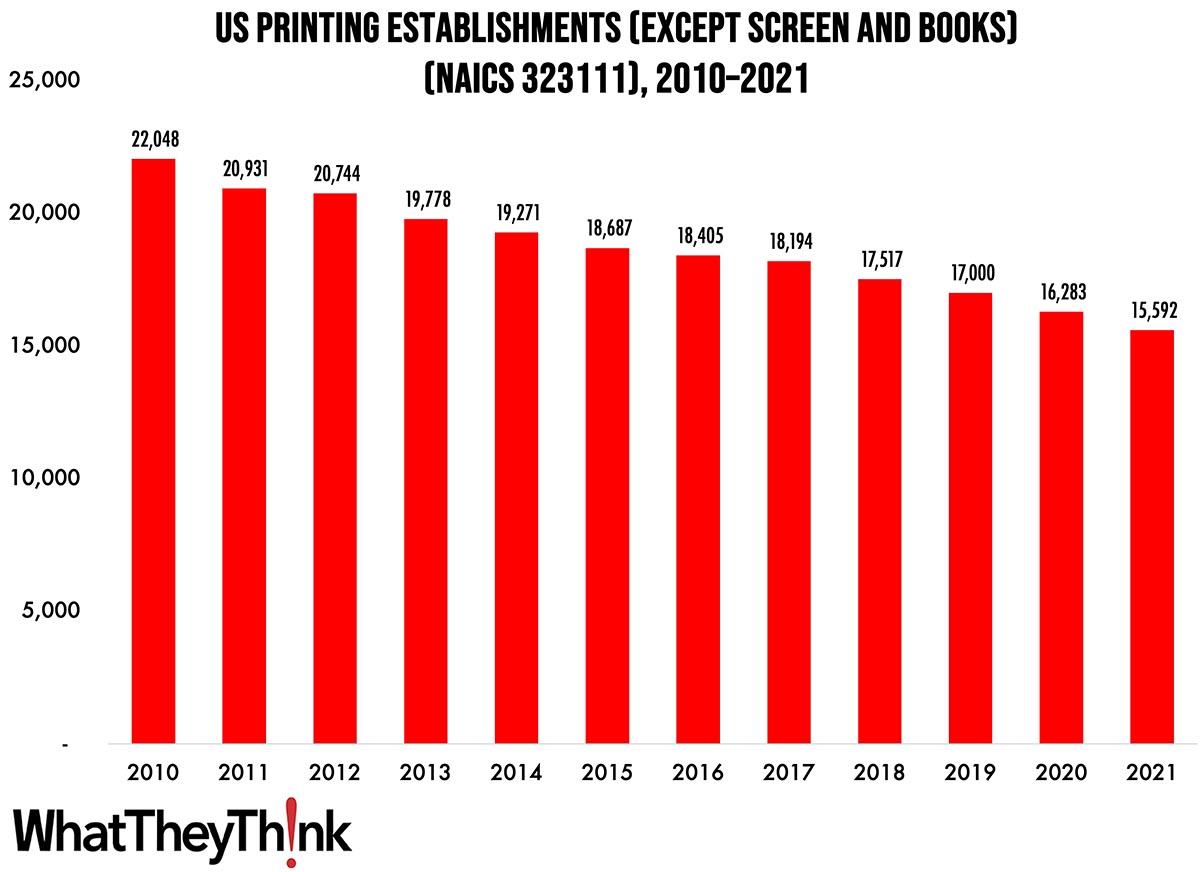
As 2021 began, there were 15,592 establishments in NAICS 323111 (Commercial Printing except Screen and Books). This represents a decline of 26% since 2010.
The Bureau of the Census definition for this business classification:
This U.S. industry comprises establishments primarily engaged in commercial printing (except screen printing, books printing) without publishing (except grey goods printing). The printing processes used in this industry include, but are not limited to, lithographic, gravure, flexographic, letterpress, engraving, and various digital printing technologies. This industry includes establishments engaged in commercial printing on purchased stock materials, such as stationery, invitations, labels, and similar items, on a job-order basis. Establishments primarily engaged in traditional printing activities combined with document photocopying services (i.e., quick printers) or primarily engaged in printing graphical materials using digital printing equipment are included in this industry.
The biggest declines were in the early years of the decade (but see statistical note below), thanks to the Great Recession, with establishments dropping 5% from 2010 to 2011. Things stabilized by mid-decade, but consolidation picked up toward the end of the decade, with establishments declining 8% from 2018 to 2021. So the impact of COVID wasn’t as bad as we might have thought.
A statistical note. In the 2012 Economic Census, the Census Bureau overhauled the three-digit NAICS 323 and rolled up a number of sub-categories. (In the industry, we call this “consolidation.”) In 2010 and 2011 (that is, prior to 2012), the categories in NAICS 323 were:
- 323 Printing and related support activities
- 32311 Printing
- 323110 Commercial lithographic printing
- 323111 Commercial gravure printing
- 323112 Commercial flexographic printing
- 323113 Commercial screen printing
- 323114 Quick printing
- 323115 Digital printing
- 323116 Manifold business forms printing
- 323117 Books printing
- 323118 Blankbook, looseleaf binders, and devices manufacturing
- 323119 Other commercial printing
- 32312 Support activities for printing
- 323121 Tradebinding and related work
- 323122 Prepress services
Following the 2012 Economic Census, NAICS 323 was slashed down to:
- 323 Printing and Related Support Activities
- 32311 Printing
- 323111 Commercial Printing (except Screen and Books)
- 323113 Commercial Screen Printing
- 323117 Books Printing
- 32312 Support Activities for Printing
Many of those sub-NAICS categories were combined into 323111. To arrive at the 2010 and 2011 numbers in the chart above, we combined establishments for NAICS 323110, 323111, 323112, 323114, 323115, 323116, 323118, and 323119 to arrive at establishments for new NAICS 323111. Note that screen and book printing were left to their own NAICS categories.
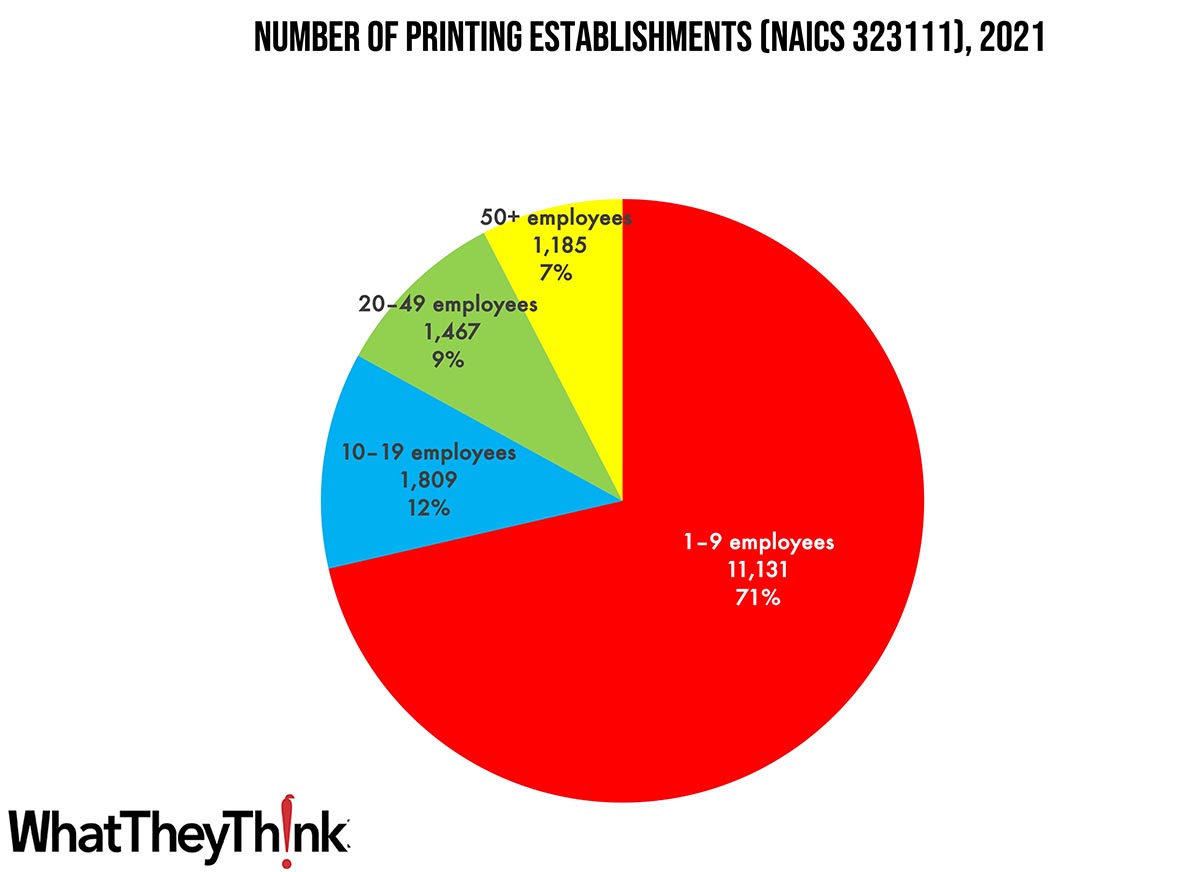
Small shops (1 to 9 employees) still comprise the bulk of the industry, accounting for 71% of all establishments. The largest shops account for only 7% of industry establishments with mid-size shops accounting for about one-fourth of establishments. These percentages have not varied substantially since at least as far back as 2010.
These counts are based on data from the Census Bureau’s County Business Patterns. Throughout this year, we will be updating these data series with the latest CBP figures. County Business Patterns includes other data, such as number of employees, payroll, etc. These counts are broken down by commercial printing business classification (based on NAICS, the North American Industrial Classification System):
- 323113 (Commercial Screen Printing)
- 323117 (Books Printing)
- 32312 (Support Activities for Printing—aka prepress and postpress services)
These data, and the overarching year-to-year trends, like other demographic data, can be used not only for business planning and forecasting, but also sales and marketing resource allocation.
This Macro Moment…
Said the Bureau of Labor Statistics earlier this week:
The Consumer Price Index for All Urban Consumers (CPI-U) rose 0.6 percent in August on a seasonally adjusted basis, after increasing 0.2 percent in July, the U.S. Bureau of Labor Statistics reported today. Over the last 12 months, the all items index increased 3.7 percent before seasonal adjustment.
If you’ve been to the pump recently, you can pretty much figure out what the biggest contributor was:
The index for gasoline was the largest contributor to the monthly all items increase, accounting for over half of the increase. Also contributing to the August monthly increase was continued advancement in the shelter index, which rose for the 40th consecutive month. The energy index rose 5.6 percent in August as all the major energy component indexes increased. The food index increased 0.2 percent in August, as it did in July. The index for food at home increased 0.2 percent over the month while the index for food away from home rose 0.3 percent in August.
Core inflation dropped from 4.7% to 4.3% for the 12 months ending in August, its slowest pace since September 2021.
So gas and services were the key culprits in this inflation spike, which may unfortunately lead to another interest rate increase from the Fed. We’ll find out about that next week.


